

Nilesh Akre
Lean Six Sigma Black Belt
-
Joined
-
Last visited
-
Alpha value: Is the probability of making mistake of rejecting good lot i.e. rejecting null hypothesis when it is true Beta value: Is the probability of making mistake of accepting defective lot i.e. accepting null hypothesis when it is false Alpha value is producer's risk whereas Beta is Consumer's risk. When Alpha decreases Beta value increases and vice versa. Deciding Alpha and Beta value depends on circumstances. Generally alpha value is kept at 5% and Beta value at 20% When to keep Alpha below 5% and beta above 20% When cost is the focus When margin is low in case of cheap items like nails manufacturing When to keep Alpha above 5% and beta below 20% When it relates with the human safety and mistake may result into big disaster When it relates with competency and skill Examples 1.In case of costly item alpha can be kept as low as possible as the rejecting good lot can not be affordable 2.In low cost items alpha can be kept low as defective nails not going to affect consumer too much 3.In manufacturing of airways assembly and spare parts where defective parts may result into disaster ,alpha value should be kept as large as possible so as to reduce the type 2 error i.e beta value 4.While selecting top management candidate alpha value should me more than 5% to reduce the beta value as selection of wrong candidate will not be affordable to organization whereas in low skill job case is reverse ,alpha can be kept more than 5% as low skill candidate can be trained .
-
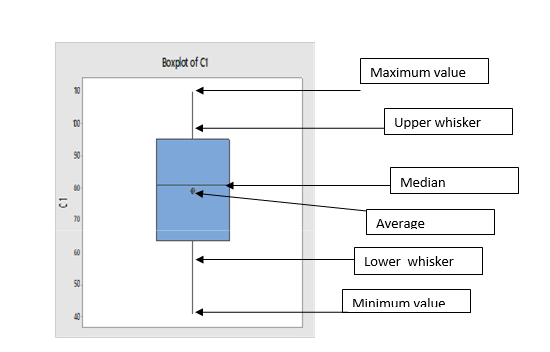
BOX PLOT.docx What is Box plot Is a graphical tool used to know the spread of the data or variability in a set of data. It also shows whether the distribution having skew or not and outliers means any unusual observation When to be used It is to be used when we have large range of data or multiple set of data which is related with each other in some way It is to be used when predictor value(X) is descrete and respond value (Y)is continuous. When there is a bias for unusual observation box plot to be used Example 1.when one wants to show graphical representation of marks scored by students in exam 2.when one wants to show graphical representation of data before and after improvement 3.No of accounts handled by managers,etc How to interpret the box plot Box plot has the following main five parts 1.Lower quartile range (Q1): This indicates 25% data belong up to this range 2.Median(Q2): 50% of data points lies below and 50% above this range 3.Upper quartile range(Q3): This indicates 75% data belong up to this range. 4.Minimum value of data set 5.Maximum value of data set It also indicates whether data has any outlier means the data point much far away from either from Q1 or Q3 calculated by following way Q1-1.5 X(Q3-Q1) or Q3+ 1.5X(Q3-Q1) Line extending from lower end of the box is known as lower whisker and line extending from upper end is known as upper whisker Just see the examples of average marks obtained in the class 84 110 98 41 75 60 86 78 We can interpret the graph as below Minimum score is 40 Maximum score is 110 25% students scored between 40 to 63 50% students scored below 81 and 50% scored above 81 75% students scored between 40 to 95 also we can say 25% students scored above 95 Average marks scored by students is 80 In this way we can easily classify the data by just seeing visually in box plot.
-
In day to day life there are number of examples of binomial distribution like 1. exam result pass or fail 2. application reject or not reject 3.bus will come or not come 4.product defective or not defective Binomial distribution has following characteristics 1.This distribution has only two possible outcomes for n number of trials like yes or no,go not go ,pass or fail, More familiar example for binomial distribution is coin toss where only two possible outcomes are possible either Head or Tail for n number of trials 2. Trails are fixed say “n “ numbers and all are identical. 3.Probability of success (p) remains constant from trial to trial 4. Result of each trial is independent of other trial. Example:Suppose in exam there are 10 questions and each question has four possible answers out of which only one is correct then probability of any answer being correct is 1/4=0.25 - This probability of correct answer will be same for each question. To calculate the probability of all answers being correct: probability of success on single trial = 0.25 Trials = 10 Successes = 10
-
pilot Before implementing a feasible solution test is carried out on small scale on target population It focuses on value of the project Success or failure of the pilot project decide whether it should be repeated or not Helps to understand the risk in solution Makes full scale implementation more effective Prototype Before implementing the pilot project a prototype is made to see how the model or solution will work. In one way we can say simulation is carried out It focuses on the value of design cycle It involves multiple iteration and after trail one decide what changes should in next trail Used to obtain customer feedback for new product Data collected while testing new design helps to improve product or design
-
"Well we had a great experience while training.Faculty was very good. Big exposure to practical situation. Explaining skill was excellent" -Nilesh Akre, Quaker Chemical
-
In the given example ,Cp =1.33 and Cpk =1.11. It means process is capable of making parts within specification limit as Cp =1.33 whereas Cpk=1.11 we can say that process is not centered as Cpk not equal to Cp i.e it is closure to one of the specification limit i.e either USL or LSL In our example as Cp is good ,variation is acceptable.As Cpk is bad (not equal to Cp) and it is less than Cp value, we need to shift the the Mean to center the process within specification limit without increasing variation
-
A brainstorming session is usually done to generate creative ideas and possible solutions where every participant is encouraged to think aloud and suggest as many as possible regardless how effective they are. No answer is judged right or wrong. In a nutshell, brainstorming--gather many ideas as much as you can. After the gathering of these ideas, they are filtered, evaluated, deliberated in a separate session leading to nominal group technique. NGT is preferred over traditional Brainstorming where conflict is to be avoided In Brainstorming session participant are less supposed to be involved as they may have fear they will look foolish or stupid whereas in NGT each member is allowed to think individually and anonymously vote for the best ones NGT is preffered - when some group members are much more vocal than others when some group members think more in silence when there is a concern about some participants not participating when all or some group members are new to the team when the group does not easily generate quantities of ideas when the issue is controversial or there is heated conflict when stakeholders like some quantitative output of the process When there is a power-imbalance between facilitator and participants or participants: The structure of the NGT session can balance these out.
