


Khalandar S
Members
-
Joined
-
Last visited
-
In E-Commerce sector, One process traditionally optimised using Lean Sigma is Processing of Order returns from Customers. This process have been optimised using Lean (eliminating/ reducing unnecessary return steps) and six sigma methodology (Reducing defects like incorrect refunds etc.,). Some of the common improvements like: Standardised Return labels & automated RPA workflows Establishing a Centralised return centre for faster and effective Return processing. Operation Data Analytics to identify frequent return reasons However, these improvements don't address the core inefficiencies like High Return Rates, Fraud and Manual Inspection bottlenecks. Hence, improving the process further wont benefit in fixing these inefficiencies. So, this process ripe for "AI Driven Re-Imagination". Here, the AI re-imagination becomes essential which focus on: Preventing the predictive returns based on data analysis on customer behaviour (like browsing patterns, order history) and flag the high risk orders before shipping. And also, Generative AI Chatbots can suggest correct sizes and products pre-purchase to reduce returns. Smart Automated Inspection can instantly assess the returned item condition, auto detecting the wear/ damage without human touch. Machine learning models auto verify and approve/deny refunds based in Fraud patterns (ex: Serial returners) From above AI re-imagined process, Return centres become Profit centres instead of Cost sink with AI slashing processing cost to significant extent proactively So, Lean Six Sigma can't predict or prevent returns. It only optimises existing process slightly better and make the process faster. On another side, AI flips the model entirely from Reactive to predictive
-
In the Improve phase of DMAIC methodology, the team brainstorm & identify the feasible solutions to address the root cause identified in the previous phase i.e., Analyse Phase. In general, Team brainstorm and generate possible solutions using tools like Brainstorming, Affinity Diagram, Benchmarking, Yokoten Opportunities(Horizontal Deployment practices). In the second step, Team selects the techno commercial feasible solution among all possible solutions using the techniques like Impact-Effort matrix, Pugh matrix for decision making. After this, Pilot the identified solution in controlled environment to check the solution effectiveness and also to uncover the unforeseen issues in the solution. Finally, the solution will be refined based on the pilot result for full scale implementation followed by measure the results to ensure the changes are delivering expected benefits. If we take the case of a software company dealing with slow bug fixes, It should follow the basic and standard procedure of Improve phase mentioned as above to select the best idea between more coders or better testing tools. The Improve phase rely on the fundamental concept - "not just any solution, but the right one for the environment, resources, and long-term goals" of the organisation. To pick the best one out of the two solutions, I would follow the below approach: Validating the ideas directly target to the actual problem (For example, If the slow bugs due to high manual testing cycle time, then automated testing tools are more likely to improve the turnaround times than hiring more developers) Scoring the solutions using structured evaluation (Tools like Pugh matrix, Cost benefit matrix) to evaluate the ideas based on high ROI. Piloting the two solutions at small scale in a controlled environment would help to monitor the KPI trends, user feedback etc for the both and can be adapt the plan based on actual outcomes To anticipate and reduce the Resistance, A robust feedback mechanism might help to collect the feedback real time and creating communication channels to address the pain points of team proactively (why change is happening and how it benefits them). And also, highlighting and celebrating quick wins from the pilot would engage the team early and ensure the team participation and engagement during full scale deployment.
-
Key Risk Indicators (KRIs) can be used to manage a process. KRIs are metrics that help identify potential risks that could impact a process. They act as early warning signals, allowing organizations to take proactive steps to mitigate risks before they become major issues. Companies often prioritize KPIs over KRIs because KPIs focus on measuring the success and efficiency of a process. KPIs provide clear, quantifiable data on how well a process is performing, which is crucial for achieving business goals. For example, a KPI might measure the number of products produced per hour, helping a company understand its productivity. KRIs, on the other hand, focus on potential risks that could hinder performance. While important, they are often seen as secondary because they deal with what might happen, rather than what is happening. Benefits of Using KRIs Early Detection of Risks: KRIs provide early warnings about potential issues, allowing organizations to address them before they escalate. Improved Decision-Making: By understanding potential risks, companies can make more informed decisions. Enhanced Risk Management: KRIs help in identifying and mitigating risks systematically Limitations of Using KRIs Complexity: Identifying and monitoring KRIs can be complex and resource-intensive. Data Reliability: KRIs rely on accurate data, which can sometimes be difficult to obtain. Overemphasis on Risks: Focusing too much on risks can lead to a conservative approach, potentially stifling innovation. In summary, while KRIs are valuable for managing risks and improving decision-making, they are often seen as secondary to KPIs, which provide direct insights into process performance. Balancing both is crucial for comprehensive process management.
-
Organizations should consider several factors when deciding between Business Process Reengineering (BPR) and Lean Six Sigma. BPR is best suited for situations where radical change is necessary. It involves completely rethinking and redesigning processes to achieve dramatic improvements. This approach is ideal when existing processes are fundamentally flawed or when the organization needs to make significant leaps in performance. On the other hand, Lean Six Sigma is more appropriate for incremental improvements. It focuses on reducing waste and improving quality through systematic, data-driven methods. Lean Six Sigma is ideal for organizations looking to refine and optimize their existing processes rather than overhaul them entirely. In many cases, these approaches can complement each other. For example, an organization might use BPR to redesign a process and then apply Lean Six Sigma principles to fine-tune and optimize the new process. While they have different methodologies, their ultimate goal of improving performance can align, making them compatible in a strategic framework. Ultimately, the choice between BPR and Lean Six Sigma depends on the specific needs and goals of the organization. By understanding the strengths and limitations of each approach, organizations can make informed decisions that drive effective change.
-
One practice in any organization that seems efficient but isn't is the Automated weekly status reports. These reports are generated automatically from our project management software and are supposed to provide a quick overview of project progress. At first glance, this practice appears efficient because it saves time and ensures consistency. However, when viewed through a Business Excellence lens, several hidden inefficiencies become apparent: Lack of Context: The automated reports often lack the context and nuances that a manual report might include. Important details about project challenges or team dynamics are missing, which can mislead decision-makers. Data Accuracy: The data pulled into these reports is only as good as the input. If team members do not update the project management software accurately or timely, the reports can contain outdated or incorrect information. Over-Reliance on Automation: There's a tendency to rely too heavily on these reports without cross-checking the data. This can lead to overlooking critical issues that aren't captured by the automated system. Reduced Engagement: Team members may feel less engaged with the reporting process since it's automated. This can result in a lack of ownership and accountability for the data presented. In terms of Business Excellence principles, these reports fail to provide the necessary insights for continuous improvement and informed decision-making. They create a false sense of efficiency while hiding underlying issues that need attention. A more effective approach would involve a combination of automated data collection and manual review to ensure accuracy, context, and engagement.
-
One AI solution I’ve thought about is a smart assistant designed for customer support in a busy e-commerce platform. Since it would be handling thousands of customer queries every day, the way it communicates and interacts with users becomes extremely important. To make the experience truly user-friendly, I would focus on a few key design elements: Tone of Responses: The AI should always sound polite, calm, and genuinely helpful. Even when dealing with frustrated customers, it should respond in a way that feels respectful and understanding. For example, instead of saying “That’s not possible,” it could say, “I understand your concern. Let me see what I can do to help.” Response Time: The assistant should reply almost instantly, but with a slight pause to make it feel more natural—like it’s actually thinking. This helps avoid the feeling of talking to a machine. Feedback Style: After completing any action, the AI should clearly confirm what it did. For instance, if it cancels an order, it should say, “Your order has been successfully cancelled. You’ll receive a confirmation email shortly.” Handling Errors: When something goes wrong, the AI should explain the issue in simple, easy-to-understand language and offer a next step. For example, “Oops, I couldn’t process that right now. Would you like me to try again or connect you to a human agent?” Personalization: The AI should remember basic user details like their name, past orders, and preferences. This makes the interaction feel more personal. For example, “Hi Riya, I noticed you ordered a phone case last week. Would you like to track that order?” Clarity and Simplicity: The language used should be clear and free of technical jargon. Even someone who isn’t tech-savvy should be able to understand and use it comfortably. Empathy: This is one of the most important aspects. The AI should be able to recognize when a user is upset or confused and respond with extra care and patience. A little empathy can make a big difference in how the user feels. If I were to design any AI solution, I would always make sure it includes clear communication, emotional intelligence, and a touch of human-like warmth. These qualities help turn a basic tool into a truly helpful and pleasant experience.
-
In high-pressure situations, team members may unintentionally use words or phrases that break compliance rules. A smart AI assistant can help by reviewing drafts quietly and pointing out potential risks before the message is sent. Compliance Risks the AI Can Prevent Accidental Sharing of Private Information Stops team members from revealing company secrets or sensitive data. Flags messages that may contain business strategies or performance details that should stay confidential. Breaking Industry Rules Checks that messages follow professional standards like ISO, Six Sigma, or Lean principles. Helps make sure reports and emails are accurate and compliant with company policies. Unrealistic Promises or Misleading Claims Warns against claims that sound too good to be true, like extreme cost savings or efficiency improvements without proof. Ensures that statements are backed by real data to avoid misunderstandings. Biased or Unethical Language Identifies words or phrases that could unintentionally discriminate or show favoritism. Encourages inclusive language when discussing team performance and process improvements. How the AI Can Offer Feedback Without Disrupting Work Soft Suggestions Instead of Warnings The AI highlights risky words in yellow instead of red, making it less intrusive. Provides polite suggestions for better wording rather than blocking messages. Context-Based Advice Instead of generic alerts, the AI suggests professional alternatives based on compliance rules. Example: Instead of saying “This is wrong,” it may say, “Consider adding supporting data.” Gradual Learning for Better Messaging Over time, the AI understands team preferences and refines its suggestions. Helps team members improve their communication without disrupting workflow
-
While AI-driven prompt and flow-based solutions are widely used for customer support, an unconventional yet highly impactful application in IT is Automated Root Cause Analysis (RCA) for incident resolution. In large-scale IT operations, identifying the root cause of system failures or performance issues can be time-consuming and requires expert analysis. AI can streamline this process by guiding engineers through structured RCA workflows using dynamic prompts and decision logic. Use Case: AI-Assisted RCA in IT Infrastructure Monitoring Context: An enterprise IT team manages a cloud infrastructure hosting critical applications. Suddenly, a performance degradation issue arises, affecting end-user experience. Instead of relying solely on engineers manually diagnosing the problem, AI-driven RCA is activated. How AI Uses Prompts and Flow Logic: Incident Classification: AI receives system logs and error reports. It prompts engineers with structured questions, like: "Is the degradation affecting multiple services or isolated to one?" Flow logic categorizes the issue (network latency, database congestion, API failures, etc.). Guided Diagnosis Steps: AI generates next-step prompts based on user responses. If the issue is database-related, AI suggests running queries to check load spikes. If network-related, AI proposes checking packet loss or server response times. Correlation and Knowledge Retrieval: AI references past incident patterns and known resolutions. It surfaces relevant documentation or prior fixes using embeddings-based search. Recommended Action & Automation: Based on insights, AI suggests mitigation steps (e.g., increasing memory allocation, restarting services, or applying patches). If approved, AI triggers automated corrective scripts. Why This Application Stands Out Accelerates Incident Resolution: Engineers can diagnose and fix issues significantly faster by avoiding manual trial-and-error troubleshooting. Reduces Dependency on Senior Experts: AI enables junior engineers to follow structured RCA processes without deep expertise. Improves System Reliability: Prevents repeated failures by learning from previous incidents and suggesting proactive measures. Enhances Knowledge Retention: Converts tribal knowledge into reusable AI-driven insights. This approach revolutionizes IT operations by making incident management more efficient, scalable, and intelligent, leveraging AI beyond traditional support tasks.
-
When an AI agent faces two competing objectives, it needs a framework to guide its decisions. This framework can rely on factors like the importance of each objective, the context of the situation, customer feedback, and predefined rules or priorities. The AI can also adapt over time based on learning from past outcomes to make better trade-offs. For example, An AI hotel assistant must balance two goals: following company policies (like a strict cancellation fee) and delighting a loyal customer. Imagine a frequent guest requests a last-minute room cancellation without the usual penalty due to a personal emergency. The AI needs to decide whether to enforce the fee or make an exception. How the AI handles it: Identify the Guest: The AI recognises the guest as a frequent and high-value customer based on loyalty points or booking history. Apply Flexible Rules: While the default is to apply the cancellation fee, the AI is designed to allow exceptions for loyal guests in special circumstances. Factors to Guide the Decision: Sentiment Analysis: If the guest sounds distressed, the AI prioritizes empathy and offers a waiver. Long-term Value: It considers how waiving the fee could strengthen loyalty and lead to more future bookings. Context: The reason for cancellation (e.g., an emergency) might justify relaxing the policy.
-
In many work environments specific to IT sectors supporting Data Collaboration Platforms (SaaS-based applications), there are certain tasks or decisions that feel inherently "too human" to delegate to AI. These tasks are typically handled by Customer Success Managers and Implementation Specialists, such as understanding customer needs, providing the right resolution at the right time in real-time, and delivering difficult feedback. These situations often require a deep understanding of client behavior, human emotions, empathy, and the ability to navigate complex interpersonal dynamics to improve CSAT and customer retention. Building AI Solutions To build AI solutions for these areas requires historic data trends, customer behavior patterns, employee skills and competencies, and customer feedback to train the LLM model. This process demands significant time and resources to make the solution robust and reliable. Many companies might hesitate to adopt such AI-enabled solutions due to ROI and other commercial factors. The reasons why it feels "Too Human" are: Logical Reasoning and Emotional Intelligence: Resolving conflicts or providing feedback involves reading subtle emotional cues, understanding the context of the situation, thinking out of the box, proactively communicating information to the client, and responding with empathy and sensitivity. Building Trust and Rapport: Agents are more likely to respond positively to feedback or conflict resolution efforts when they feel understood and valued by a human counterpart. Completeness and Correctness in Communication: These tasks often require a completeness and correctness in communication that AI might struggle with, such as tone, body language, and cultural context. Reimagining AI's Role While AI might not replace the human touch in these scenarios, it can certainly be a valuable contributor by supporting and enhancing the process. Here are some ways to reimagine AI's role: Data Analysis and Insights: AI can analyze patterns in employee behavior, feedback, and performance data to provide managers with insights that can inform their approach to sensitive issues. Training and Simulation: AI can be used to create training programs and simulations for managers to practice handling difficult conversations, improving their skills and confidence. Emotional Support Tools: AI-driven tools can offer employees a safe space to express their concerns anonymously, providing initial support and identifying issues before they escalate. Feedback Collection: AI can facilitate the collection of feedback from employees, helping to identify common concerns and areas for improvement without the pressure of face-to-face interactions. Resource Recommendations: AI can suggest resources, such as articles, videos, or training modules, to help managers and employees navigate difficult situations more effectively.
-
The IMR (Individuals and Moving Range) control chart is widely used to check the stability of a process over time and it is true that the IMR chart assumes that the data follows a normal distribution, but in reality, data often deviates from normal distribution. One approach to resolve such scenario is that data transformation techniques from non-normal to normal using various transformation techniques like Box-Cox transformation, logarithmic and square root transformations. After transforming the data, we can plot a control chart and check for process stability. But the limitation of this approach is that some transformations may not work well for certain types of data (If data set is either not well represented or contain outliers) which led to bias. Therefore, it is recommended to use transformed control charts as a replacement for traditional control charts. Transformed control charts can be useful in detecting process instability when normality assumptions are violated. However, it's important to note that transforming the data doesn't always guarantee that it will follow a normal distribution. Additionally, if the underlying process is non-normal, using a transformed control chart may not accurately reflect the true process behavior. In conclusion, using transformed data can be a useful tool for checking process stability when the underlying data is non-normal Some practical examples of transformed control charts are: 1. Manufacturing: A chemical manufacturing plant wants to monitor the concentration of a certain chemical in their production process. However, the data is highly skewed and does not follow a normal distribution. To address this, they apply a logarithmic transformation to the data and use an X-bar chart with transformed data to monitor the process mean over time. 2. Service: A software development team wants to monitor the number of bugs found in their code during each sprint. However, the data is highly skewed and does not follow a normal distribution. To address this, they apply a Box-Cox transformation to the data and use an individuals chart with transformed data to monitor the process variability over time. In each of these examples, transforming the data allows for more accurate monitoring of the process over time using control charts. It's important to note that choosing an appropriate transformation requires careful consideration of the underlying statistical properties of the data, as well as any practical implications for interpreting and acting on the results.
-
The "Way of Working" can refer to set of guidelines & methodologies that guide how work is done within a team or an organization. Ways of working is also known a Ground rules, working agreements, shared expectations etc. It describes the team's set of expectations for participation & collboration to achieve organization goals. It includes standardized processes, tools and behvaiours that are designed & developed to improve quality, efficiency & collaboration. In DMAIC methodology, WoW is most closely related to Improve phase, which focus on action planning & Implementation to fix the root cause of a problem. WoW helps to create a culture of continuous improvement in an organization by providing framework on following priciples. Standardized Processes and Workflow: Standardized processes and workflows ensure that everyone understands how work is done and how different activities are interconnected. Visual management tools like Standard work (Task Instruction Sheet(TIS)), Kanban boards, Gantt charts, Value stream Maps etc., can help provide transparency and clarity. Continuous Learning and Improvement: Embracing a culture of continuous learning and improvement is vital for a successful way of working. Encouraging experimentation, sharing lessons learned, and providing opportunities for professional development foster a growth mindset and drive innovation. Well defined Goals and Objectives: Having clear & well defined goals provide a sense of direction and focus for the work to be done that align with the overall purpose and strategy of the organization. Continuous Alignment with Strategy: The way of working should be aligned with the overall strategy and objectives of the organization. Perodical reviews and updating the SOP's as per best work practices to ensure they remain in line with the strategic direction Communication and Collaboration: Effective communication plays important role in creating successful collaboration and teamwork within organization. It involves active listening, sharing information, providing 360 deg feedback, clear and open lines of communication. Agile and Adaptive Approach: Many organizations are adopting agile methodologies to enhance their way of working. Agile emphasizes flexibility, iterative development, and continuous improvement. It enables teams to adapt to changing circumstances, respond to customer needs, and deliver value incrementally. Regular Evaluation and Feedback: Regularly evaluating progress, providing feedback, and conducting performance reviews are important aspects of the way of working. This helps identify areas for improvement, recognize achievements, and ensure alignment with goals and expectations. Efficient Use of Tools and Technology: Utilizing appropriate tools, technology, and automation can streamline workflows, improve efficiency, and enhance collaboration. It's important to assess the needs of the organization and choose tools that support the specific work processes. In summarized way, an Organization's Vision & Values describe breifly about it's way of working. Remember that, The way we orgnize our team depends on type of work we do. Hence, the Way of Working may vary across organizations and teams based on KPI's & business requirements, and it is important to customize the above priniciples to suit specific contexts and requirements.
-
Top-Down diagram is used for solving complex problems by breaking down it into sub problems (manageable tasks) until they are directly solvable. In Six Sigma Methodology, Top-Down diagram is used for mapping out and analyze the process (In "Measure" & "Analyze" phases of DMAIC & DMADV) Top-down diagrams are formatted from top to bottom and convey step sequentially and all these steps are connected with arrows. For example, A computer system made up of software, hardware, data, communication & people; that performs a specific task or solves a given problem. It represents the essential requirements & their sub activities to show complete process without too much detail, so that team will quickly understand the process improvement or problem-solving Opportunities in the given process. Below is the image for clear understanding on Top-down diagram. Some of Valid use cases of top-down diagrams are: 1. E -Commerce: For an E- Commerce company, in order to reduce lead time (Customer Promise date breaches) or to improve Order processing system, we can create a top down diagram to show various steps like Receipt of customer reservation at Fulfillment center, Payment processing, Inventory check, Order picking, Order Verification, Shipment Packing, Sorting as per location, Shipping the order & Delivery the item at Customer's location. 2. Customer Service Centers: We can create Top-down flow diagram for Issue Resolution team @ Customer Service centers -like Receiving Customer Complaints, Initial check, Assigning the call to relevant team, Issue investigation, Resolution & follow -up with the customer 3. Production Process: We can use a top-down flow chart to represent various steps involved in Production process from raw material entry to Finished Good Shipment delivered to customer - which include activities like Procurement of Raw material, Inward Quality, Manufacturing & Assembly steps, Final inspection, Packaging & Shipment 4. HR Process: A typical Top-down diagram for HR Process include the activities like Gathering Vacancies, Job posting, Screening the resume, telephonic Interviews, Skill assessment, reference check, final interviews, negotiating offers & On boarding of candidate As quoted by Mr. Steve Jobs - "If you define the Problem Correctly, you almost have the solution". Hence, the purpose of Top-down diagram is to provide visual framework of the entire process, Identification of Opportunities for Improvement to improve the process better.
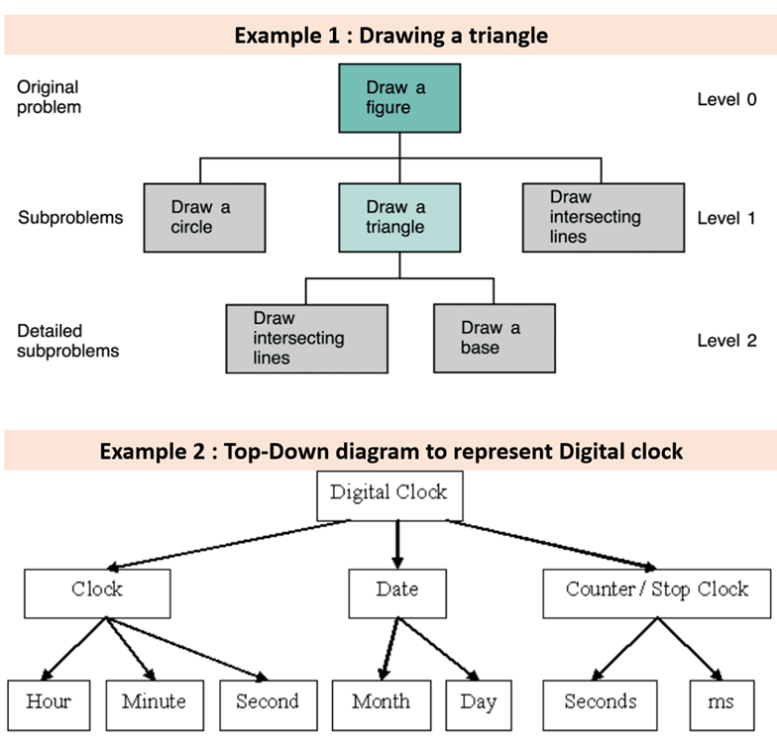
-
Normal Probability Plots are used to check whether or not a data set follows hypothesized distribution. Normal Probability plot has two versions : Q-Q & P-P. Q-Q Plot: Q - Quantile means that dividing the data set into Equal parts or Equal subgroups. The reason behind calling it as Q-Q Plot is that it takes the observed data on one axis & values derived from standard normal distribution with same data points on other axis. If the data is normally distributed, the probability plot will be a straight line. If the data is skewed, the probability plot will be curved. The Q-Q Plot plots the Quantiles of Actual data set against to theoretical values of Data set under normal distribution. These plots are used to find out the deviations in the tails of data distribution. P-P Plot: Probability - Probability Plot plots the cumulative distribution functions of data set (Empirical on one axis vs specified theoretical on other axis). These plots are widely used to find out the deviations from normality in Centre of data distribution. Below image is one of the good explanation to understand the Probability Curve vs Data distribution of various data sets. There are various reason why a curve has deviation from a straight line on a Probability. Some of the reasons may be: The data set is not well represented & distributed The data set contain outliers (good & bad) The data distribution is incorrect Its important and recommended that if a curve deviated from Straight line on a Probability plot, we should investigate the root cause for the deviations through data examination, analysis on Outlier(s) & trying different hypothesized distributions.

-
For tracking the delivery time of each order in Domino's, it is recommended to use Z MR chart to check the process stability. For better Understanding, let’s have a quick look on the I MR & Z MR charts. I MR Chart: When you have Single run process (Ex: Mass Production, High Volume - Low Mix Manufacturing process etc.) When you have good amount of data and more than 25 Data points Its suitable for long run process Z MR Chart: When you have different runs in a Process (Ex: Batch production, E Commerce, Telecom Service, High Mix & low Volume etc.,)' It is used for short run processes (Each run has its own process paraments - Process Mean & Standard deviation) When you have limited data (Short run processes do not have good amount of data for the good estimation of Process parameters) Like I_MR chart, Z_MR chart has 2 charts, namely Z chart & MR Chart. In Z Chart, the distribution consists of Observation in X Axis & Standardized Individual Observations (Z values) in Y Axis (Standardized "Z' is nothing but the Z value of each run & the formula of Z = (X - X bar)/ Std Deviation of each run). The above calculation leads to Z distribution, plots over Process mean (X bar=0) and Process standard deviation (Sigma=1) On other hand, MR Chart consists Observation data points on X axis and Moving range of Z values on Y Axis. It monitors the variation between consecutive Standardized Individual Observations (Z Values) of the process which has different runs. The control limits of Z Chart are Straight forward. The Process mean is O & control limits are -3 & 3 The MR chart has always had UCL = 3.686 (D4*1.128) and LCL =0 and Average Moving Average (MR)= 1.128 because data are standardized in Z chart. To plot the Z-MR chart in Minitab, Choose - Stat - Control Charts - Variable charts for Individual - Z MR chart


