Venugopal R
Members
-
Joined
-
Last visited
Everything posted by Venugopal R
-
This has been a very enthusiastic debate. I would like to give my concluding remarks based on all the inputs so far. It is very heartening to see that there are many proponents who strongly stick to the belief that zero defect is achievable. This is a positive mindset that deserves to be respected. Now, when someone says ZD is not achievable, one may interpret in two different ways. 1. The person doesn’t want to try enough and is trying to easily give up. No one wants to be identified like this…… or 2. The person is setting a standard for defining zero defects that it is not a target that can be reached in totality. Striving for ZD is an extremely important ambition and the right set of actions will take you very close to it. If I elaborate on the point no.2, the following perspectives emerge. Zero defect is not seen as a realistic achievement when: It is applied only for a specific product or activity for a certain period of time. The various wastes in the organization are not curbed, but the final output is termed zero defect. Certain process are proven to be defect free, using advanced techniques, mistake proofing etc., for reasonable time, but certain other processes generate RW and other wastes. There is another competitor who is able to produce with either higher effectiveness or higher efficiency. Even if the customer specifications are met, but the tolerances given by the customer are lower than 100% Quality. Many after effects emerge, that harm society over a period of time, e.g. environment pollution, e-Waste, pollution due to batteries, harm due to pesticides etc. (In many of the advancements that humanity has made, we have realized, sometimes after many years that we have released so much of adverse effects that harm the society). Finally, I would request all to think of Taguchi’s loss function, which explains the slightest deviation from the targeted value leads to loss for society. I am open to individually discuss further with anyone in this forum on this subject. Thanks for all the inputs and viewpoints. Best wishes!!
-
-
ZD was conceptualized as a management methodology to continuously reduce and work towards eliminating all types of wastes in an organization. Obviously the idea is to reduce overall costs without compromising Quality. It has not specified any limit, hence there is tendency to for the literal implication of zero defect. Many fundamental disciplines need to be understood and complied across organization and imbibed into the org culture to drive this program. Many companies have embarked on this journey without the due detailing and ended up seeing costs go up. So, it is not just ensuring a defect free output, but balancing all processes to operate optimally and efficiently. It was many years later that the concept of Six Sigma came up with a quantification of the defect levels, and as we know, it is greater than zero. So if zero defect was literally "zero" defect program, why should the world move 'backwards' to a program that defines a higher rate of defect?
-
I wouldn’t want to make this discussion philosophical. This is not just a question of belief alone. As a professional, one should anticipate and set expectations realistic. There should be a desire, passion and concerted planning and efforts to deliver high quality. It shouldn’t remain as a desire alone. Reality has to be understood and addressed. Just like believing and running a “Six Sigma” program in an organization may not make every process to operate at six sigm level Quality, driving zero defect thought process need not mean that the processes will become 100% defect free!
-
Everyone has brought out great points which deserve to be respected. The passion to believe that 'Zero Defect' is NOT an impossibility is very encouraging. However, prior to this debate, the question was initially asked as a Yes / No question with no conditions and no room for explanations or deeper interpretations - "Is Zero Defect achievable?". All the answers that support this have some conditions attached., viz. it comes with a cost, it is possible with sufficient planning, could be done with mistake proofing, it is a management concept etc. etc. I am a strong supporter of the zero defect thought process, but when it comes to answering this question unconditionally, I would maintain a "no". No quality standard is complete without a "corrective action" clause. Big brands do have well defined customer service clauses that include warranty services and product recall procedures. Inspection and rework lines are built in even the best of production lines. Robust design and Mistake proofing techniques have greatly helped in improving efficiencies and reducing human dependencies and thus reduced errors. Even then, it is hard to find a 100% mistake proofing for all processes in a production line or a service industry. Even a 7 sigma process is termed as 'Near Perfection', but still not perfect! All of us know that the normal distribution will touch the X axis only at infinity! When we buy a product, say a Television set, we expect it to perform defect free for a reasonable period of time. In a large population of TV sets from highly reputed manufacturer, the defect rate is expected to be extremely low, but certainly it is still not zero. You may visit the nearest service center for any product to find out! Yet for those small portion of affected customers, what is considered very important is the prompt response and remedy with least inconvenience. When we say zero defect, it cannot be even one in a million. It is very important to encourage the philosophy of 'zero defect', and continuously strive towards it, but one has to be very careful before making a claim of achievement. An organization might do its best to overcome most of the factors that are controllable, but there are factors that may not be controllable and it wouldn't be practical to build a factor of safety for all such factors. We should not permit over complacency to set in that would come in the way of planning good remedial and recovery plans, for which failures need to be anticipated and mitigation plans built in. Many safety systems that necessarily may not prevent failures, either due to product or due to external factors, but help in reducing severity of the impact in an 'unlikely' event. Just as in an FMEA exercise, we tend to prioritize the actions based Severity, Occurrence and Detection, but may not necessarily eliminate all possibilities 100%. The "Zero defect" thought process will continue to be key driver for continuous improvement, and would help to intelligently understand and manage the variabilities more proactively to provide products and services that keep up with ever revising Quality and Reliability expectations.
-
I am seeing the debate is shaping up now. "Zero Defect" is a management philosophy, believed to be coined by Philip Crosby (if I recall right); and it aims for doing very preventive set of activities as part of the TQM program in an organization. It is a constant effort, and I am not sure whether one says "it is done for good". It is a work culture that has to prevail and needs to be augmented for ever. There is nothing like saying "We have achieved zero defects". That's why I have been emphasizing that we first need to define what we mean by zero defects. And there are some occasions where the strive for zero defect in physical terms may not be a desirable thing. For instance an on time functioning of an airline for achieving "Zero defect" cannot become an obsession that could endanger the safety of passengers. it is OK to have the defect in this case, even to the dissatisfaction of the customers, so long as it is a better decision on the long term interest. When you mention about a company having achieved 'Zero defect', does it mean that there are no more targets for the company to improve? Never!
-
There are many situations where we really require zero defect. like already pointed out "Surgical set up" , or a "plane landing". The question here is not about zero defect required or not.. It is about "Is zero defect achievable?" When we say zero defect does it mean: 1. Absolutely no defect from a process... for how much duration? For ever? 2. Are we drawing some upper and lower tolerance on % defects or DPMO. and so long as the defect rate falls with in a service level agreement, are we going to accept it as zero defects? 3. if we are talking about a particular product, on which multiple defects can manifest,... when we say zero defect, are we referring to the non-occurrence of a particular defect or do we mean that no defect type should occur? 4. Are we referring to only the final output? Are we ok to have inprocess defects, but the final outcome is expected to be zero defect? 5. When we say zero defect, are we ignoring other factors like delivery time, processing cost, productivity etc? WHAT IS ZERO DEFECT? DEFINE IT.
-
It is highly debatable... as to what each one of us have in our mind as a definition for zero defect... and what kind of expectation that we hold. It also depends upon what process, product or service we have in mind. Hence, if we are asked a question in general "Whether zero defect is achievable?", and we just say "Yes" it can never be a reasonable answer.
-
-
ARMI stands for Approver, Resource, Member, Interested Party RACI stands for Responsible, Accountable, Consulted, Informed For delivering an assignment that involved cross functional participants, the nature and extent of participation and involvement is brought out using the ARMI or RACI matrix. Although there appears to be interchangeability in the use of these two methods, we may best use them as below: While defining a project charter, (say, a Six Sigma project), there is a requirement to identify the stakeholders and how those stakeholders will be connected to the project. ARMI provides a method to identify the roles of various stakeholder for the project. The 'Approver' provides approval for team decisions, expenses & other matters and authorizes the team to move forward at appropriate stages of the project. It could be the project sponsor, champion or the senior personnel in the organization with approval authority. The 'Resource' implies such resources possessing necessary skills or subject matter expertise relevant to the project. These resources usually stick to their jobs of expertise and are administered / consulted by the sponsors and team leaders. The 'Member' refers to those individuals who are part of the team performing various roles to execute the project. Other people who carry out tasks in the project, other than the Approver and SMEs, are termed as members. Strictly speaking, even the Approver and Resource may be members, but are specifically identified with respect to their responsibilities. 'Interested' parties are those stakeholders who need to be kept informed about the progress of the project. They could be part of another function in the organization, who may be benefiting from the project, or they could be customers as well. The RACI matrix is more applicable for describing the roles in a business process, rather than a six sigma project. However, we could feel some overlap in the way the roles are defined. For example we may take a procurement process ‘Responsible’ applies to the person who has to work for getting the product/ service delivered. For instance a procurement executive is responsible to interact with the vendor, draw schedules and follow up to ensure that the part is procured at the right time. ‘Accountable’ applies to the person who will be directly answerable to the management (or to customer) for the expected task. In this example, it could be the Head of Supply Chain Management, to whom a team of buyers may be reporting. ‘Consulted’ applies to someone who has a specific knowledge or expertise related to this process and can provide assistance to the responsible person. For example, it could be a tax expert, who will provide consultation for the procurement executive when needed. The consulted person need not be responsible nor accountable for the deliverable of the process. ‘Informed’ applies to the people who need to be kept informed of the project and its progress. They could be the people who would be impacted by this process. For example, the Operations Head or Production Planning Head would be people who need to be informed about the progress and status with respect to the procurement of parts Thus ARMI and RACI are both tools that help in developing the ‘Responsibility Matrix’, whereas they are better suited for the situations of application as discussed above.
-
Every product is expected to provide a service to its customer. Even innovative products are welcomed when customers sense a value added service that is provided by such products. Value addition as perceived by customers Let’s take an example of a product such as “Pressure cooker”, whose invention would have happened more than a century ago. If we were to provide specifications for such a product, before it ever hit the market, it would have had to be referenced to a baseline; viz. time taken for cooking a certain quantity of food under a given condition. The specification would then be ‘how much time would be reduced from the baseline to perform the same cooking’. This is something which the customer will be able to experience rather than specifying something like ‘the level of pressure’ or ‘the boiling point of water during pressure cooking’ etc. Such technical specifications will however be useful internally but will make sense to customer only when the product is familiar and the concept understood and accepted. Evolving expectations Moving on with another example…. Nowadays, it is expected that a smart phone is equipped with a camera. So much so, that in most of the ads, the importance is given to the specification and features of the camera as a unique selling point, rather than the basic phone’s features! When this innovation of having a camera along with a phone was first conceived, the very fact that one can own a phone with a camera would have been an exciting feature. In such a situation, if the specification states that the phone can also be used as a camera, it would have attracted attention. However, in today’s situation, more detailed technical specifications such as the megapixels, aperture sizes, sensor quality etc. are essential to differentiate the product. Begin by specifying with customer P.O.V. Understanding customer pains, preferences and current market offerings are very important while venturing with an innovative product. The specifications from a customer point of view will have to be decided with reference to the baseline information on the service that is to be provided by the product. Such inputs once mapped on a Quality Function Deployment (QFD) template should be used for deriving the technical specifications and subsequently the process specifications Focused Customer field trials For consumer products like home appliances, it is common to adopt methods such as “Customer Use Field Trials”, where the product prototypes are provided to selected customers, mostly the trusted employees of the organization to feel and experience the features, especially the innovative ones, and obtain the feedback. By this approach, the specifications for such features can be evolved and fine-tuned. It is common in the software industry to come out with alpha versions, which are primarily restricted to employees of the company, and beta versions that are used with a wider range of select customers. Other than the innovative portion – specify competitively There are certain fundamentals that need to be complied anyway. If the product is having features that are already on existing products in market, apart from the innovative features, then the specifications for the existing features should be within the competitive limits. Similarly, if there are statutory requirements with respect to safety and other laws of the land, such requirements must have specifications within the stipulated norms.
-
Let’s discuss the definition of Rolled Throughput Yield and how it has evolved. The yield from a production process is defined as the ratio of number of acceptable units to the total number of units fed into the production process. The First Pass Yield is defined as the ratio of the number of first time acceptable units (excludes Reworked units) to the total number of units The through put yield (TPY) is the ratio of number of defects to total number of units into production. Note that for throughput yield it is the ‘defects’ per unit, which makes the measure more detailed that using ‘defectives’ When there are multiple processes involved the Rolled Throughput Yield (RTY) is a measure of the overall process yield. If there are n processes connected in series, RTY = (TPY)1 * (TPY)2 * ………. (TPY)n If there are n processes connected in parallel, RTY = Minimum value of throughput yields of all the processes. As seen above the RTY takes into account the combined effect of multiple processes, does not consider reworked units, and also uses ‘defects’ for this calculation. By all this, RTY is considered as an efficient measure for yield calculation, superior than the other measures. Can a process with 100 percent Rolled Throughput Yield be considered inefficient? RTY can be 100% only if all the processes in the production flow are performing without any defects – which means that every unit that is fed into the production system comes out converted into the desired product with no loss. Such a process system may be considered efficient with respect to the product quality output. However, this measure does not guarantee efficiencies with respect to productivity rate, turnaround time, power consumption, or cost of production. What would need to consider other metrics that measure the efficiencies around these parameters, while the process(es) may be efficient with respect to the Quality output.
-
In medical science, it is said that many times, patients respond to medications, not just because of the medicinal effect, but also due to the psychological expectation that the medicine will cure them. This behavior is known as placebo effect. This effect is considered to be due to the positive state of mind that the very belief one is undergoing treatment, induces encouragement for the body to respond positively. While new drugs are tested for effectiveness the evaluations often take into account the placebo effect to distinguish the actual effect of the drug. When we discuss Hawthorne effect, I get reminded of the placebo factor in medical field. Hawthorne effect, sometimes also known as “Observer effect” refers to change in response behavior of people, when they are conscious that they are being observed. However, as mentioned in the question, there is not only a positive effect, but also a possibility of deliberate negative effect. I can divide the type of responses, while people are being observed, into 3 categories: 1. Involuntary improvement in people performance: This could be a genuine psychological human response when the mind becomes more alert, when it senses that someone is observing. In today’s life most public places are covered by cameras, which makes people more self-conscious and more careful in their actions and behaviors. In this case, the responses are involuntary and quite comparable to the ‘placebo’ effect. 2. Deliberate effort to show improvement: Depending upon the purpose for which the observation is being done, there could be deliberate efforts to show improvement. If the observation is perceived as an exercise to identify the best performer, it could induce a competitive spirit and people would strive to do their best. Though the effect appears to be similar as in the earlier situation, in the second situation, the psychological drive is different. 3. Deliberate effort to slow down: Again, depending upon the purpose for which the observation is being done, there could be deliberate efforts to slow down. This, probably is one of the nightmares of an industrial engineer, while executing a time study to establish standard times for each jobs, for the purpose of setting norms for incentives. How should one go about neutralizing such effects while base lining a process? 1. Explore the use of Historical data: At a well-managed level, processes should have a good MIS in place, and we can readily pull out desired data and analyze it with little effort and special observation exercise can be avoided or minimized. For instance, if we are planning to work on an improvement program for productivity, the base line may be established by referring the control chart of daily productivity, from the MIS report for the past two months for that process. It will also help to identify and address outliers if any, and help us to have homogenized data. Even if specific observation exercises are undertaken, the findings may be compared with the control chart data to see any significant differences due to Hawthorne effect. 2. Introduce observation exercises as part of regular internal audits: If we have regular internal audit system in place which the workforce may already be used to, it will be a good idea to integrate the special observation activities and make it less conspicuous. This will camouflage the observation exercise and the purpose will not be very evident to the people. 3. Remote monitoring methods: This is more common in the IT industry, where specific screens can be monitored using special applications remotely. The processors being observed will be completely oblivious of such monitoring. They could be aware that such a feature exists, but will not know when and how long it would be enabled for their work stations. It is also possible to record process cycles and could be played back for detailed analysis. Taking cue from this, similar approach may be adopted for manufacturing as well using pre-installed cameras that cover the work stations. 4. Apply a correction factor: Anticipating a reasonable deviation from the normal performance, depending on the purpose of the observation exercise, apply a correction factor on the observed performance. This method, however will have subjectivity and may be adopted as a least preferred approach.
-
Coefficient of Variation (COV) is defined the ratio between standard deviation and the mean. COV helps in comparing the relative dispersion between two data sets, when the means are different. The precision for a data will differ depending upon the largeness of the mean. For instance, consider the following 2 situations: 1. We are dealing with wheels whose mean diameter is 5mm and it has a standard deviation of 0.5mm. 2. We are dealing with wheels whose mean diameter is 500mm and has a standard deviation of 2mm. Which of the above has higher dispersion? The standard deviation is higher for the second instance. However, the COV for the 1st instance is 0.5 / 5 = 0.1; whereas the COV for the 2nd instance is 2 / 500 = 0.004. From a practical significance, standard deviation of 2mm for a mean diameter of 500mm is more tolerable than standard deviation of 0.5 for a mean diameter of 5mm This illustrates that going by just the standard deviation, we could not have meaningfully compared the dispersion. The COV gives a quantified and comparable measure of dispersion. Another example: 1. I have stock whose mean value is Rs.75 with a standard deviation of Rs.6. 2. I have stock whose mean value is Rs.800 with a standard deviation of Rs.64 Which of the above carries more risk? The second stock obviously has a higher standard deviation. However, COV for 1st stock = 6 / 75 = 0.08 COV for 2nd stock = 64 / 800 = 0.08 The COVs for both the stock is equal to 0.08, and hence the risks based on dispersion for both these stocks are comparable.
-
FMEA is ideally referred to as “Potential Failure Mode Effect Analysis”. No doubt it is a very popular tool, when used the way it is intended, will give its benefits. It is important to know what to expect out of this tool. One of the common human behavior is to refrain from thinking and talking negative. There is a belief that talking and thinking positive always will motivate our mind and we will be more associated with positivity and positive results. However, in the case of FMEA exercise, a team is expected to think about ‘failure modes’ that could potentially occur – be it a Design FMEA or Process FMEA. The idea is to pre-think about such likely failures, attach a severity, based on the impact to customer or the organization, should such a failure occur, assess the probability of such an occurrence and ability of current controls to detect, in case it occurs. The exercise provides a method of quantifying the influence of all these 3 factors, Severity, Occurrence and Detection in the form of RPN (Risk Priority Number). Having done the exercise with the best set of people, we will get a priority for working on actions to mitigate the risk due to the Failure Modes. Let’s examine the limitations that the FMEA exercise 1. Effective only if team has right experience: Since it is the potential failure modes that need to be identified, it is important that the team members have good grasp about the product expectations in case of DFMEA, and of the Process details in case of PFMEA. Sometimes the best of the members may not have adequate fore-thought about the failure modes, and chances of missing out certain failure modes is a risk. We never know what we did not know! 2. Perception about severity: As part of FMEA, there are guidelines to rank the severity. However, the severity is the impact to the customer. For instance we might rank a failure mode such as color fading as one with low severity as per definition, since it would have no bearing on the functioning or safety of a consumer durable, but it could form such a poor impression for the customer and could be a major factor to lose business. Similarly a minor leak in a water heater may not get classified as a failure mode of high severity, but if the customer places the appliance over an electrical point and the minor leak can result in sparking off a fire, it could be a gross error. 3. Actions seldom bring down severity rating Most of the actions based on FMEA address the occurrence and detection. The severity of the failure if occurred, continues to remain same and is seldom addressed. 4. Occurrence estimation: Often the estimation of occurrence would be done based on the historical experience of the capability of similar processes. Many a time, there would not be adequate record for the occurrence data. There is always a risk that the occurrence for a particular failure mode can spike up due to special causes. In a mass production, even one day’s spike for a low severity failure mode can be very disastrous in terms of heavy rework, product recalls, or warranty expenses. 5. FMEA by itself will not mitigate risks FMEA exercise will identify and prioritize the risks. However other efforts are required to identity the remedial actions to overcome these risks. Otherwise it remains as an exercise without impacting a change. 6. Striking the right balance on details The FMEA exercise is driven by the extent of Design or Process details that is fed in. This will set depth of the rest of the exercise. Inadequate level of detailing can result in missing out important failure modes, and too much level of detailing can digress the exercise. It is important to strike the optimum balance on the level of detailing done. 7. Control plan derivation For many of the controls and containment items identified, the FMEA has to be followed by a good control plan. The sequence of drawing synergy from FMEA and Control plan has been well addressed in the TS 16949 QMS standard. As we know the control plans are tools that need to be administered with good amount of discipline, otherwise the findings of FMEA will not bear fruit. 8. FMEA has to be a living document Once prepared, FMEA document has to be maintained and subject to updation as and when new Failure Modes are identified. All lessons learned need to get transferred as part of the preventive actions for new products / processes. Otherwise, we will only end up repeating the same efforts. The above limitations, however do not undermine the power of this team based tool. if the exercise is facilitated by a good professional, along with steps that overcome the said limitations, it will certainly prove as an effective 'preventive' tool.
-
If we look back one and a half decades ago, we had marketing, sales and customer service activities, in an organization, each area managed by the respective functions. The term ‘Customer Relations Management’ evolved subsequently and it continued to evolve with varying dimensions and scope. While we can find various definitions for CRM, one common intent that emerges is that it is an approach to get the customers and company connected better. Considering the challenge in getting a universal definition, I would put down the below points that relate to the intent of CRM, furnished with no order or sequence in mind. 1. Provide better responsiveness and service 2. Provide single point of contact from company 3. Long term customer retention 4. Obtain feedback on customer satisfaction and loyalty 5. Examine customer behavior patterns 6. Wooing customers to buy more / additional products / services. CRM is sometimes looked upon as a function (department) in an organization. One of the most popular development that we saw during early 2000s is the growth of call centers. So much so, that the Call Centers became an outsourced activity surmounting geographical barriers. The advent of Information Technology has also transformed the outlook of CRM. Various CRM softwares have emerged. Good or bad, it is a fact that CRM has become highly depended on IT. In fact in one of the definitions, CRM is understood as a software. In most Websites, if you click the “contact us”, you can no longer expect to obtain telephone number by which you can call and talk to someone. You may see a page that will ask you several details, or present you with several options to choose from and you will end up getting answered by the machine! Even if there is a telephone number, it will lead you to an automated voice response, which will keep on guiding you to select various options depending upon what you are seeking. Getting a person to interact would be a final option, if at all it happens! While the above methods may have some advantages in terms of standardized and sometimes quicker response, it could also be very frustrating for a customer who may not get the answer to any specific problem for which a solution is being sought. The CRM practices are bound to undergo more transformation in the days to come and have already been seen as an important factor for competitiveness. With the above said, in today’s world, any organized business is not complete without a CRM in place.
-
Lead Time is defined as the time duration required to deliver from the time customer placed the order. Cycle Time is defined as the time duration starting from when the work begins on a unit of production until it is ready for delivery. “Cycle” as the term implies, refers to repeated rounds of an activity. Lead Time is very important from the customer point of view, since it determines when the order needs to be placed in order to avail the product (or service) by a specified time. The Lead Time is important for the supplier to set the expectation to customer as to when the product will be available. Cycle time is important for production planning and execution purposes, since it is the time that will have to repeat for every unit produced. Time elapsed for ‘Set-ups’, batching, storage and transportation will be part of the Lead Time. Lead Time may also apply for “Designing a product”, whereas Cycle Time comes into play during repeated production of units. In case a batch of products has to be ordered, the Lead Time will apply for the batch to be delivered, whereas the Cycle Time will apply for the production of each unit of the batch. The reason for confusion between these terms can arise if the exact ‘start’ and ‘end’ times are not specified, which is the key differentiator for these terms. Another situation is for ‘One time’ special made-to-order large Product, for a single unit where it is just the lead Time that is relevant and Cycle Time does not apply since there is no repeated production.
-
I would support option E, which is coming closest to my belief and I would slightly re-phrase it as “Workforce, if engaged in improvement initiatives can do wonders. Apart from slogans and rigid targets, a joint ownership between Management and Workforce has to be struck upon for finalizing the improvement goals for Quality and Productivity”. When we have a situation where a major automation is out of question, there is very high dependency on the workforce. Very often, there is a huge treasure of ‘tribal knowledge’ residing within an experienced workforce. Most of the solutions to problems can be understood only if we go closer to the problem. It is to be kept in mind that when we humans talk of automation, in most cases we trying to create a method to repeatedly replicate what humans have been doing. For a moment consider each human as a ‘super-robot’ designed by God. The power of this super-robot called human cannot be fathomed and is beyond anyone’s estimation. The challenge is to get this human mind to think and give its utmost, and also to ensure that this human mind and body performs consistently. To get such an output from human force, we need to ensure that an appropriate environment is created that stimulates the highest level of motivation and self-respect. I recall one of my mentors once telling me “Every human being in this world knows something that you do not know, and of course, you too know something that most other humans may not know”. This simple but powerful statement alters the way we look at fellow humans and inspires us to discover the best ways of involving the workforce in identifying and even implementing kaizens. A well administered ‘Small Group Activity’ with reasonable reward and recognition program will go a long way to identify and unearth practical hurdles and problems in the production floor by the people who are closest to it. Once most issues are unearthed, those which require support and sponsorship from the management need to be weeded out. The very fact that the management works very seriously on an issue that was unearthed by the workforce will be a gesture of respecting their views and will strengthen their co-operation. Any slogans and banners that get evolved with the involvement of the workforce will carry more value and the ownership to abide by them will be higher.
-
The “FishBone” diagram, also referred to as “Ishikawa” diagram or “Cause & Effect” Diagram is a Quality tool to be used to stratify and narrow down the potential causes for a problem (effect), based on which focused attention can be given to continue the root cause analysis. As a Quality professional, I do admit that on several occasions, this tool has not been applied the way it has been intended for. The following are some instances. 1.Drawing the Fishbone diagram, after the root-cause has been identified: By passing the systematic team based approach expected by using tools such as Fishbone diagram, the cause identification is done and the Fishbone diagram is created afterwards to be used as a presentation in the Quality story. 2. Not used in the right sequence Ideally a brainstorming has to be conducted first an all the ideas collected and compiled. Then they need to be stratified; best to use a tool like Affinity diagram before heading for fishbone diagram. There are suggested stratification headings given for problems related to Manufacturing, Service etc.; however, no hard & fast rule to stick to it, and one may customize the headings appropriately. The sequence is sometimes not followed, and drawing the fishbone diagram is resorted to right away. 3. Primary branches not used for grouping Each of the primary branch of the fishbone is expected to represent a stratified group of the causes. But sometimes instead of that, the primary branch is named using a cause itself. 4. Logical cause flow not maintained The secondary branches need to be the causes within that primary branch’s group. Then we need a tertiary branch which represents the sub-causes for the primary causes. Sometimes the sub-causes are not judiciously organized to give a logical ‘why, why’ flow. 5. Mix up of stratification and causes Sometimes the stratification points and causes are mixed up. Assuming we are working on a failure analysis for a product produced from 5 machines, if we split the failure data machine wise, it is not split up of the causes, but only stratification of the effect. Only if we try to answer a question viz. “Why did this failure happen?” we will go to the cause. For eg. “Run-out for Machine A is higher”. 6. “Effect” too broad Sometimes we make the “Effect” very broad, for eg. “Quality Target Not Met”. This will end up deriving a fishbone, with even the tertiary branches referring ‘stratification’ and not ‘causes’. 7. Cramming of sub-causes Sometimes we create too many sub-branches and the fishbone may become too crowded. If any particular primary cause starts branching out to many sub-causes, it may be prudent to create a separate Fishbone diagram for that primary cause 8. Mistaken Expectation The fishbone as explained earlier is meant to identify all potential causes to maximize the collective exhaustiveness. Subsequent efforts are required to funnel and narrow down to the root cause(s). But sometimes the fishbone is interpreted as final cause list, and leads to confusions.
-
One of the very common method used for dealing with a large data is to “stratify” the data into groups. The stratification may be done in multiple ways depending upon the situation and purpose for analyzing the data. For instance, if we are studying national sales data to understand the areas having improvement opportunities, the data may be stratified into groups for each state. Other ways of stratifying may be on age, income levels, education levels, month wise etc. The stratification groups need to be decided based on the objective that is being pursued. Such segmentation will help us to represent the data using a bar chart and helps comparing the variation between the groups. It helps in narrowing our focus on areas that depict an abnormal problem, or areas of opportunity. During root cause analysis, such segmentation is one of the first steps adopted. It also helps in evolving a Pareto diagram and apply the 80 / 20 rule. Where deeper probing and analysis are required, it is a good idea to do the segmentation first, so that the efforts for such deeper analysis may be restricted to the volumes, shortlisted based on the segmentation. Sometimes when we have a large amount of data; say for instance a product failure data for a period of six months, it would help to segment the data for certain time period, maybe month wise, and week wise. Of if we know of certain factors that we suspect to influence the failure under study, the data may be appropriately segmented to see a comparison of the failure rates between those events. A good segmentation helps in optimizing the efforts spent for root cause analysis and facilitates arriving at the root cause faster.
-
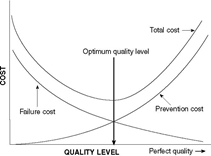
Phases of Quality Management – Associated Quality Costs Quality Management in a business operation may be broadly divided into 4 phases: 1. Preparatory 2. Operational 3. Remedial 4. Strategic Preparatory phase: The preparatory phase starts right from pre-project activities such as Quality proposition during the ‘Request for Proposal’ stage. Once the requirement gathering is in progress, Quality Function deployment, Project ramp-up related activities such as the capability assessment of the business processes to deliver Quality, Cost and Timelines, User Acceptance Evaluation, Service Level Agreements finalization and so on. The preparatory phase also includes the planning and set-ups required for operational controls, be it equipment, software, knowledge and skill development. It also calls for preparing for remedial actions, be it a rework queue or bay, equipment, resources etc. Out of the above costs, the planning activities pertaining to knowledge development, the QFD and associated investments on capable equipment, mistake proofing, prototyping, initial testing and proving may be categorized as preventive costs. The money invested for equipment, facilities for process quality checks, may be debatable as preventive of appraisal costs, but they are investments. Operational phase: During the live production / operations, there will be activities for process controls, where good SIPOC will point out the Key Process Input Variables (KPIV) that need to be controlled to get the desired Key Process Output Variables (KPOV). Any costs that go into setting up and ensuring ongoing controls will not only prevent the need for reworks, but reduce dependency on too much in-process and final inspections. Such costs will come under the “Prevention cost” category. However, despite having the best focus on Preventive measures during the Preparatory and Operational phase, some extent of appraisal is usually unavoidable. Any inspection and rework that is done on any process output, be it interim or final will have its cost under the “Appraisal cost” head. Remedial phase: Remedial implies that a failure has occurred and corrections and corrective actions are warranted. Obviously the associated costs will fall under “Failure Costs”. Where it is an external failure, there is risk of impacting credibility with customers. It is important to have an efficient remedial system in place, since customers sometimes even tolerate about some extent of failures, provided the organization is able to swiftly react and set the problem right. A good attention and resolution of a reported problem, sometime strengthens customer confidence. Hence the investments and the timely and right remedial actions are very important for which there is bound to be a cost associated. Strategic phase: Strategic initiatives could be innovative for bringing continual improvements to the process, product and service. Sometimes they could be triggered based on the learning from failures and process issues. In any case, the cost incurred for strategic initiatives would fall predominantly fall in the “Prevention cost” category. Having discussed the key dimensions in a Quality framework, we will try to address the question on ‘what would be the best balance between the Preventive, Appraisal and Failure costs’ Many a time, we may not be able to identify all the ideal preventive steps that need to be taken up upfront. Even the best preventive plans are based on experiences and there is always a possibility of unprecedented factors. The process capability of processes, including the human variations may continue to influence output Quality and makes it necessary to have adequate in-process and final checks and rework as required. Customers would be willing to pay a premium to avail reliable products and services. For many products, companies give a warranty period with conditions attached. This is primarily to woo customers to buy the product with a free service assured, in case of infant moralities. Sometimes extended warranties are offered to customers at a cost. In such cases the preventing costing needs to be such that the warranty failures are maintained to the minimum. The business advantage from such schemes is that, not only does it promote the product, but also the fact that no customer is going to be unhappy that a failure did not occur! Just like no one is going to be unhappy that a health insurance amount wasn’t utilized! Increasing preventive and appraisal costs beyond a certain point may not result in increased reduction of the Failure costs. There is a need to strike an equilibrium. It is important to identify the optimal cost balance to keep the total costs, i.e. the sum of Prevention, Appraisal and Failure costs at the minimum. This discussion will not be complete with out reference to the above model, which has been depicted by Juran, advocating that there is a Quality level that incurs the optimum total cost of Quality. This probably is one of the first model of its kind. This could be debatable, since the quality expectations do change over time and many other models have come up since then. It is also important to be abreast of competitive offerings. If someone else is able to offer a competitive price with much lower failures, it is important to revisit the entire process, technology and other factors that could be making it possible. However, this is a continuous exercise. The failure analysis needs to be done continuously and pursuit to identify and implement preventive steps is an ongoing exercise. Accordingly the cost balancing also has to be dynamic and sensitive to both VOC and VOB.
-
Type I error is rejecting a Null Hypothesis that is a true (should have been accepted). Type 2 error is accepting a Null Hypothesis that is false (should have been rejected) Let us discuss this question with an example. Machine A and Machine B are producing certain part, and the weight of the part is a characteristic of interest. The weights of samples taken from these machines are as follows: A – 10.8, 10.3. 10.7, 10.9, 10.4, 10.7, 11.0, 10.3, 10.8, 10.7. B – 11.2, 11.3, 11.1, 11.6, 11.0, 11.6, 10.8, 11.4, 11.4, 11.6. Mean weight for Machine A = 10.6 Mean weight for Machine B = 11.3 Situation - 1 Assume that in reality there is a significant weight difference on the output from Machine A and B. But we are trying to prove using a Hypothesis test. Hypothesis statements: H0 : Mean weight from Machine A = Mean weight from Machine B H1 : Mean weight from Machine A Mean weight from Machine B The true conclusion would have been to reject the Null Hypothesis, in this situation. However, as a result of the test, if H0 gets retained, it is an incorrect acceptance of null hypothesis and is a Type-2 error Situation - 2 Now let’s examine another situation. Here we want to test the effectiveness of an improvement action taken, which is expected to bring down the differences on the weight of their outputs. Our aim is to improve the process to reduce the difference. Assume that the difference between the machines continues to exist. The Hypothesis statements may be as follows: H0 : (Mean weight from M/c B ) – (Mean weight from M/c A) = 0.7 H1 : (Mean weight from M/c B ) – (Mean weight of M/c A) ≤ 0.7 The true conclusion would be to accept the null hypothesis, in this situation and accept the difference is equal to 0.7 However, conducting the Hypothesis test, if H0 gets incorrectly rejected, it means that the means are having difference which is less than 0.7. This amounts to Type-1 error. Thus, the null hypothesis in the situation in situation-2 is the alternate hypothesis in situation-1
-
The 8D problem solving approach, apart from its 8 disciplines was modified with a starting discipline, D0, as ‘Plan’. A tabulated comparison between 8D disciplines and the DMAIC approach are as below: While the above table has attempted to compare these approaches, we may summarize as below: 8D problem solving techniques are a structured approach to problem solving developed by Ford Motor Company in the 1980s. 8D methodology gives the impression that a problem, predominantly chronic, exists in the organization, with a risk of the problem being passed on to customer. The above point explains the focus by the D3, which calls for developing an interim containment plan and D4, which calls for identifying and verifying ‘escape points’. The Six Sigma DMAIC is a relatively new expression that has become popular in 1990s. In principle, DMAIC takes on from the PDCA thought process, but driven as a rigorous, result oriented methodology. We can point out several similarities between 8D and DMAIC…... while 8D is associated more with solving existing problems that may already be adversely impacting customer, DMAIC is more associated with not just problems, but also opportunities for improving the process profoundly. 8D includes a containment action, which is not prominent in DMAIC.. It doesn’t mean that containment is not relevant when a problem is being resolved through DMAIC, but it does not figure in the DMAIC phases, since DMAIC focuses more strategically on a permanent process improvement. The regular Quality management System is expected to address the actions such as Containment and Escape points. Apart from ‘problem solving’, DMAIC would also address improvement opportunities which may not be pain point for the customer. (hence no containment for such cases). However, these opportunities may focus on improving the internal efficiency of the organization’s operations. DMAIC is more powerful on the “Measure Phase”, where it expects “baseline” sigma measurements, study of process variability, and establishes a measurement method that is maintained throughout the project. While the metrics need to be addressed in the 8D approach as well, it is not expressed so powerfully. 8D has included a discipline “Congratulate the team”, which is not explicit in DMAIC. However, DMAIC is an approach that is part of the tactical component of Six Sigma, a larger company wide program, which has Strategic, Tactical and Cultural components. Well defined reward programs are part of the overall program. To conclude, use 8D as a regular team based, problem solving approach at floor level. While doing so, we would come across certain problems that would require a higer level thinking and intense change at a process or design level. These may be taken up as a Six Sigma project using DMAIC approach. DMAIC shall also be used for other improvement opportunity, which are identified as part of the Strategic Business Objectives.

-
The control limits for Control charts are derived based on its own data, applying the statistical principles applicable for the distribution under which the data falls into. ‘c’ charts and ‘u’ charts are used for ‘count’ data, such as number of defects in as part / sample. The choice of ‘c’ or ‘u’ are made based on fixed or varying sample sizes. It goes without saying that, when these charts are used for monitoring count of defects, anyone will only want the defect count to be as low as possible. Hence the UCL for defect makes sense, but the question is “why do we require a lower control limit for defect count?” LCL - little significance: Some times when the limits are worked out, the lower control limit might assume a negative value; in such cases, the calculated LCL, being negative has no meaning and the LCL is taken as zero. Obviously, no point is going to fall below zero, and hence the LCL is of little significance here, except when the count is zero. However, if we are using the ‘run’ patterns for our study of stability as per its rules, then the 1sigma and 2sigma limits are also used, apart from the LCL. LCL - Could unearth important finding: Where we do have a positive LCL, and if some data points fall outside, it indicates a situation that may be “too good to be true”. It will be worthwhile to investigate the special cause(s) that could have resulted in this occurrence. 1. It could be measurement a error. For eg. a wrong gauge could have been used and it was failing to detect defects. 2. It could be a change of an inspector that added subjectivity in the defect identification, especially if the defect was to be visually identified. 3. Or it could be some genuinely favorable condition that brought down the defect count. These could be opportunities of unearthing some favorable factor that we have been missing or ignoring. One example from my experience is when we were using ‘u’ chart for plotting the count of character errors in captured data, processed from multiple sites. Few consecutive days we observed the count falling below the LCL. Upon investigation, we realized that one particular processing site was down during those days. Further probe revealed that this particular site was performing with an operating application, whose version was obsolete. Once the correct version was installed, we were able to sustain a reduced mean error count and the control limits could be narrowed. LCL - More important (than UCL?) 4. It is not necessary that c and u charts should always represent defects, which are always “lower the better”. For eg. a consumer goods company selling a popular brand of shaving cream, wants to do a study to see the number of individuals out of sample who use their product. They pick a sample of individuals in a city every day and find out how many of them are using their brand. In this case, since the sample varies every day and it is a count data, ‘u’ chart applies. However, this is a case where "higher the count, the better". Hence the LCL and the count falling below LCL is of utmost importance.
-
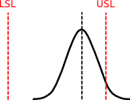
Overview of Process Capability and Sigma levels From good old days, we have been using the term process capability denoted using Cp and Cpk. The Cp is the process potential when the process is subjected to only chance cause variations, with the assumption that the process mean is perfectly centered. When the process is well centered, and if the distribution spread with 3 times standard deviations from mean on both sides falls exactly with in the tolerance, then the Cp is equal to 1. When this spread (+/- 3 std deviations from mean) falls within half of the tolerance the Cp is equal to 2. These scenarios are depicted below. For the case where the Cp = 2, it is a process whose “sigma value” is equal to 6. It means the spread represented by 6 std devns on both sides of the mean will fall exactly with in the tolerance limits. If we statistically work out the defect rate for such a process, it will be 2 per billion. However, in reality the mean could shift due to special causes. That is why the process capability index Cpk was evolved, which also takes into account the mean shift, during the time the Cpk is calculated. It is calculated as the distance between the mean and the closer tolerance divided by 3 std deviations. Thus Cpk becomes a more stringent measure of process capability and considers not only the inherent variation of the process, but also how well the mean is centered. Concept of Long Term Sigma Reality does not stop here. Though the mean shift has been considered while calculating Cpk, the questions arise: 1. “Will the mean shift remain constant over a period of time?” 2. “How much change of mean shift will occur over time?” Motorola has determined, through years of process and data collection, that processes vary and drift over time – what they call the Long-Term Dynamic Mean Variation. This variation typically falls between 1.4sigma and 1.6sigma. Thus, 1.5sigma mean shift is taken as a standard which is also to be considered as a variability that has to be taken into account in the long term. So, even if a process operates at 6sigma level, when influenced by only chance causes, the mean shifts that are bound to happen in the long term can practically influence the sigma level. Taking 1.5sigma mean shift as standard, the sigma level of a process, would drop from 6sigma in short term to 4.5sigma in long term. The defect rate associated with 4.5sigma is 3.4 parts per million. Why do we sometimes need to derive one type of sigma level from the another by using 1.5 sigma shift? At any point of time if we do a sigma level assessment on a process, it will be short term sigma only. However, when we certify a process we have to give an assurance that the process will maintain its capability in the long term. Thus, the derivation of long term capability (sigma level) is extremely important, considering the mean shift that would take place over time. This is done by using the 1.5sigma shift principle as explained. By ensuring the short term capability i.e. process potential as 6sigma, we are assuring that in the long term the process will deliver at 4.5 sigma level. On the other hand, if we have a long term data from a process, we can work out its sigma level and using the 1.5sigma shift principle, estimate its inherent short term capability. Otherwise, carrying out a specific short term trial to understand the short term capability could cost us additional effort and cost.