Swarandeep Kaur Juneja
Lean Six Sigma Black Belt
-
Joined
-
Last visited
Everything posted by Swarandeep Kaur Juneja
-
Swarandeep Kaur Juneja replied to Vishwadeep Khatri's topic in We ask and you answer! The best answer wins!Example - Think of a situation in Human Resource Management domain where AI model is built to analyze and reduce employee turnover. In the absence of a MBB, automation/transformation team defines the problem as “predict which employees are likely to leave”. The model accurately predicted attrition rate basis the available data but failed to point out the root cause of the problem and reduce attrition. Only later by involving a Master Black Belt and post thorough root cause analysis it was tabled that the primary cause of attrition was lack of career growth opportunities within the organization which led to high attrition. The primary root cause was not a part of the HR data that the AI model was built on, hence incorrect problem statement will not result in the desired output. MBBs contribution to problem definition stage – 1. MBBs will ensure that the project goal aligns with the Business Case 2. CTQ drill down – Business Case will then be linked to operational objective and post baselining the current performance RCA will be conducted 3. RCA – Using techniques such as 5-WHY, Fishbone analysis , Affinity etc. root cause of the problem can be arrived at 4. Hypothesis Testing – Testing the hypothesis to identify the true trend before full scale deployment of the model is as imperative as the pre-work like clear problem definition Conclusion – To ensure successful deployment of AI model which gives desirable and effective output the pre-work done involving clearly defining the problem statement, it’s link to the strategic and operational objective, CTQ drill down, RCA etc. is imperative for MBBs to ensure the project is directed in the right direction.
-
Swarandeep Kaur Juneja replied to Vishwadeep Khatri's topic in We ask and you answer! The best answer wins!The first and foremost traditional metric that maybe misleading in an AI enabled system is Efficiency (Process Cycle Time). Traditionally the way human performance was judged basis faster generation of output can not be used as-is to gauge the performance of an AI enabled system. This is because fast AI decisions can be inaccurate, hiding issues like poor model performance. Example - In HRO domain AI enabled systems might reduce time to hire but may overlook certain key organizational initiatives like diversity and inclusion and may source candidates faster but may result in poor job fit due to lack of analysis. Also Cost per hire can be an outdated metrics because AI enabled systems are reducing CPH in the short term but may fail to track Employee Churn Rate due to multiple factors initially ignored. New Metrics - Instead of these metrics we may prefer to use Candidate Fit Accuracy - Percentage of AI selected hires meeting the success criteria (performance, retention etc.) over a longer period of time. Whenever building a system, developers need to focus on striking the right balance between TAT and Accuracy and enable the model to achieve both.
-
Swarandeep Kaur Juneja replied to Vishwadeep Khatri's topic in We ask and you answer! The best answer wins!Master Black Belts are the experts to analyze the root cause of the problems faced by a process and can very well fetch the best suited solutions that will address the root cause of the problem directly. This will ensure that AI initiatives are targeting the areas which will result in maximum benefits. Example – Master Black Belt will start by drawing a Value Stream Map of the process to identify bottlenecks in the process. Bottleneck Severity Index = (Volume*Cycle Time) * (1-FTR%). This will help us prioritize the sub-process which requires AI solution to give accurate and faster output. Post this Current Reality Tree could be used to highlight the root cause of the problem, this will ensure the AI solution targets to resolve the issues highlighted. Solutions designed in this fashion will assist the AI team to take a targeted approach so that we are able to deliver maximum value to the client by doing the best operationally.
-
Swarandeep Kaur Juneja replied to Vishwadeep Khatri's topic in We ask and you answer! The best answer wins!HR Helpdesk is a process which we initially tried to optimize using Lean and Six Sigma methodologies. Problem faced was C-SAT survey which resulted in a score as less as 40%, where the root cause was multiple knowledge base articles referred to, to provide a solution which was extensively tedious for Helpdesk associates to browse through during the call. To simplify the process a team of 72 associates was split into 4 separate teams (Cellular Based System) – a) Payroll b) Relocation c) Deceased Affairs and d) Expense Reimbursements. This solution helped associates to focus on KB articles pertaining to the query type which they are assigned to resolve. This assisted in resolving the root cause but due to increasing volumes, management was forced to add resources which resulted in increased cost, impacting margins. With the help of AI this process can be completely reimagined. Using LLM, linked with the KB articles, AI can help provide answers within seconds and only the escalated cases would require human intervention. This solution would assist to browse through extensive KB articles in seconds which will result in good C-SAT survey. To ensure AI is providing the accurate solutions we need to ensure that the KB articles are updated and periodically audited.
-
Swarandeep Kaur Juneja replied to Vishwadeep Khatri's topic in We ask and you answer! The best answer wins!In order to pick the best suited solution to fix a problem, generate ideas targeting the root cause of the problem which is identified at the analyze phase. Start by developing potential solutions for the validated root causes by using techniques such as: a) Round Robin Style of Brainstorming b) Critical Thinking via Six Thinking Hats Evaluate solutions using: a) Pugh Matrix b) Delphi Technique c) Multi Voting d) Nominal Group Technique or/and FMEA. These tools will help prioritize one solution over the other considering multiple criteria such as cost and potential benefits. For e.g. Pugh Matrix may be used to draw comparison between two alternative solutions in a software company tackling slow bug fixes, if they should add more coders or enhance their testing tools. Both the solutions can be scored using multiple criteria such as a) Cost b) Data Privacy c) Accessibility d) Training Requirements e) Time to deploy etc. Changes can be first tested using DOE (Design of Experiments to evaluate process inputs generating desired output. Post which the selected solution can be implemented (pilot run) in a smaller sub-section of the process before full scale implementation.
-
Swarandeep Kaur Juneja replied to Vishwadeep Khatri's topic in We ask and you answer! The best answer wins!Organizations can drive business excellence by actively seeking and acting on employee feedback. This approach enables companies to: - Understand employee experiences and perceptions - Identify opportunities for improvement and growth - Foster a culture of engagement and continuous improvement - Make informed decisions that drive business outcomes Common Challenges in Gathering Employee Insights Several obstacles can hinder the effective gathering of employee insights, including: - Employee skepticism: Employees may be reluctant to provide feedback if they doubt its impact or fear repercussions. - Survey overload: Excessive surveying can lead to decreased participation and lower quality feedback. - Data interpretation: Effectively analyzing and interpreting feedback data can be a challenge. - Follow-through: Failing to act on employee feedback can erode trust and engagement. Strategies for Success To overcome these challenges, organizations can: - Guarantee confidentiality: Ensure employees feel comfortable sharing their honest opinions. - Use targeted surveys: Conduct regular, focused surveys to gather feedback and minimize survey fatigue. - Leverage analytics tools: Utilize technology to streamline data collection, analysis, and reporting. - Communicate outcomes: Share changes and actions taken in response to employee feedback to demonstrate a commitment to improvement. A Practical Example A manufacturing company used employee feedback to identify inefficiencies in their production process. Employees highlighted the need for automation to reduce manual data entry errors. In response, the company implemented an automated system, resulting in improved productivity and data accuracy. This initiative not only enhanced business outcomes but also boosted employee morale and engagement. By prioritizing employee feedback and addressing common challenges, organizations can drive business excellence and achieve their goals.
-
Swarandeep Kaur Juneja replied to Vishwadeep Khatri's topic in We ask and you answer! The best answer wins!Key Risk Indicators (KRIs) are highly effective tools for managing processes by highlighting potential risks a process might face and by deploying proactive measures we may avoid serious impact on business. E.g. In HRO, KRIs focus on areas such as vendor performance, data security, and regulatory compliance. For instance, a KRI like the frequency of contract breaches by the outsourcing vendor can alert organizations to potential disruptions in service delivery, such as delays in payroll or benefits administration. By tracking this metric, proactive measures—such as enhanced vendor oversight or contingency planning—can be implemented to ensure process stability. Thus, KRIs serve as a critical mechanism for managing risks and maintaining the integrity of outsourced HR processes. Companies often prioritize Key Performance Indicators (KPIs) over KRIs in because KPIs provide a direct measure of the outsourcing arrangement’s success against tangible business goals. In contrast, KRIs focus on potential risks rather than current performance. e.g. the accuracy of payroll process. A KRI such as the number of unresolved employee complaints might indicate a future risk to employee satisfaction but doesn’t directly measure the outsourcing outcome today. Limitations of Using KRIs Difficulty in Identification Selecting effective KRIs is challenging, as it requires a deep understanding of the process and its risks. A poorly chosen KRI may fail to predict issues accurately, leading to wasted resources. Implementing KRIs demands significant data collection and analysis, often spanning both the organization and vendor. This can strain resources, particularly for smaller firms lacking advanced analytics capabilities. Interpretation Challenges KRIs often require contextual analysis to be actionable. For example, a spike in employee queries to the vendor could stem from a process flaw or a seasonal event (e.g., benefits enrollment), making it hard to act without additional context. Risk of Overemphasis Over-focusing on KRIs can create a risk-averse culture, where avoiding risks overshadows opportunities for innovation or growth. For instance, a company might avoid entering a new market due to high perceived risks flagged by KRIs, potentially missing out on profitable ventures. Benefits of Using KRIs Early Warning of Risks KRIs act as leading indicators, alerting organizations to potential issues before they escalate. This allows for proactive risk management. For example, in finance, a KRI such as increasing portfolio volatility might prompt portfolio rebalancing to mitigate risk, preventing significant losses. Regulatory Compliance In regulated industries, KRIs help demonstrate that risks are being monitored and managed, ensuring compliance with legal or safety standards. In healthcare, tracking a KRI like the rate of hospital-acquired infections ensures adherence to patient safety regulations and drives improvements in care practices. Proactive Risk Management By focusing on potential risks, KRIs enable organizations to address vulnerabilities preemptively. For instance, in IT, a KRI like the number of security incidents can trigger a review of protocols, reducing the likelihood of breaches. Conclusion: A balanced HRO strategy leveraging both KPIs and KRIs optimizes both current success and future stability.
-
Swarandeep Kaur Juneja replied to Vishwadeep Khatri's topic in We ask and you answer! The best answer wins!A scenario in HR domain where hallucination could lead to confusion, loss of trust, or even serious consequences is when a chatbot is set-up to share details and answer questions regarding company’s policies. E.g. An employee asks the chatbot about Sandwich leave policy and the bot responds with a detailed explanation of the policy, however the response is entirely fabricated and not based on the actual company policy. This might lead to a lot of confusion due to information provided by the chatbot, employees might lose trust in the HR department to provide accurate information and in extreme circumstances if an employee takes leaves or makes decisions based on incorrect information, this might impact their job security or career advancement. Controls – System Design – Ensure that LLM is trained on accurate and up-to-date data, and implement validation mechanisms to verify the accuracy of responses. Include source of information in AI responses to build trust amongst employees on the authenticity of the data. HITL (Human in the Loop) – All AI generated responses must by reviewed by HR professionals. Continuous Monitoring and Improvement – Regularly monitor the performance of the AI model and update it as needed to prevent hallucinations and improve accuracy.
-
Swarandeep Kaur Juneja replied to Vishwadeep Khatri's topic in We ask and you answer! The best answer wins!In the Human Resources Outsourcing domain (HRO) if for e.g. an AI agent is deployed in the sourcing process to screen candidate profiles and select the best fit, there is a conflicting objective between candidate quality and time to hire. AI agent must identify the best fit for a particular job role and spend minimum amount of time in filtering the profiles. In order to balance these two conflicting objectives, the following methodology can be used – 1. Start by defining clear metrics such as skills, qualifications, experience, geography, time to hire and time spent in each phase of the hiring process. 2. Collect historic data and trends to train the agent. 3. Use Multi Objective Optimization (MOO) techniques such as Pareto Optimality which will find an optimal solution that will improve one objective without worsening another. In order to do so algorithms such as NSGA – II works the best where from the population of solutions each solution is evaluated and ranked based on their Pareto dominance and the best solution is selected. To deploy MOO techniques successfully one must ensure high quality data is collected and used for optimization. Clearly define the objectives and select the best suited MOO algorithm.
-
Swarandeep Kaur Juneja replied to Vishwadeep Khatri's topic in We ask and you answer! The best answer wins!There are certain things that AI excels at like logical reasoning, for e.g. shortlisting candidate profiles based on qualifications, invoice processing, monitoring inventory, IT helpdesk chatbots etc. On the contrary there are certain subjective questions where AI struggles and is prone to decision making mistakes just like human beings, which is also known as the “Linda problem”, for e.g. decision making on HR policies pertaining to employee's behavior, issuing warning letters to employees or even termination letters in worst case scenarios. There is a stark distinction between traditional automation tools and AI, as AI is not dependent on fixed rule-based decision making, rather it learns from previous patterns and relationships to determine the best approach to address a given situation. A detailed example of area best suited for AI deployment in corporates is pertaining to IT helpdesk. Say for e.g. as per company policy all queries should be answered/resolved within 24hrs. AI can be extremely useful to categorize the queries correctly, route it to the appropriate team and even provide resolution to tier one queries without any human intervention. As AI is dependent on previous patterns to fetch the best answer, if previous patterns include bias, that bias will be carried forward by the AI in selecting the best approach. Therefore, subjective decision making like termination or issuing warning letter to an employee based on certain kind of employee behavior cannot be completely left up to AI. For e.g. There is a corporate rule pertaining to usage of social media sites in office. If an employee is found accessing social media site, AI cannot be fully trusted to pass a judgement in this scenario as there might be a lot of other factors to be considered before a warning letter can be issued.
-
Swarandeep Kaur Juneja replied to Vishwadeep Khatri's topic in We ask and you answer! The best answer wins!An 'escape point' is a point in the process where the problem or defect could have been detected but was not. As one can deduce from the definition, escape point is vital as it gives us an idea that there was a lapse in the system as the defect escaped unnoticed. https://everythingwhat.com/what-is-an-8d-escape-point Uses of Escape Point in a DMAIC project – 1. During analysis phase of a DMAIC project we tend to focus only on the root cause of the problem, whereas it is essential to find out escape points where problem could have been detected and stopped but due to system failure that didn’t happen. 2. This means along with fixing the root cause of the problem we also need to set up a robust system with strong escape points which would make problem easily identifiable before it becomes a grave issue. Let’s understand this better with the help of an example – Example – In a content writing assignment the final article had a lot of spelling mistakes. Possible Root Causes – 1. Lack of training and skills 2. Selection criteria of content writers wasn’t robust etc. Escape Points – 1. The best escape point here would be auto-spell check. Questions to ask and understand are – Why in spite of having auto-spell check the final article was full of spelling mistakes? 2. System failure could be because of the following reasons – - Auto-spell check not enabled - The user chose to ignore highlighted errors etc. The above mentioned escape point analysis along with root-cause analysis would not only fix the problem but would also enable deployment of a robust system which makes defects easily identifiable and assist in avoiding future errors. Conclusion – Root Cause of the problem and failure of escape points working adequately both require attention and appropriate corrective actions to prevent incidents of similar kind in the future.
-
Swarandeep Kaur Juneja replied to Vishwadeep Khatri's topic in We ask and you answer! The best answer wins!We first start by defining project scope at Define phase and ideally it should be fixed there because then we move on to Measure phase and start collecting as-is process info based on the scope defined, followed by root cause analysis of the problem which is again based on the defined scope. While this is the expectation one must also remember that, ideal scenarios won’t hold true for most of the projects as during Measure and Analyze phase some unprecedented scenarios might show up which would demand change in scope of the project to achieve its final goal. Let’s understand this better through examples – Case Study – A project started in ABC Company to reduce annual rate of attrition. Project Scope considered only Accounts department and Voluntary (Resignations) + Involuntary (Terminations) attritions. Change in scope at Measure Phase – At Measure phase while collecting as-is process info project members discovered that involuntary attrition is insignificant as only 2 employees out of 500 in the whole year were terminated. Hence to focus Analysis on voluntary attritions only, scope was redefined and involuntary attritions were excluded. Change in scope at Analyze Phase – At Analyze phase during Affinity it was discovered that Back-Outs (Candidates accept the offer letter but never join), is a major concern and a question was raised whether to add back-outs to attrition percentage which would reveal actual magnitude of the problem. Data on back-outs was then collected from HR division and the count was added to attrition percentage. At this point it was mandatory to edit the scope as well and back-outs were added to the scope. Conclusion – These examples clearly signify that change under exceptional situations can take place at Measure phase or Analyze phase. It is important to note here that scope shouldn't be changed after Analyze phase and if changed during Measure or Analyze phase, this change shouldn't happen multiple times, or else project would be stuck in an endless loop and wouldn’t be able to reach its final objective.
-
Swarandeep Kaur Juneja replied to Vishwadeep Khatri's topic in We ask and you answer! The best answer wins!Jishu Hozen is one of the eight pillars under Total Productive Maintenance. Traditionally each employee was expected to do their part of the job assigned to them and in case anything goes wrong with the machinery, maintenance team would be called to address those issues. This methodology had a lot of shortcomings such as delays, bottlenecks in the work flow, high maintenance cost etc. In order to avoid such circumstances, regular operators were cross-skilled to look after daily maintenance of the machinery, e.g. cleaning, lubrication, tightening etc. This is known as Jishu Hozen. Jishu Hozen is a Japanese term which means “autonomation (automation with human intervention)”. Steps to be followed for successful implementation of Jishu Hozen – 1. Upskilling Operators - There are two types of machine deterioration – Natural and Forced. By upskilling employees to manage daily maintenance of machinery forced deterioration is eliminated to some extent and natural deterioration is delayed. 2. Standard Process – Standard maintenance process should be defined to manage and maintain daily machine maintenance. Defining each step in detail along with clear roles and responsibilities. 3. General Inspection – Regular inspection in order to identify deterioration of machinery and keep machines/equipment working at their optimal performance. This prevents unprecedented machine failure. 4. Root Cause Analysis and Corrective Actions – In order to prevent quality defects and improve profitability timely analysis of defects/defectives, incidents etc. is mandatory to find out the root cause of the problem and implement corrective actions accordingly. 5. Standardization and Self-Management – Post identification of root causes and implementing corrective actions, standardize the best practices to avoid future incidents. Learn from all the past practices to self-manage machine maintenance and include all such findings in the knowledge repository. Jishu Hozen in service industry – It would be quite intriguing to see Jishu Hozen’s application in service industry. In service industries quality department is generally responsible to identify root cause of the problem and implement corrective actions. Implementing Jishu Hozen here would mean making employees skilled enough to identify hiccups in their own processes, learn from their past experience or best practices across and immediately restore their process by taking the right actions. Knowledge repository would come in handy in such a scenario where FAQs are maintained and answered. This would in turn enhance quality of deliveries, reduce cost and enhance employee’s confidence in managing their own day to day processes. This methodology would also help in reducing time spent on Essential Non Value Add activities such as Reviews.
-
Swarandeep Kaur Juneja replied to Vishwadeep Khatri's topic in We ask and you answer! The best answer wins!SQDC boards are used to manage daily performance of a process based on four criteria, Safety, Quality Deliver and Cost. Set daily metrics based on these four criteria and present them on a board available for all the supervisors to look at during Gemba walks - 1. S (Safety) - Safety would measure whether the safety measures or metrics were achieved each day and marked on the board. Safety metrics might include: (https://www.leansixsigmadefinition.com/glossary/sqdc-2/) · No near misses · No safety violations · No missed work due to injuries · No unsafe work practices observed 2. Q (Quality) – Quality would measure certain quality metrics achieved each day and marked on the board. Quality metrics might include: · Daily error count · DPMO · Peculiar variations observed through SPC 3. D (Delivery) – Delivery would measure certain delivery metrics achieved each day and marked on the board. Delivery metrics might include: · Daily TAT · Count of deliveries that missed deadline · Rework · Downtime 4. C (Cost) or (Customer) – C could either mean Cost or Customer. Let’s take a look at some Customer related metrics: · Count of Customer Complaints · Count of rejected items etc. This is how a typical SQDC board looks like – Some additional KPIs can be added to the chart as well, the most common addition is Morale. Morale is one area which is often ignored while calculating Productivity and Efficiency numbers. Whereas if one gauges Morale of employees on a daily basis it might result in some unexpected efficiency gains. All the metrics have to be set mindfully as these are to be gauged on a daily basis and color coding can be used making it easier to identify the performance of each KPI. These boards are typically prepared for 31/30 days and then re-written.
.jpg.fca6d0856c089b18b7c5e11ba07eb627.jpg)
-
Swarandeep Kaur Juneja replied to Vishwadeep Khatri's topic in We ask and you answer! The best answer wins!Bowling Chart Definition – These are visual charts used to display all the KPIs and the actual vs target numbers against these KPIs. The term “Bowling Chart” is derived from the chart’s similarity to the appearance of a bowling scorecard, although there’s often 12 months in this type of Bowling Chart instead of ten frames when we’re bowling. (https://blog.kainexus.com/customer/continuous-improvement-software/features/improvement-charts-and-data/bowling-charts/big-lebowski) Let’s understand this better by visually comparing a Bowling Score sheet against a Bowling Chart – Bowling Charts also clearly displays how close or far away one is from achieving the target by color coding the actual numbers in green, yellow and red. Green signifies that KPIs are met for that time period, Red signifies that performance is worse than the target in that time period and Yellow signifies that one is very close to achieving the target. Advantages of using a Bowler Chart – 1. The board is designed in such a manner that everything is self-explanatory. A signal glance at the board can help supervisors understand Team’s Performance based on each of the mentioned KPIs. 2. This helps identify improvement areas speedier and helps focus corrective actions in the right direction. 3. Bowling Charts helps to a great extent to bring in transparency at the work place as all key KPIs are displayed and the performances are rewarded based on these metrics rather than various other biases. This promotes healthy competitive environment in the organization. Limitations of using a Bowler Chart – 1. There are no trends present in Bowling Charts which indicate how well or worse is the performance compared to previous periods. This prevents from giving a holistic view on performance and underlying root causes can be missed if trends are not studied properly. 2. Therefore along with Bowler Chart some additional information would have to be added before reaching a final conclusion. Policy Deployment A lot of companies struggle when it comes to Policy Deployment and its Daily Management as a lot of stakeholders are involved and collecting information from everyone in a timely manner and collating it becomes an expansive task to be performed. In this case Visual Tools such as Bowler Charts assist a lot as all the KPIs are displayed with clear description about the actual vs target numbers, this avoids a lot of ambiguity and helps track progress better.


-
Swarandeep Kaur Juneja replied to Vishwadeep Khatri's topic in We ask and you answer! The best answer wins!Often times I have heard people saying only repetitive, monotonous tasks can be standardized or only “factory model” can be standardized as that is transactional but “knowledge processing” tasks cannot be standardized especially when it comes to managing the tasks of Team Leaders and Managers. Lean Standard Work can be used conceptually to avoid being completely dependent on Managers/Team Leaders to build the culture within their teams, their own way, without any pre-defined standard tasks to be performed. Standardized work is applicable to a greater or lesser degree, across all organizational levels. We need to decide how much of leader’s work can be standardized. As the name suggests Leader Standard Work is about standardizing some of the tasks performed by leaders and not only that but also bringing in a great shift in mindset that it’s only possible to standardize work at the executive level. In order to develop common culture across the floor it is important that leaders are driven by common set of values. This means that even culture, behavior and mindset could be standardized to some extent. Included in standard work for leaders (managers and team leaders) is up- and downwards accountability that is evaluated on a daily basis or several times a day using visual controls. Daily evaluation is critical, because it not only verifies that work is being done properly, but ensures that everybody is held accountable for working to the standard. Most of the leader’s standard work is focused on activities at the place where work is done (gemba) with the remaining time spent supporting incremental improvements. (https://traccsolution.com/blog/leader-standard-work/) How can this help build continuous improvement culture? As it is often said that “What gets measured gets managed or what gets measured gets done”. Based on this concept in order to identify opportunities for improvement it is crucial to measure the current performance and in order to measure it, it is also important to draw out a list of standard practices to be followed by the leaders across the organization. This would in turn help build a continuous improvement culture where there are no biases when it comes to measuring the performance of individuals at each level in the organization. Advantages of Lean Standard Work - 1. As they say right examples are set at the top of the organization and from there culture seeps down to lower levels. If standard set of expectations are set from the leaders and their tasks are evaluated, this would create a culture of “fact based approach” in the organization which would in turn eliminate people dependency. 2. For continuous improvement it is important to have quantitative data and such practices ensures that. 3. This also helps in eliminating the concept of each team or each department having it’s own culture. It is important that the organization is run on some common set of values.
-
Swarandeep Kaur Juneja replied to Vishwadeep Khatri's topic in We ask and you answer! The best answer wins!SWOT stands for – Strengths – Identify current strengths of your Business and reflect on how the current question/problem/decision to be taken, would help in building on those strengths and enhancing your competitive advantage. Weaknesses – It is extremely important to be realistic about the current weaknesses in your business so that during the implementation of a new idea/business decision etc. one can deal with them adequately. Opportunities – Identifying the opportunities external market has to offer is extremely important while analyzing a new idea/business decision, if not this could be detrimental/damaging for the business. SWOT analysis would help the business to seize an existing opportunity in the external market. Threats – Certain external factors can pose threat to existing business or cause problems in the implementation of any new idea/business decision. E.g. new government policies. A SWOT analysis can help you identify threats and ways to counteract them, depending on your strengths and weaknesses. SWOT analysis looks at all the internal and external factors that can affect your business or the decisions that you are taking based on this. For example – For an ongoing Business Excellence Project ABC company has decided to go with the trend and automate some of its processes using RPA (Robotic Process Automation). The objective of the project is to enhance the efficiency of the overall process without any compromises with the quality of the output. Step 1 – Start with a questions in mind – How will RPA help me in achieving my objective? My process would become faster, but with RPA would it also be error free? Are there any particular weaknesses of RPA that we need to ponder on before implementing the solution? Step 2 – To answer the above questions we do SWOT analysis – - Building on Strengths - The value that the current business creates for its customers is that it serves as a one stop solution for all the Small and Medium sized businesses and offer services such as Accounting, Software Development, Marketing, Administration, Medical Billing etc. at the best prizes to help its customers get break through services that only the larger businesses can endow. With RPA current business can build on its strengths as now we could do “more with less”. With limited resources faster and additional work can be done which would give the business a competitive edge and assist it in keeping up with the pace of fast changing market needs. - Minimizing Weaknesses – Employees are used to working in the traditional manner and are not completely exposed to the advancement in technology. Change management would have to be carefully planned out. Trainings could be planned before implementing the final solution to keep the team up to speed with the new technology being implemented. - Seizing Opportunities - Artificial Intelligence, Machine Learning and Robotics, these technologies are widely used in various industries to help humans focus on analytics/decision making rather than regular mundane tasks. Implementing robotics for some of the existing processes in the company would help team focus on analysis and important decision making rather than processing regular documents on a daily basis. This would also help the management get more business with limited resources and would have an overall positive impact on the growth of the company. - Counteracting Threats – The current business model demands data to be move from one country to another. Conflicting data privacy rules between the two nations could cause problems in implanting Robotic Process Automation to the existing processes. Current policies such as GDPR (General Data Protection Regulation) needs to be looked into and concrete analysis is to be drawn in order to proceed with hassle free implementation. Step 3 – Further SWOT analysis can be done on any individual issues highlighted in the high level SWOT analysis, such as the one about GDPR (General Data Protection Regulation) and conclude the final analysis with a list of implementation steps and the control plan.
-
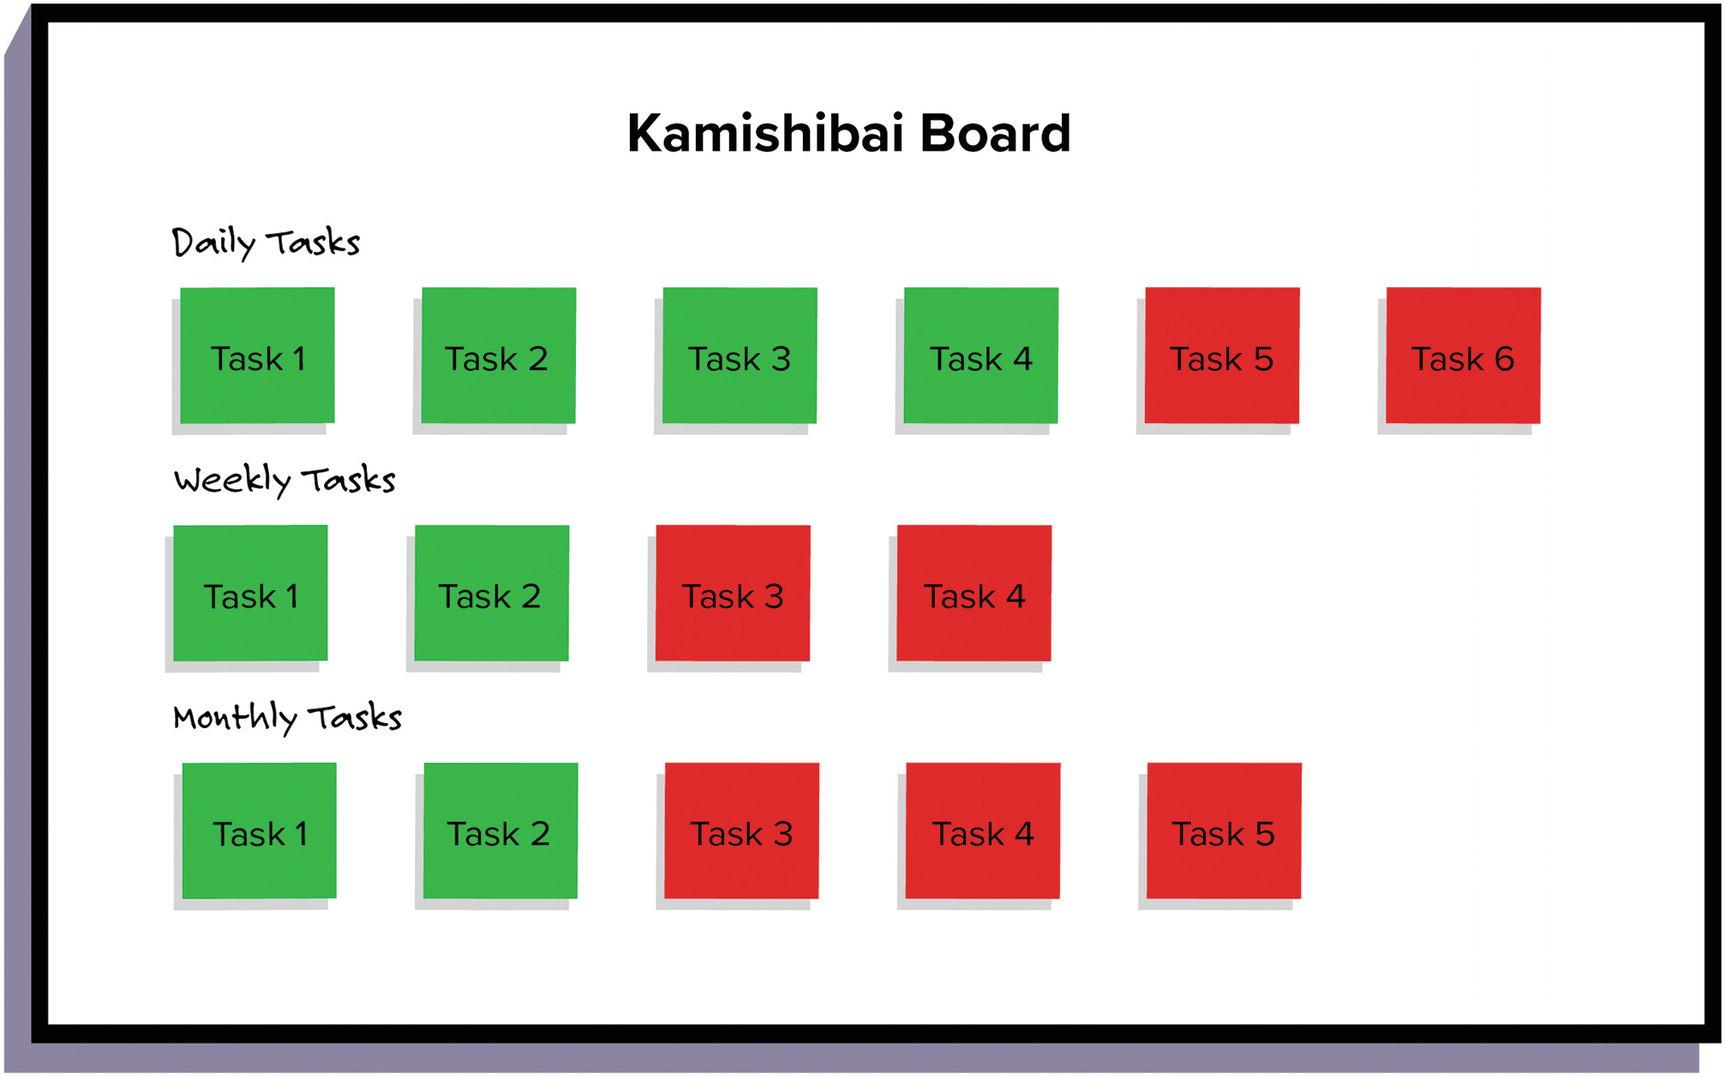
Swarandeep Kaur Juneja replied to Vishwadeep Khatri's topic in We ask and you answer! The best answer wins!Toyota Production System is known to use various tricks and methodologies to make mistakes obvious at the first glance. Kamishibai Board is yet another approach in the same direction. The ancient Japanese art form of Kamishibai has deep-rooted itself as one of the foremost management tools for performing audits in manufacturing environments. Kamishibai Boards clearly highlights the status of Daily, Weekly, Monthly or even Quarterly Audits. There are two prominent colors visible on the board – Green and Red. Green indicates the tasks and done and Red indicates the tasks are still pending. Pros - 1. These boards and simple and easy to use. During Gemba walks supervisors can easily identify the status of each of the tasks. 2. Skipped, forgotten or missed tasks can be identified quickly and vital remedial actions can be immediately implemented. Cons - 1. If not used correctly and the status of all the daily tasks are managed through Kamishibai Board then it's likely to be left unused and not updated regularly. Service Industry - Kamishibai is highly effective if used in the right fashion for both Manufacturing and Service Industries. There are a lot of key tasks in the form of review, quality assurance etc. that can be managed through Kamishibai Boards. Each of the managers/reviewers can update the status of their Daily, Weekly, Monthly or Quarterly tasks on the Kamishibai Boards and the Quality Assurance department will not be required to collect status reports from each of the departments individually. Summary - The only thing to be mindful of is, not to overload Kamishibai Boards with all the tasks, use it for key tasks to reap maximum benefits.

-
Swarandeep Kaur Juneja replied to Vishwadeep Khatri's topic in We ask and you answer! The best answer wins!All three RAPID, DACI and RACI matrices are usually used in Project Management to clearly define the roles played by each individual involved in that project. Many a time projects lose track because everyone’s left baffled as to who is responsible for what. To avoid those circumstances we use DACI, RACI, RAPID and other variations of such matrices depending on our needs and requirements. Let’s start by understanding each one of them individually – DACI The four roles in DACI are – D = Driver A = Approver C = Contributor I = Informed Driver – Driver as the name suggests is the one who is responsible for driving the project. Their primary role is to lead the project from beginning to end. Major responsibilities of the Driver are – 1. Create the project plan and scope 2. Define the communication plan and share regular updates 3. Set-up meeting and regular check-ins 4. Communicating and bridging the gap between various executors, taking their advice and getting necessary approvals. Approver – Approvers are generally from the top management who are the sponsors of the project. Country Head/CEO/CFO/President etc. Contributors – Every project requires Subject Matter Experts and contributors are these SMEs who are often consulted at various stages of a project. Informed – They are the ones who are informed on the final decisions taken but they have no say in amending those decisions. RAPID RAPID was created by Bain & Company, in order to have clear understanding of who is responsible to take what kind of decisions and who is responsible for executing those. Often times there are a lot of internal conflicts in an organization as to – Who owns the process? Who has the authority to make decisions? Who is an authoritative position to have the final say? In order to make decision making transparent and structured RAPID was developed. R = Recommendation A = Agreement P = Perform I = Input D = Decisions Therefore RAPID clearly identifies and distinguishes between those who are responsible for Making Recommendations from those who are responsible to Establish Agreement, Perform Tasks, Provide Necessary Inputs and Make Centralized Decisions and enforce them. RACI RACI is very similar to DACI but quite different from RAPID. DACI and RACI are task oriented whereas RAPID clearly defines the decision making roles. R = Responsible A = Accountable C = Consulted I = Informed In RACI matrix last two overlap with DACI, whereas ‘R’ here states who is responsible to implement the task, the performers and the executors and ‘A’ states who is Accountable and Answerable to the leaders in case they question those tasks. Summary - There is no one suitable matrix for all, depending on the type of organization and the type of project select the best fit in that scenario or try a combination of these.


-
Swarandeep Kaur Juneja replied to Vishwadeep Khatri's topic in We ask and you answer! The best answer wins!Time management is psychological and Parkinson’s Law of time management states that work inflates to fill in the time allotted for its completion. E.g. If you have 2 hours to cook a meal you will take complete 2 hours to finish, whereas if you had a set deadline of 1 hour then you can manage the same task in 1 hour as well. Therefore it is necessary to follow the following points in order to use Parkinson’s Law to enhance productivity – 1. Set Deadlines/Targets – Yes it is important to trust your team to finish a set of tasks assigned to them but at the same time it is also necessary to set deadlines for each of the assigned tasks, otherwise they are most likely to lose direction, procrastinate and take any number of hours without any logical explanation. 2. Set the Right Expectations – Individuals and Businesses must know how to manage time efficiently, hence one should be clear about what is the expected outcome and the correct approach to reach there. This would ensure waste reduction and enhance efficiency and productivity. Parkinson's Law states that clear objective is very important to follow the right route without wasting time on unnecessary things. 3. Track/Monitor and Analyze – What gets measured gets done, therefore keeping that in mind it is essential to track tasks, monitor them and conduct an effective Time Analysis. Based on the historic data, Control Charts can be prepared, this would ensure realistic and achievable deadlines are set in the future and would also assist in effective Capacity Utilization Analysis. 4. Share Feedback – Share timely analysis with all the team members to highlight their current performance in the form of efficiency/productivity and effectiveness levels, which would ensure that they don’t lose track/sense of time in any manner. 4 Day Work Week – The 4 Day Work Week model is successful in many countries now and surprisingly has resulted in enhanced productivity which can be explained now based on Parkinson’s Law of time management explained above.
.jpg.48995a8bd02c411e5af7d425d67dc6b8.jpg)
.jpg.220708223573203b1079fd91e8418b67.jpg)
-
"Practical implementation of various six sigma tools and methodologies was my expectation from this course. The best part was the examples used to explain the in-depth logic." - Swarandeep Kaur Juneja, Associate, BDO LLP