

Rajesh Chakrabarty
Members
-
Joined
-
Last visited
Everything posted by Rajesh Chakrabarty
-
Rajesh Chakrabarty replied to Vishwadeep Khatri's topic in We ask and you answer! The best answer wins!In case of an objective to measure the customer satisfaction for the performance of an E-Commerce Website for Electronic Goods (Only for website) , the obvious situation is that the browser/ customer has opted to visit the website to either purchase or only browse the site to understand options (Window shopping). Here, the browser is definitely a person who is net savvy and a prefers the convenience of visiting a website from his current location. He has logged in to the site to either test the water or to make a purchase of a good which is a need for him. Hence in the quest to measure the customers overall satisfaction, following is the ranking I would suggest for the five metrics: 1) CES- It is important to measure how the customer felt about the effort / ease for him to browse through the website. It will help the organisation to understand the effectiveness of the site’s UI. Also the platform can detect from which page the customer has quit the site if the visit was not a sales conversion- This also helps the organisation to estimate if there is any particular point from where majority of potential customers are quitting from the site. 2) C- Sat- Though not as relevant as the CES , Customers experience during the site visit and the extent to what his expectations have been met will determine the Csat and his loyalty and how much he promotes the same CRT to others, hence I have reated it as second 3) CAC- is important to understand the cost to acquire customers or entice customers to log in- Conversion to sales is the next level. This will help to determine the COB. 4) NPS- This will help the organisation to assess whether the customer is a promoter or detractor so that the potential to get more visitors through referrals can be projected. However, In case the customer buys the goods, his loyalty will also be governed by the quality of the good that he has purchased. 5) Churn- In this case, the churn of the customer is dependent on multiple factors other than the website experience, like the price point, Variety & quality of goods hence Having said that , The most important point that we must remember here is to make good use of the measures and learnings derived from them and implement
-
Rajesh Chakrabarty replied to Vishwadeep Khatri's topic in We ask and you answer! The best answer wins!In case of an objective to measure the customer satisfaction for the performance of a classroom training provider of courses for working professionals , the obvious situation is that the customer has already booked the slot for the CRT. Here, the customer has come to receive some training which is a need for him. Hence in the quest to measure the customers overall satisfaction, following is the ranking I would suggest for the five metrics: 1) CES- It is important to measure how the customer felt about the effort it took for him to learn / participate during the CRT. CES is best applicable when there is an immediate need / expectation is met. 2) C- Sat- Though not as relevant as the CES , Customers experience during the CRT and the extent to what his expectations have been met will determine the Csat and his loyalty and how much he promotes the same CRT to others, hence I have reated it as second 3) NPS- This will help the organisation to assess whether the customer is a promoter or detractor so that the potential to get more participants through referrals can be projected, and simultaneously understand whether the CRT provided was apt. 4) CAC- is important to understand the cost to acquire participants for the course, which includes creating leads and then converting them to participants. This will help to determine the fees for the Course and also budgets the arrangements for the Class. 5) Churn- In this case, the churn of the customer is not relevant / applicable for this example as the participant will not go to some other training center for the same course- Having said that as mentioned above , if the CEC ,Csat & NPS is low, the participant is definitely not going to come back to the institute for any other course. Having said that , The most important point that we must remember here is to make good use of the measures and learnings derived from them and implement improvements in the process to ensure immediate customer satisfaction, future loyalty and referrals.
-
Rajesh Chakrabarty replied to Vishwadeep Khatri's topic in We ask and you answer! The best answer wins!In case of an objective to measure the customer satisfaction for the performance of a Call Center for Credit card Support, the obvious situation is that the customer is already a customer and has called for some query or concern or Information- Basically an immediate need. Hence in the quest to measure the customers overall satisfaction, following is the ranking I would suggest for the five metrics: 1) CES- It is important to measure how the customer felt about the effort it took for him to interact with the Call Agent/support team. The customer’s experience , or the ease with which his need was satisfied here by the call center team will determine his loyalty to the Credit Card Brand. 2) C- Sat- The next objective would be to understand the satisfaction of the customer on the advantages/ facilities he gets through his credit card , as it will help the organisation to understand the opportunities / corrections required in the services and the product by itself that are required to keep the customer’s loyalty and also define measures to create better/ best satisfaction levels as a process. 3) NPS- This will help the organisation to understand whether the customer is a promoter or detractor and thus understand whether the service provided was apt for the situation. 4) Churn- In this case, the churn of the customer will happen only after a period of time as the solution is provided for immediate purpose – However it will be good to keep in touch with the customer through engagement programmes to ascertain whether the customer has churned out, or using any other cards. 5) CAC- This is the last preference - Actually has limited significance as the customer is already acquired and the cost of acquisition is already borne- The focus now should be on the cost of staying in touch with him through execution of CRM and other engagement programmes and retaining him as a loyal customer with Higher value (Upgraded) Cards . Having said that , The most important point that we must remember here is to make good use of the measures and learnings derived from them and implement improvements in the process to ensure immediate customer satisfaction, future loyalty and referrals.
-
Rajesh Chakrabarty replied to Vishwadeep Khatri's topic in We ask and you answer! The best answer wins!In case of an objective to measure the customer satisfaction for the performance after sales in an Onsite Service for Electronic goods, the obvious situation is that the customer has already purchased the product and has visited the site for after sales service. Here, either the customer has experienced a defect in the good or probably needed to understand better, the working of the electronic good that he has purchased. Hence in the quest to measure the customers overall satisfaction, following is the ranking I would suggest for the five metrics: 1) CES- It is important to measure how the customer felt about the effort it took for him to interact with the customer service /support team. The customer’s experience here will determine the notion or image he carries back with him. I remember having gone to the One Plus service center because my new phone had a bug. I was very much upset with the issue in the phone- but I think the service that was provided to me at the service center and the way the team explained the issue and provided the solution, took all my grievance away. 2) C- Sat- The next objective would be to understand the satisfaction of the customer on the good and the service provided to him as it will help the organisation to understand the opportunities / corrections that are required to keep the customer’s loyalty and also define measures to create similar satisfaction levels as a process. 3) NPS- This will help the organisation to understand whether the customer is a promoter or detractor and thus understand whether the service provided was apt for the situation. 4) Churn- In this case, the churn of the customer will happen only after a period of time as the solution is provided for immediate purpose – However it will be good to keep in touch with the customer through engagement programmes to ascertain whether the customer has churned out. 5) CAC- This is the last as the customer is already acquired and the cost of acquisition is already borne- The focus now should be on the cost of staying in touch with him through effective execution of AMC and other engagement programs and retaining him as a loyal customer for another purchase. Having said that , The most important point that we must remember here is to make good use of the measures and learnings derived from them and implement improvements in the process to ensure immediate customer satisfaction, future loyalty and referrals.
-
Rajesh Chakrabarty replied to Vishwadeep Khatri's topic in We ask and you answer! The best answer wins!The “Inventory” is one of the seven wastages in lean Philosophy, which basically indicates: - excess material, - Work in Process(WIP) - or Finished goods. Any of the above 3, or all of the above 3, when is more than the immediate requirement, represents cash or monies held up in the form of material laying dormant- It is difficult to turn into cash quickly. The inventory also occupies space which is very dear in the current times with real estate prices on a continuous upward trend. The Causes for inventory can be many including- - Waiting time in the process when the input material is ready, but the processing of the same is not started and has to remain dormant. - Gap in Process handoffs wherein a prep work is done but there is waiting time before the next sub-process starts - Overproduction- More output than required - Defects- when goods have to be held back for rework to avoid type 2 errors - Rejects- When the produced output has to stay as is not accepted by the customer for any reason. Inventory needs to be managed with due diligence, else can lead to wastage through undesirable occurrences like spoilage, pilferage, breakage depending on the type of goods stored- Sometimes an inventory in the ever-evolving software industry can become obsolete if not employed within an appropriate time of demand. Also, Inventory can also result in depletion in cash flow and eventually profitability due to loss of business opportunity due to low inventory turnover. The concept of inventory management as a lean concept is relevant across a wide range of industries including: Food Industry- Any underutilized/ dormant inventory can go waste or deem unusable as most of the times the raw material used is perishable. In the QSR Industry, where the food stock is frozen with a defined life cycle, added to the relevance mentioned above, inability to manage stock and hoarding non-selling products for long leads to holding up of monies and thus impacting cash flow till the said inventory is not sold off. Such inventory also adds on to storage cost of not only space but also the cost of maintaining the products in a refrigerated condition. Retail Clothing industry may suffer due to ever-changing fashion trends. Likewise is the Telephone hardware industry, wherein the value of a model keeps dipping every day, holding on to an inventory of telephones for long will only reduce the ROI exponentially. In fact, similar relevance can be sighted in all luxury related industries like Automobile industry also. Software industry can become victims of wastage as Inventory can become obsolete if not employed within an appropriate time of demand. Health/ Pharmaceutical Industries- any expiry of material/ products due to mismanagement of inventory can cause a serious hazard to the life of beings. In the Contact Center Industry, the calls waiting in the queue also can be considered as WIP and hence Inventory. Too Long Waiting times/hold times can lead to customer dissatisfaction and/ or loss of business if it is an inbound sales call, as the caller may disconnect the call. Similarly, any business process with Queues like in the airports or for that matter any counter service with waiting time will consider the queue as the WIP- Inventory. The maximum relevance of the concept of Inventory and inventory management is probably in the Warehousing Industry, where it is very important to ensure that the available space is used optimally and the goods are not held for longer than the business dictates. Thus the Inventory as a wastage in the lean concept is relevant in many industries including the ones mentioned above.
-
Rajesh Chakrabarty replied to Vishwadeep Khatri's topic in We ask and you answer! The best answer wins!This was indeed a great article. It gave an insight into the implementation of the basic complaint handling method, which subsequently puts forth the culture and values of the organisation. The Basic 5 Stepladders towards perfect execution is well covered by Ocada through: 1) Easy and simple accessibility – Very important for the customer to be able to reach out with ease …It gives indicates that the feedback is welcome and appreciated and hence the process is made easy for the customer. 2) Prompt Acknowledgement- Very important as with the advent of technology in media and communication, a response is expected as a “default” by the communicator for the assurance of a communication loop being closed. The faster the response, the better. Also, the acknowledgment gives the complainant the comfort that his or her grievance is taken note of – and the initial anxiety is reduced. 3) Quick Response- fast or ready Decision on resolution. This is the most desired action that a complainant would want. Delight is guaranteed if the decision is in favour of the Complainant!! 4) Well Written Response : The language and tone plays a great role in the impact of the communication- A personal touch and a humane feel gives the best impact. 5) No Quibbles :The last straw for an already upset person would be any further objection or trivial query- It can at many times aggravate the initial ire. It is visible that Ocado has considered the factors to provide a seamless & customer centric complaint management system. A point that comes in for consideration is how well autonomation can be used ,to accomplish the above steps and an approach to improve the internal processes through the above-mentioned steps. - Ease of Accessibility is a completely technological approach as there are multiple channels available and all of them are easy to host on a single CRM Platform- Twitter, Facebook, Contact center, etc. The customer can use any channel that is convenient. - Acknowledgement can be an auto response. In addition to this, I personally feel that the customer should be provided with an acknowledgment / Docket number. This number can be used for any future reference to the complaint. - Quick Response is the key to resolving a complaint and mitigating most of the situations as a conversation starts with the customer- How well this conversation is effected is what makes the difference .. I personally believe that this process has to have a human intervention to understand the core issue or concerns that the customer has put forth- Some added benefits that can be accrued thus are : i) The Concerns faced by the customers can be categorized to specific functions/ Departments within the organizations and thus creating a functional accountability. Then they can be further bifurcated to different types of possible failure modes, thus also identifying the frequency of such detectable deviation from process. ii) The efficiency and productivity of the Functions / Departments can be improved by analyzing root causes of the defects and defectives and taking corrective and preventive actions. iii) Cycle times for internal processes can be defined and adhered to and thus a Lead time can also be committed to the customer. - Well Written Response can always be a canned i.e. predetermined responses through text – based technical support systems, because most of the complaints or concerns are repetitive in the online retail industry.However a minor intervation to give that “personal” touch is recommended for out of normal/ regular cases. - No Quibbles- will only give great comfort to the customer and hence the focus needs to be on reducing defects and type 2 errors – the system needs to be enabled through continuos improvement to reduce the need to take more than limited details of the order. The customers are normally okay to give purchase details in brief. They expect the remaining work to be done by the merchant. In the case study provided the cost of the reject material was not to the extent of requiring to many more details- this is a business call that the organisation needs to take – what is the extent of COB that is okay to pass on towards customer delight. An additional gesture that can also be done here is to update the customer on the action taken post the feedback to improve on the process and to reduce or eradicate the recurrence of their concern or complaint in the future. This can actually create the WOW factor , as the customer will feel delighted that not only was the concern resolved as an single standing issue , but his feedback was taken as an starting point for improvement in the organisation- THE CUSTOMER WILL FEEL IMPORTANT- in true means the gesture will imply that CUSTOMER IS KING!!
-
Rajesh Chakrabarty replied to Vishwadeep Khatri's topic in We ask and you answer! The best answer wins!I have come across one acronym GAME, which is closest to the DMAIC... Wherein: G=Gather Facts A= Analyse M=Make a SMART Plan E=Execute. Here, GAM covers the DMA and E (Execute) covers the I (Implement) The C (Control) is missing though.
-
Rajesh Chakrabarty replied to Vishwadeep Khatri's topic in We ask and you answer! The best answer wins!Example 1)Introduction of ordering kiosks in Restaurants-it has reduced the handoff in the process from the order taker to the kitchen. Example 2) ERP with accounting modules which help to align the creation of invoices automatically, based upon the indent raised by the customer. Reduces the process of handoff between the sales personnel and the accounts clerk. Example 3) Hand held Tabs for Planned Maintenance routine. The technician who is reviewing the PM uses a checklist in the application to check whether he had done everything as per the requirement and defined process flow. Any other technician who replaces him after his shift only needs to follow the application on the tab. Example 4)Traffic light is a good daily experience. Each automated amber light change manages intermediary signals for stop or go, minimizing the handoff process.
-
I do agree on the point about a person having experience in the area of operations acquiring skill and technique.... This person can definitely be of great help to the project lead/improvement Manager.....especially for FMEA
-
I would request all my colleagues who feel that project experience is not required, to empathize with the company that wants to hire . Let us refer to the analogy of a situation wherein a heart patient who has to choose between a MS in cardio without any experience in real operations and an MS in Cardio who has already performed successful operations.
-
YES!! As the experience and the transferable knowledge gained from the project counts. The more the projects completed, the better.
-
Rajesh Chakrabarty replied to Vishwadeep Khatri's topic in We ask and you answer! The best answer wins!Within the organisation, It is imminent that the professional markets six sigma/Lean/Business excellence implementation as a profitable business venture. There is a three step approach that needs to be taken... 1) Evaluate the key panel members who will be easier to approach and convince. Ideally the best person to 'target' is the CFO. 2) Prepare a plan or presentation with time tested concepts which emphasises on communicating an idea in terms of it's monetary benefits.. Like better Throughput, ROI, Cash flow, positive P&l. This should help as the even the most conservative leader/manager will think twice before rejecting any idea that has even the faintest potential to reap in Monies. They will offer some time for the presentation 3) During the discussion, the Professional should market it as a low risk proposition and limit risk related conversations. CHOOSE the lowest hanging fruit.. Or a project that will be easy to complete and will have decent results... Needs to be an efficient project. This pilot project should have limited risks.... It should be communicated that a full fledged lean/six sigma implementation will start ONLY if the pilot project proves successful. Most top management members will be fine to this and give the go ahead. In case this approach fails, then the other back up options are : 1) Conduct a Workshop on the fundamentals of Lean and six sigma in your organization... Actually this can be the first step to approach our own organisation also... It completely depends on our presentation skills..... We may opt to invite an external expert also, to conduct the workshop for the core management team. This will ignite the spark for kaizen and other methodology. We may want to invite our own VK from Benchmark to conduct the workshop (No brownie point expected for this ). 2) contact your friends, colleagues who may know of small businesses like a retail shop or a manufacturing unit and offer your expertise and take the 3 step method mentioned above. Other options could be to advertise your services online.... The objective should be to start with the one successful project that will pave the path for many more.
-
Rajesh Chakrabarty replied to Vishwadeep Khatri's topic in We ask and you answer! The best answer wins!Let me first jot down the definition as I understand: An Effective Process is the process is the process which has a good objective and desired end, however the methodology or flow does not provide the best results due to multiple reasons like in a appropriate usage of resources or available knowledge.... The ROI or throughput is always below the expectation of the Main stakeholder (investor) or top management. Whereas The Efficient Process is where the methodology used or the functioning used is the best as there is least waste of time and effort as resources are used optimally and the results or throughput and ROI from the process is lucrative.... The difference between Effective process & Efficient Process can be simply put in as being Effective is is about doing the right things whereas being Efficient is about doing things right. A good process needs to be both. One example that comes immediately to mind is a sweet maker who makes wonderful authentic Bengali sweets with high quality raw material with highly paid specialists who carry tribal knowledge. He lacks the knowledge of food storage and depends on the rudimentary skills of the 'specialists' to preserve sweets till sold. This causes lot of post production inventory when customers do not turn up at his retail store.... Lot of wastages, low inventory turn etc are obvious pain points... Here the owner is definitely running an effective business process.... Given that the product he is putting forth to the market is a novelty..... However the same business process also becomes efficient when he ensures that there is a documentation of the recipes and standard check points and there are enough trained people to reduce dependency on 'specialists'..and are willing to work at lesser pay(best if they work on a per unit production model) He also brings in technology with equipments that help to preserve the food longer with intact quality standards. He then also goes on to use available technology to go 'online' and hires last mile logistic partners who are willing to ferry across orders on a per unit arbitrage model... What he has done here is that he has converted most of his cost into variable cost and reduced his fixed costs.... Also he has reduced his wastages and improved his inventory turn as he manages demands that he has from online online... This way he is able to improve his inventory turn also by following trends of demand and sale. He has launched his brand big time into the market... He has reduced his marketing costs by associating with the food aggregators like Zomato & swiggy who work on variable cost model... Thus he has continuously improved the business process to ensure he gets better ROI and cash flow. Once he is confident that he can replicate his business process, he may want to sell off his retail space and focus on more smaller units with lesser rents where he can produce his products and go complete online..... The business process will be both effective and efficient now.
-
I have voted for an "yes" when the same question was asked with an YES/ NO option. That is because , going by the definition of a defect – “Frailty or shortcoming that prevents an item from being complete, desirable. Effective, safe, or of merit, or makes it to malfunction or fail in it’s purpose”, It is possible to have a Defect free product . It is possible if the ideal conditions are provided and ONLY a single unit(Or a very low sample size) is to be produced, which has liberal specifications or so to say has no astringent specifications. This is an ideal scenario- a response to a request for 1 single piece of blank paper to write- I cannot see a defect happening in fulfilling this request. Having said that , in all practicality, I believe firmly that, As the Principle of uncertainty states “We may significantly modify what we are trying to measure, simply by making an effort to measure it.” What this implies is that the inspections and tests to measure or analyse a process by themselves can actually cause a defect. Thus, practically, the concept of zero defect is surreal!!
-
Rajesh Chakrabarty replied to Vishwadeep Khatri's topic in We ask and you answer! The best answer wins!In any work, such as DMAIC/ DMADV project,which is done by more than one person, basically a team- There is a requirement to define and elaborate the following key factors for successful execution of the said work(Project / Daily operations) - clear goals, roles, processes, and interpersonal relationship (GRPI). The responsibility assignment matrix (RAM) can be used to clearly define the role and responsibility of each of the members in such teamwork. There are 2 commonly used responsibility assignment Matrix RACI & ARMI- Noted below are the descriptions of both- RACI breaks down the teamwork into tasks, and map out who is responsible, who is accountable, who should be consulted, and who must kept informed for each of the tasks. R - Responsible The person who is assigned to carry out that particular task (the doer). Each task must have at least 1 responsible person. A task can have many responsible persons. A - Accountable The person who holds ownership of the task, and is responsible for its success or failure. That person is authorized to make final decision on the task. That person has the power to accept the completion of the task. Each task can only have 1 accountable person. C - Consulted Person who can be asked to provide opinion or input about the task while it is being worked on, normally a subject matter expert (SME). The consultation should occur before decision or action is taken.Each task can have either none, one, or more than one consulted persons, however there should not be too many. I - Informed Person who needs to be kept informed that a decision or action has been taken. Each task can have either none, one, or more than one persons to be kept informed. The RACI model can be extended to RASCI or RASIC by including a support role. S - Support Person who is able to help Responsible person in getting the task done. The person possesses resource that can be shared out, or taking part in a supporting role. Each task can have either none, one, or more than one support persons. The ARMI is another model that serves the similar purpose to define the level of support assigned to each stakeholders. A - Approver The person who sign-off a milestone and approve to move on towards the next milestone. R - Resource Persons who have the expertise or skillsets that are required in the project. M - Member Persons who are the project team member. I - Interested Party Persons who need to be informed about up-to-date status along the project. The Somewhat commonalities between RACI(S) and ARMI are RACI(S) (Not in order) ARMI (Not in order) Accountable Approver Responsible Consulted Resource Support Member Informed Interested Party As the above table demonstrates, the similarity is evident except for the fact that the accountability and Responsibility is defined and delegated more intricately in the RACI metric. It only highlights the importance or weight given to the competency level with regards to accountability and responsibility in the process/ activity/ project. To answer the question about my preference in the two is totally dependent on the required competency, authority, capability and utility of the team (participants) in regards to the work/project. In the company that I work for, a QSR, with franchisee outlets across the country, most of the processes/ projects are done with a top down approach. At the upper level of the value stream we do a lot of work on concept building/ Ideation, problem solving , process definition, control charts etc. This requires involvement of people from the corporate team from various departments and the time and effort needs to be well planned and responsibilities / stakes need to be allocated with due care and reason hence the RACI metric is more appropriate as we divide the responsibility amongst the Sponsor (accountable), The Project Manager (Responsible),the Experts- Dept Heads (Consulted) and the relevant Executives (support) – The developments and briefs of the project is provided and communicated to all the stakeholders in the form of a document called Manager’s Guide- which contains the GRPI with the approach pattern . Once the said Manager’s guide is done and is passed on to the Operations team for execution the ARMI Metric is relevant as the Project Manager acts as the Approver and the Line managers who execute the activities are the Resources as they are briefed directly by the project manager They are the ones who take the lead to train and motivate the staff in the outlets to execute the defined process/ activity/ promotion / project. The staff here are the members of the activity and the line manager owns the responsibility of updating the stakeholders both internal (Support departments)and external (Customer) who are the interested parties in this activity. In conclusion, the choice of metric is dependent on the scope for allocation and the availability and capability of the stakeholders in a given situation or scenario.
-
Rajesh Chakrabarty replied to Vishwadeep Khatri's topic in We ask and you answer! The best answer wins!Given the challenges faced by the product development team, in a QSR set up, only to decide what product to build due to the constant conflict of interest within the internal stakeholders/ departments (Operations, Marketing, Strategy, QA ,Suppliers etc) the additional terms in the question for this paper is a real brain tickler. Ideally , the product specifications are developed from the suggestions and recommendations of the end customer .A proper analysis of the needs of the customer is aligned with the Business perspective and a PRD is prepared for the same and the specifications are based on the inputs that are received from the customer’s expectation. However, as per the precondition mentioned in the question, the product in ideation is innovative and the customer has neither experience nor expectation. Also, the assumption is that the product should not be exposed to market or customers before launch.. Hence , in the given scenario, the product development team will not rely on the customer to translate their requirement into specification but will need to write the requirement for a product that the broader market needs and will buy or invest in. The best way to start in this situation is to start with the problem- A well-articulated problem statement which covers the need of the market. The problem statement should be drafted from the perspective of the person that has the problem. The objective should be to understand the problem and the sense of the value associated with solving it. Though not idealistic , let us envisage the parts of the problem statement for a New product in the menu that a Product development team in a QSR set up would draft. Part# Part detail Example in short 1 The first part is the description of the persona who has the problem. This should be in detail People with crunched time , health conscious, craving for “regular Indian” meal (Breakfast). They prefer to have “on the hop meals”.for them meal time is a part within the work time…i.e meals are done during meetings- The busy metro executive 2 Description of the Problem- As much in detail as possible- The problem itself can be given a Name which can be then used as the point of reference during the whole project period. They are unable to prepare breakfast “at home” and are looking for best options on their route to work 3 Jot down the frequency of the problem- It is worthwhile to pursue the project only if the frequency is high and the impact of the problem is high on the business opportunities. Obviously the value of the solution to this problem(product) will be appreciable. Every day- every morning and evening for a snack during tea break - . It is imperative that the above brainstorming session must involve the line managers, who are the closest touch points of the last mile at the end of the value stream. They would be able to express the problems the customers face and obviously how that impacts the business. If this activity s done successfully, it will end up to the identification of the problem that can be solved with the innovative product and the customer will be happy to pay for it- this gives rise to an opportunity and good grounds for a new innovative product. The idea from hereon should be to give the product development team complete autonomy in creating the product within any constraints that may be there like: - Availability of resources - Budget - Space required at the outlets to manage the product flow – from inwards to outwards - Pricing slabs – The Menu management and strategy team would have a price range that the final product will need to be placed within. The product development team then , within itself needs to get the final problem statement drafted with solutions : It is prudent to Use the Six thinking Hats in this exrcise - Start by appointing a group of people who are responsible to be the voice of the customer. - Let this group identify the market problems solely based from the information gathered from the line managers. - The discussion needs to be documented and should be ccssible by all the team members. - Each problem needs to be jotted down along with a justification that explains why the problem exists and how important it is to solve. - Keep reminding the team of the main goal (problem statement) so that there is no deviation from the objective while developing solutions. - Capture a list of the product features, for each problem, that will solve the problem - If any problem seems to be unsolvable or not fully solvable, continue to re- review the business case to ensure that the product is still viable for market release. From Problem Statement to Deciding the Specification Limits. Once the problem statement and the solutions are finalized, the team needs to develop the specification limits. From the problem statement exercise the team now has enough information to draft the specification. The best approach is to ensure that the specification limits are set in a phased manner – ie. The specs of the products need to be checked at the highest range of variation within the spec limit, after every release of specification to ensure that the same is in sync with the problem statement and the product is still a valid solution and the customer will be happy to pay the defined price. The biggest goal in the QSR for daily operations is to provide value for money. The objective of this periodic check is to ensure that there is no trade-off ,which is inherent in the process of product development and also to ensure that the product is always within the limits which will keep the product aligned to the original target. Defining the specification limits based as mentioned above will keep all stakeholders happy as the process will be under control and there will be a framework and transparency that will prevent overriding of decisions , lesser associated wastages and faster delivery of product. Though it is a risk to launch a product which is not tested or sampled amply, if the effort to resolve the problems is taken effectively half the battle is won and the approach of launching the product directly can actually save costs of sampling and testing and can be a faster approach as compared to the conservative method. It may actually come out as a more fruitful approach to pleasantly surprise the customers than to deliver another iteration of something you are already serving. I know of a QSR which is coming up with the option of “UPMA” & “Steamed Idli” as a Breakfast & snack product. The products are precooked and in frozen condition and can be easily steamed in steamers within 3 minutes for hot and quick service. It will delight the customers who have similar problems as mentioned in this note.
-
Rajesh Chakrabarty replied to Vishwadeep Khatri's topic in We ask and you answer! The best answer wins!The concept of yield in Lean management is considered as the measure of the quality of a process. The types of yields discussed or considered are First Pass Yield(FPY) & Rolled Throughput Yield(RTY). Both these measures are basically the ratio of good units produced to the number of units entering the process, where unit is any item that is being processed. The First Pass Yield or Throughput Yield is a unit based metric wherein the calculation occurs after any check is conducted to determine whether a unit is good or not. For example, in a QSR, let us look at an Offsite bulk order for 550 Burgers at a reputed Children’s charity event . Before serving the complete lot to the Children, the products are inspected for quality. It was found that 150 burgers were not up to the accepted standards, but 140 of those burgers were “reworked” upon with some fresh salads and sauce, however 10 burgers were so badly damaged during transit that they were not fit to be served at all. These 10 burgers were wasted. The FTY here will be 400 divided by 550(400/550)= 72.73%. The base is obviously the total number of Burgers sent for distribution and the 400 numerator is derived by subtracting the 150 burgers with defects. It is noteworthy that FPY does not account any rework or wastage and hence it is literally the “First Time Yield” and gives a correct picture of the efficiency of the process. The concept of Rolled Throughput Yield (RTY) is different- It is the measure of the overall Process quality level. Every Process step (Sub process) will have a maximum and Minimum yield. RTY is at the end of the process is smaller than the lowest yield of any single process, ie. As the number of process steps increases the RTY becomes exponentially smaller. There are 2 popular methods to calculate the RTY Let us take an example where there are 3 process steps with each step having input units and output units, where input units are the ones which enter process steps and output units, as the term suggesta , refers to the good units(Defect free) produced by each process step. From the above note, we know how to calculate the FPY of each process step. To calculate RTY, the FPY of each process step needs to be multiplied. Process Step Input Output FPY 1 200 180 0.90 2 180 160 0.88 3 160 150 0.94 RTY= (FPY1) X (FPY2) X (FPY3) RTY= (0.90) X (0.88) X (0.94 )= 0.74448 Thus the RTY for all process steps is 74.44% . It goes to say that there is a probability that 74.44% of the input will be going out as output with no defects. The other method of RTY calculation is more in detail and the approach is very precise. Here the RTY covers the DPU data for the process or product and then the DPU of each process step is multiplied. Let us consider yet again that there are 3 process steps. In this method, two metric ie. DPU needs to be calculated for each process step. DPU can be calculated from the DPMO also, just by dividing the DPMO by 1 million. In each Process step the DPU is then deducted from 1- this provides us with the FPY for each process step. The logic is obvious here- The Defects opportunities per unit (DPU) calculated in each process step is subtracted from 1. Here 1 refers to 100% yield from each process step. Thus the 100 % yield less the DPU for each process step is equal to the Good (defect free) units produced by each process step. This is the FTY in each process step. Then, Same like in the method above, the RTY is calculated by multiplying the FTY for each process step. As the above methods to calculate RTY denote, RTY is a realistic view of yield (quality) of any process. Given that the calculation of RTY considers the defect level up to the unit level of the process, augments the reliability of the metric as a good measure of the quality of the process and hence is the preferred yield calculation method over the FPY. Thus, if the RTY is low, it is a sign that the process is inefficient and needs improvement. The more the value of RTY, the better is the efficiency of the process. At 100% RTY the process efficiency is at it’s best and can be considered inefficient only if the method of measurement of the RTY is incorrect or the data used for the same is incorrect.
-
Rajesh Chakrabarty replied to Vishwadeep Khatri's topic in We ask and you answer! The best answer wins!The Hawthorne effect is impending as it is prods on the intrinsic human behaviour. It is a common observation that there is an improvement in human behaviour of performance when there is attention on them from their supervisors, Clients, colleagues or for that matter whomsoever they consider as the entity to which they are answerable for their performance. Taylor’s theory also somewhat seconded the theory putting forward the idea that workers are mainly motivated by “pay”. According to his theory of scientific management, workers do not enjoy their work by nature and hence need supervision and control through performance assessment. Having said that , given the dynamic behavioural habits of a human being, it is but natural that the worker/ team , in their effort to prove their performance will find loopholes in process to showcase their better performance – Everyone likes to shine!! No matter how outstanding the organization is, the people who have learned how to manipulate a metric for performance measurement, without actually having to perform will do just that, at every possible opportunity. The management must work with this fact before defining any performance management system. More often than not, many organisations are not able to curb this effect is because the people defining the performance management framework are not experts in performance management- They refer to the business patterns of the previous terms and look at only bettering them as the best method to measure performance and attach incentives to this perceived improvement in performance . The logic is static and does not consider the operating realities that connect to the performances. The performance hence is related to numbers which can be manipulated and gives the opportunity to the teams/ workers to show that a process is more complex than it actually is and artificially create poorer than natural performance so that it is easier to showcase improvements when the same is attached to “incentives”- Thus seconding Taylor’s theory. How should one go about neutralising such effects while baselining a process? First thing first , Instead of striving to reduce judgements to a single ROI number or to the comparison of metrics to previous trends , the performance measurement system should be designed in consultation with the people who understand performance best- The line Managers. Designing the Performance Management System - Performance Management systems should be designed with both the top-down & Bottom- Up approach. It will help to bring in lot of operational detail into the system including failure modes and realistic cycle times. - Do not limit the performance goals to only outperform the existing performance standards. Instead the focus should be on the benchmarks from outside the organization- try to meet and better the market standards- This will keep the desire to manipulate any old metric from within the system- Focus will be more on catching up or doing better than what is happening beyond the organisation- People will be rewarded for doing better than everyone else- Good for all!! - All processes need to be broken down into series smaller tasks with defined ownership at all levels- Thus reducing the scope of impropriety in the process. The boundaries of measurement can be reduced also by breaking up responsibilities at various steps as everyone has an incentive to cooperate and gaming performances across various levels becomes very complicated and difficult. - Performance Metrics need to be diversified, as it will become difficult to manipulate several of them at once, with the fact that too many people will be involved . Performance Metrics can be based on the following criteria on which the “incentives can be based- i) Training within the process (ii) Quality of output (iii) Customer Feedback (iv) Operational Audit Scores and (v) contribution to the organisational goal. - Aligning all processes at every level and the associated KPIs to the organisational Scorecard. - The so defined Metrics should have varying sources which cover the process at 360 degrees of its functioning- like Supervisors, Colleagues, Customers and Time frames. - An effective performance management system needs to ensure that the ownership of the performance should change hands periodically- This negates the human tendency to get comfortable enough, with the process, and find scope for padding performances. Measurement method of performance Broadly speaking, Performance should be measured along the following 2 perspective- Perspective #1 covering actions related to defending and maintaining core business with metrics based on current business, like sales and profitability Perspective#2 Covering actions taken to build Business growth with metrics based from Marketing and incremental and exponential sales Perspective #3 covering actions taken to set the pathway for futuristic goals. Multiple levels like these will make gaming performances very complicated and less likely to succeed. Execution of the Performance assessment system With all the above means to neutralize the pitfall of base lining the performance due to human nature , one another good option is to trust the workers but verify the actions whether they are in sync with the 3 perspectives mentioned above. Leeway with ample verification helps in small organizations for sure. In Conclusion, we may say that an effective performance assessment system is possible when the top management and the line managers are in alignment to allow the organization to benefit from both the decision making ability of the former and the expertise of the latter.
-
Rajesh Chakrabarty replied to Vishwadeep Khatri's topic in We ask and you answer! The best answer wins!The Coefficient of variation (CV) is basically the ratio of the standard deviation to the mean in a given data set. It is used as a measure of relative variability and allows to compare the range or spread of many data sets. Just to understand it very easily let us take the examples of a QSR which is trying to find the best bet to open outlet , between 2 territories with favourable traits, proport- Traits like population, SocioEconomic level of population, Competition, Prospect growth in the territory etc. The Real Estate team has cited 20 locations and their rentals in both territories. NOW, the decision is narrowed down on the rentals of the sites as the sales projected in both the territories is more or less proportionate to the respective rentals. It would now be prudent to open the outlets in the territory where the difference in rentals are not very high amongst the outlets. This helps to budget the costs and the disparity of rentals is not much and hence the allocations of budgets for project work become almost even for all outlets. The management wants to understand in which territory the variation in rentals is higher. Then the territory with lesser variation in rentals will be the choice to open outlets. Territory 1 Territory 2 Average Rentals (Mean)- Average Rentals (Mean)- 120000 200000 Standard Deviation in Rentals Standard Deviation in Rentals 2000 3000 Coefficient of Variation Coefficient of Variation =2000/120000= 0.016 =3000/200000 = 0.015 In territory 1, The Average or mean of the rentals is Rs. 1.20 Lacs and the standard deviation is 2000/- . Ie. Rentals of most of the outlets are in the range from 1.22 Lacs to 1.18 Lacs In Territory 2 , The Average or Mean of the rentals is 2 Lacs and the standard deviation is 3000/-ie. Rentals of most of the outlets are in the range from 2.03 lacs to 1.97 Lacs. It is obvious from the coefficient of variation that the range of rentals are higher in Territory 1. The management will hence try to work on the Territory #2 Likewise, CV is used in many other situations like: - To compare relative risks in process during the Design stage as it be applied to any kind of probability distribution. - Since it is a statistical measure that is normalized and hence has no dimension, It is used as a measure of dispersion and used instead of standard deviation to compare data sets with different measures and significantly different means. - Most commonly CV is used to measure the volatility in the prices of stocks and securities In conclusion , is useful in any study that demonstrates exponential distribution i.e. It helps to show when distributions are considered low – variance and when they are said to be high – variance.
-
Rajesh Chakrabarty replied to Vishwadeep Khatri's topic in We ask and you answer! The best answer wins!Given the many benefits of FMEA in assessing posaible risks in a process and predicting any possible failures that may be there in a process, there are certain limitations that FMEA has... -FMEA by itself, in isolation is only a tool for assessment and has to be supplemented with another error eliminating strategies or tools to actually see the benefit of the exercise. - The effectiveness or Impact of FMEA is proportional to the knowledge, experience, awareness, attitude and wisdom of the people behind it. - It is not a one time process and needs to be updated and reviewed as the new elements of risks keep occurring or coming up in a given process. - FMEA as a process needs to be balanced... It cannot have too much of detail or too less of detail for analysis as too much can cause a lot of effort and time consumption and too little will not give enough o relevant output. Apart from the above the most conspicuous limitation that most of the practitioners attribute to the FMEA is the more than due bias towards severity during the calculation of RPN. It is a must that FMEA is done by an able team with expertise in subject matter.
-
Rajesh Chakrabarty replied to Vishwadeep Khatri's topic in We ask and you answer! The best answer wins!Customer Relationship Management (CRM) can be related or associated to the strategies, Technologies and Practices that organisations use to accumulate and manage and analyse the interactions with customers. Most of the times, the whole approach is based on a software which allow the organization to retain and maintain data about all transactions done. The biggest benefit is that customers can be determined as unique identities through identities like Name, phone number and various other identification objects ideally known as User ID (UID). The softwares provide the option of accumulating data of all unique customer’s interactional data throughout the lifecycle of the Customer with the organisation!! Given the competitive market , The organisation which can be in touch and sync with it’s customer has an upper edge. The data thus accumulated through the CRM helps the organisation to : - Improve Business relationship with the Customer - Retain Customers - Improve Business Operations and Thereby Impact Business Growth Efficient CRM Systems ate capable of compiling relevant information about customers , like personal information, Purchase History, Buying Preference, concerns, feedback etc, across different Business Channels or Point of contacts between the customer and the organisation The most common channels or customer touch points, in current times are - Company Website - Company Mobile application - Social media like Facebook & Twitter - Contact center , live Chats - Direct mailers (Somewhat out of vogue in many industries) The benefit of a good CRM system is that – - It provides convenience to the organisation to align required data , as the software consolidates and documents the relevant information into a single CRM database. - It Records various customer interaction across all channels and provides as an output easily accessible MIS or reports – this enables managers to track performance and productivity of many workflow processes, Thus providing inputs for business Excellence. Let us look at some effective applications of CRM Softwares: Marketing Automation: Automated Marketing propagation , Lead generators, Lead covertors Sales Force Automation: With GPS technology, tracking of location is possible which helps in proper territory mapping , internal Touch points, Work Closure mapping(Contacts and Follow ups included), which helps to avoid duplication of work and also measure and analyse productivity. Contact center Automation : Helps to make the process easy and convenient for the Agents/ Phone handlers at the Center. There are Softwares that help to track the complete lead time of a request and facilitates reminders for follow ups – All automated and accurate!! Example: I know of a QSR which tracks it’s Customer Buying habits in individual outlets: At a macro level , one of the analysis that the CRM provide is in a 4 cell Matrix of all the orders done in the outlet on regular intervals High Frequency Low Bill value High Frequency high Bill Value Low frequency Low bill value Low Frequency High Bill Value ** LSL & HSL of bill value is defined ** Customers have UID (Mobile phone numbers) ** LSL & HSL for frequency of Customer visit/ order is defined. The above set analysis matrix helps the organisation to understand the customer shift in the above table and understand the impact of ongoing promotions on the sales in the outlet. It also helps each outlets to plan local Marketing activities based on the intelligence provided by the matrices. With the internet boom, most of the available CRMs in the market are now hosted on the cloud, thereby facilitating easy access to users across the globe. Nowadays, there are Social CRMs which add value to organization and customers by enabling “ Customer Community” management. Customers can post reviews of service abd products and engage with other customers . These are recent trends and the new developments in technology will surely bring about many more innovations in the CRMs in the near future. Having mentioned all the advantages of an effective CRM, it is of utmost importance that we must also touch the Problems that an CRM can bring about. Without, proper management, inspite of all the technological wonders, a CRM System can become just another useless data dump – All data available should be connected,distributed, organised and Analyzed effectively justify the purpose and capability of an necessary investment- A State of the art CRM system that is designed to meet the needs to execute business excellence in an organisation.
-
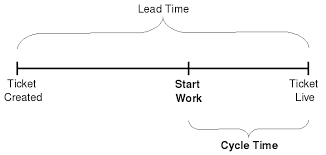
Rajesh Chakrabarty replied to Vishwadeep Khatri's topic in We ask and you answer! The best answer wins!Lead time and Cycle time are important metrics in lean and process improvement . The difference in both is obvious and simple but people tend to misunderstand the concepts and are unable to differentiate between them and use them interchangeably – this is what leads to a confusion in understanding the situation or problem in the process – thus inducing delay or blockages in process improvement. The other reason that causes confusion is also when the process is not defined correctly , ie. The start point and end time are not defined correctly in terms or effort and time – Let us understand in detail- I suppose the major confusion is created by the different definitions that are available for both these metrices , sometimes connoting similarity between both. In General the definitions are: Lead time starts when a request is made and ends when the request is met or confirmed as undo-able. Basically it is the time taken for closure of a request from the moment the request was made. Cycle Time is the time taken from when an activity starts to the time the activity ends. Let’s say a Customer of a QSR Home delivery service has called, at the Customer Grievance center, to place a complaint about a defective product that he has received. As per the policy of the company the , the QSR offers to replace the product within a lime limit of 30 minutes . - The customer has placed the complaint at 8pm in the evening. - The Company acknowledges the complaint instantly and delivers the replacement at 8:30 pm, However the activity of customer grievance resolution has started at 8:15pm , a little while after the call came in. Here, if the complete process of Customer grievance handling is considered as a single process, the lead time is 30 minutes, but the Cycle time is only 15 minutes as that is the time it took as an effort to close the issue. Lead time thus is the time used but not the effort . In the situation above . Thus the lead time could have been 45 minutes as that is what the customer care agent could have committed, but the time taken to actually put effort and close the activity of replacing the product would have taken the same time – 15 minutes as per average time taken to prepare the product and then deliver to the customer. Another Perspective- The point to note here is that there are two activities happening here: The Customer grievance addressed The Product Replacement Started at 8pm Started at 8:15 pm Completed at 8:30 pm Completed at 8:30 pm As per definition As per definition The Cycle time is 30 minutes The Cycle time here is 15 Minutes to The Lead time is also 30 minutes The lead time here is 15 minutes from the moment the customer care agent informed the Outlet So there is a sense of confusion in the single simple example mentioned above- However, There is a better way of looking at the whole scenario which tends to wipe out scope for any confusion- Let us look at the differences between Lead time and Cycle time Lead Time Cycle Time Lead time is measured by Elapsed Time (Minutes, Hour , etc) Cycle time is measured by the amount of time per unit (Minutes/ Product or process step, It is a measure of throughput (Units per Period time) It is a measure of throughput (time per unit) It is more a measured and estimated value It is normally an average value Lead time is what the customer sees as a a resolution time Cycle time is the average time taken per sub activity within the whole process that the customer sees as lead time. From the above example it is safe to state that Lead time and Cycle time are related with the work in Progress (WIP) in the entire process, in a relationship described by Little’s law: Lead Time= Cycle Time*WIP Or, Lead Time= WIP/Throughput The Cycle time above must be the process cycle time, which is determined by the bottleneck . Cycle times of individual steps cannot be used alone to calculate the process lead time without knowing the WIP. Thus lead time is more or less clear – In normal spoken verbatim, when someone asks how long will I have to wait after making a request- He is asking what is the lead time for my request. Cycle time is basically time taken to complete any activity- from start to finish. The confusion is not there when the following diagram is clear in mind.
-
Rajesh Chakrabarty replied to Vishwadeep Khatri's topic in We ask and you answer! The best answer wins!I am in almost complete agreement with the quote by Sir Deming!! As the Principle of uncertainty states “We may significantly modify what we are trying to measure, simply by making an effort to measure it.” What this implies is that the inspections and tests to measure or analyse a process by themselves can actually cause a defect. Thus, practically, the concept of zero defect is surreal!! A Zero Defect Mentality induces a non-tolerance to mistakes and errors. It may lead to reduced motivation, stifled innovation and careerism. Such acerbity can be the cause for roadblocks to business excellence. To avoid the above mentioned risk to business excellence the prudent approach will be to continuously strive for betterment rather than perfection!! Given the assumption that automation is out of question, The option E provided in the question sets the platform for the outlook towards workforce involvement, improvement and goal setting : E. Workforce if engaged in improvement initiatives, can do wonders. While slogans and rigid targets should be avoided, improvements in quality and productivity should still be expected from workforce. Sr# Step Involvement Approach 1 Defining the Process Top management / The process Engineer Top - Down 2 Standardising the process through: - Controlling Process Variation: Identify, Measure & monitor KPIs - Systematic process Improvement programs - Process Optimization - Error Reduction System - Technical Understanding and fault rate recording system - Causes and prevention of process Breakdown - VOC Across the complete value Chain Both Top down and bottom up 3 Hiring for Competency & Skill Development Through - Continuous education and training programs directly related to the needs and interest of the enterprise/ Process - Awareness about Wastages, Productivity, Yields , Quality ,etc - Continuous assessment of existing skill sets in various functions and plans to reduce gaps in existing skill sets Multilevel Cascading training hierarchy- Top down 4 Instil &Implement Best Managerial Practices: - Wastage Management - Product/ Process Risk Analysis - Quality Audit Analysis - Periodic QMS - Early Alert Mechanism for nonconformities/ abnormalities in the process with immediate response for closure - Define SMART objectives and Goals - Process Ownership with KRA graded as per level of percentage against Targets & goals Multilevel Cascading Operational hierarchy Top- down 5 Understanding and acknowledging the Customer’s (Internal as well as External) need and experience through internal and external Surveys At all levels of the Process Both Top down and bottom up 6 Focus on development of a culture which welcomes and appreciates every scope for Improvement Multilevel Cascading management & Operational hierarchy Top Down 7 Reward and Recognise any and all contribution towards better productivity and quality- Reward through promotions of deserving candidates are one of the best way of appreciating good talent and motivating the entire workforce- A healthy , well drafted performance measuring tool is of utmost importance Multilevel Cascading management & Operational hierarchy Top Down The above table is just a collation of steps that will drive the desired “change” that is required in the workforce to bring about the much desired improvement in the process in terms of quality and productivity. The approaches ensure that there is a judicious involvement of the workforce wherever it is beneficial to the enterprise or process.
-
Rajesh Chakrabarty replied to Vishwadeep Khatri's topic in We ask and you answer! The best answer wins!Fishbone Diagram is used to find the possible causes for a problem- Eventually it helps to narrow down to the Root cause for the problem under study, if the analysis is done effectively. This method comes handy especially when the team’s thinking before the session is not aligned and there is a need to get all on the same page- literally!! The facilitator of the session holds the key to the success of the session, As there are chances for the whole exercise going off track and leading to NVA. The Facilitator plays the champion of the purpose of the session and takes it forward like a project with a proper BOSCARD handy and briefs the team before the session starts- He ensures that theer are enough people who are stakeholders of the concerned process and will provide inputs that will provide valuable insights towards the purpose. It helps if there is a judicious distribution of the “Six thinking hats” within the team to provide a logical and valid output at the end of the session. Having said that the Fishbone diagram can be misused as well- There is every chance that the process to draw the fishbone diagram is taken far too “word to word” and the “whys” can be misused or wrongly used. There is every chance that the why can be put forth as an unwelcome question, purely from a human perspective- It can be taken as a confrontation and the answers that come forth can be defensive towards the functions in which a participant is a team member. The purpose of the session is Unclear- The purpose of the whole exercise is not specified before the session and there is no alignment on the “end” of the session- This can lead to out of context approaches and create an ineffective fishbone diagram. Sometimes the causes (inputs) are prompted by the participants who are superior in position and their calls influence the others- This can lead to a complete dilution of the purpose as it discourages consideration and introspection. The biggest misuse of the Fishbone diagram is when it is used in situations where it is not to be used at all- - The Problem is simple and is already known and has been worked upon earlier or for that matter there are already some members who are expert in the the subject matter and can resolve the problem - Utter waste of time. - The team size is too small for brainstorming – The output is limited and the whole activity is not relevant then. - There is time constraint – Immediate closure is required and all or sufficient headcount is not sufficient for the brainstorming - There is a communication gap within the participants- Biggest roadblock to an effective outcome What happens in these situations is that the whole exercise is done just for the sake of doing it- Absolute misuse of the fishbone diagram because the outcome of such sessions – the fishbone diagram , will either not be relevant or will not produce expected results.
-
Rajesh Chakrabarty replied to Vishwadeep Khatri's topic in We ask and you answer! The best answer wins!Root Cause Analysis is a method used to identifying the core reason or cause for any problem or change observed in a Process. The most commonly used method is asking the 5W and 2 H and arriving at the core reason by narrowing down to the start point of the variation or change that has brought about the situation in study away from normal or expected course of process. This method is practical in most of the cases where there is an requirement of immediate fact finding- more so used on “the floor” of operations. Having said that, In any complex business process, identifying root causes of a problem can be challenging as there can be many misleading information. The best way to ensure that the root causes are identified reliably is to design the business processes, with accessible records of all data that is required to find root cause of any change in process outcome. The change said here can be for the bad or good of business- We must also be aware of root causes for changes that have impacted business positively. The best practices to ensure that RCA is convenient are : Map the process: The first step towards creating a mature process is to document the process , so that mapping out any difference between contributing causes and root causes becomes easier. Record all Actions: It is a must to keep track of all time to time business decisions and actions that have been implemented on the process – This aids to identify any internal factors that may have possibly contributed to the change. Keep information of External Factors – Keep all senses active to monitor any external forces which may impact the business process including Competition, Market Trends, Consumer behaviour, Government policy etc. The bigger task here is to identify the most significant factors that can impact the business Segment the available data- It is very important that all the metrics are segmented so that evaluation of the possibility of any of the segments contributing to the change is effectively done. This helps to expedite the elimination of potential factors that may have not contributed to the change. Data Segmentation is the process of dividing the available data and grouping similar data together based on the chosen parameters. The said segments or groups can be used as the first layer of filter to narrow down to the core data point required- The data point we are discussing here is the root cause for a change in the process. The purpose of segmentation in RCA is to group the identified process steps or sub components within the process which are involved in the problem / change creation. Proper segmentation will narrow down the investigation to lesser segments by refuting the irrelevant process steps which are not involved or not influencing the problem/ change under study. Thus, as most of the irrelevant data segments are cut out the segment that is identified as the most probable source of the problem is isolated- This way a lot of time is saved from researching / analysing on each probable cause. Example 1: When turning on a car through the ignition key- The starter spins but the Engine only coughs- There are 2 main suspect segments- the fuel system and the electrical ignition system. each could cause the problem and each contain many sub components. The best way to confront the problem is to understand which of the two segment is causing the issue. Checking whether there is a spark in the cable leading to the spark plugs will verify the functioning of various electrical system. If there is no spark at the end of the cable, it is necessary to continue to isolate the component (Smaller part of the segment) within the electrical system causing the failure- however, if there is a nice spark at the end of the cable one can suspect that the issue lies with the fuel system or in a smaller number of electrical components behind the cable. This was a simple example to understand how segmentation of data is related to RCA Example 2- Further to the note on best practices to identify Root cause above ,Let’s consider a QSR on a high street – The problem is that the daily sales average has dipped considerably since a week’s time , as compared to trends of previous year same period and also as against the daily sales average of previous month. The “sudden” Dip could have been for the following reasons: #1) The neighbourhood competition has reduced their prices– External Factor #2) One of the marketing promotions at the outlet has stopped since a week.- External Factor #3) Cricket Test match on TV has kept the customers hooked on to the live telecast and they remained home and reduced the footfalls across the week- External Factor #4) There is a street repair work that is happening near the outlet- External Factor #5) There are 3 new employees on the front counter where customer orders are taken- Internal Factor #6) This week is examination time in the neighbouring schools and colleges- External Factor #7) Some of the popular products were out of stock- Internal Factor We have identified only 7 contributing factors to create the environment, but let us assume that there are many more such contributing factors- but not all of them could be the root cause. In the QSR Industry the 5 Ps play a big role in the business plan of the outlet namely: Place, Product, People , Price & Promotion. If we try to assign the above contributors and their data based on the period of sales dip , into the 5 segments, and study the impact of sales drop from each group- we will be able to close down on the root cause as the group (segment) that contributes to maximum sales dip (Lost Opportunity)can be then isolated and further investigation can be done to hit the root cause , so from the above list of 7 contributors – #1 is in the segment Price, #2 & #3 is in the segment Promotion #4  is in the segment Place #5 is in segment People #7 is in the segment Product The impact of the Product group was seen to be the highest as though the other contributors did bring in drop in the footfalls – It is obvious that the same was an overall experience across the trading area. But the fact that we could not sell the popular products to even the people who did visit the outlet and missed out on opportunity , was the root cause of Sales loss- All the stakeholders in the organization who are responsible for product supply will then need to understand what was the reason for the unavailability of products and take corrective and preventive action. Thus the Segmentation in the above example helped to narrow down on the group which had an internal factor and is within the control of the organization. In conclusion, it can be stated that the advantage of segmentation is that by targeting the right segment, the exercise of RCA becomes faster and more effective.
