
Topics
-
Fifty-five women engineering students completed an AI bootcamp focused on rural Karnataka. Participants developed AI-based solutions after visiting villages and conducting field interviews. The She Innovates bootcamp partnered with several organizations to achieve its goals. This initiative aims to boost women's participation in AI and entrepreneurship. It encourages AI applications for rural development and community-focused sectors. View the full article
-
Besi's quarterly orders more than doubled, fueled by AI and hybrid bonding technology. The company saw increased customer adoption of its advanced chip packaging solutions. Demand for AI applications continues to drive growth in data centers. Besi anticipates revenue growth between ten and fifteen percent. This strong performance aligns with other semiconductor sector reports. View the full article


Leaderboard
-
Gitarchana Roy
Members1Points12Posts -
Moushmi Kandori
Members1Points11Posts


Popular Content
Showing content with the highest reputation on 05/19/2023 in all areas
-
1 pointLinear Regression Nonlinear Regression Represents relationship between variables with a straight line Represents relationship between variables with a curved line Example: Defects vs. Rework Example: Growth of Business i.e., Revenue with employee strength Form of linear model is typically either the constant or a parameter multiplied by an independent variable. Simple Addition. Rational function which is the ratio of 2 polynomial functions. R-squared value is valid R-squared value is invalid Might not capture true relationships if they are complex. Explains complex relationships Data set must be homogeneous. Might be overlooked while creating models. Better fit and prediction accuracy Easy to understand. Difficult to interpret and comprehend results. Governing Criteria: If better model fit is essential, then nonlinear regression should be selected. If simple, easy to understand models need to be created then Linear models should be created. If prediction accuracy is important, then Nonlinear regression should be selected.1 point
-
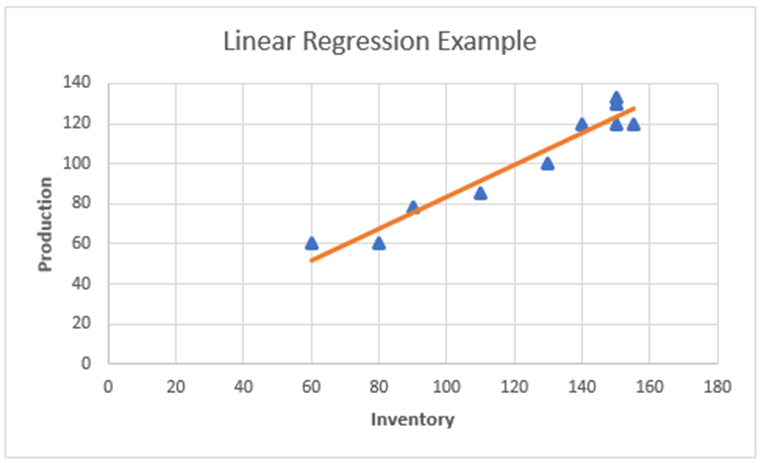
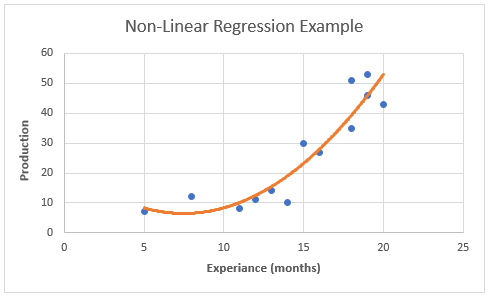
1 pointRegression - A statistical method called regression links a dependent variable to one or more independent variables. It allows for the discovery of data trends. The method examines the relationship between a dependent variable and independent factors, and it is typically expressed as a graph. You can confidently establish which elements are most important, which ones can be ignored, and how these factors interact when you do a regression. Regression analysis can assist you quantify your assumptions, for instance, that there is a relationship between the quantity of inventory received and the quantity of production. Types of Regression – We have multiple types of regression models, and Linear Regression is one among them. Linear Regression: A dependent variable (y) and an independent variable (x) are related in a linear regression model. Finding the correlation between dependent and independent variables is done statistically. Since the relationship between the two variables in a linear regression is one of a straight line, the term "linear regression" was coined. One of the most prevalent kinds of predictive analysis is this one. It uses a regression graph to examine the strength of the link between two variables. It chooses the data set's nearest points that correspond to a linear pattern. It is used in situations where a change in the value of a second variable has a considerable impact on the variance in the value of a first variable. The linear equation for linear regression is always Y = a + bx, where x is the explanatory variable and Y denotes the dependent variable. Subtypes - Simple and multiple regression are the two subtypes into which they are divided. Simple Linear Regression: A straight line is used to evaluate the connection between one independent variable and one dependent variable in a simple linear regression model. Both variables ought to have numerical values. Multiple linear regression is a type of regression analysis where the variation in two or more correlated independent variables affects the change in the dependent variable. Refer to the example of linear regression below, which illustrates the link between production and various inventories (independent variable on x-axis, dependent variable on y-axis). Interpretation: From the above graph of regression, we can see there is a linear relationship between inventory and production numbers. As inventory increases, production numbers also increase. Thus, using this regression analysis, we can predict the value of the dependent variable (production i.e., ‘y’) based on the value of the independent variable (inventory i.e., ‘x’). Advantages and Disadvantages of Linear Regression: Benefits Challenges It is simpler to implement and interpret linear regression. As boundaries in this method are linear, outliers might have a significant impact on the regression. For data that can be separated linearly, linear regression works remarkably well. It can be difficult to satisfy the assumption that dependent and independent variables are linear. Easier to use, understand, and effectively train It is quite often prone to noise Using dimensionally reduced approaches, regularisation, and cross-validation, it manages overfitting rather well The sensitivity of linear regression to outliers is high. The ability to extrapolate beyond a particular data set is a further benefit It is prone to multicollinearity Non-Liner Regression: Regression analysis that depicts a nonlinear relationship between dependent and independent variables is referred to as non-linear regression. When using linear parameters, it is employed when the relationship cannot be accurately modelled. In contrast to linear analysis, nonlinear regression uses a curve to link the variables. In statistics, the word "nonlinearity" is used to describe a scenario in which an independent variable and a dependent variable do not have a straight-line or direct relationship. Changes in the output are not directly proportional to changes in any of the inputs in a nonlinear connection. When predictors and responses have a certain function form, non-linear regression arises. Y=f (X, β) + ϵ, where X is a vector of p predictors, is a vector of k parameters, f() is a recognised regression function, and is an error term with a potentially non-normal distribution. View the example below to see how the dependent (y-axis) and independent variable (x-axis) are related nonlinearly. Interpretation: From the above graph of regression, we can see there is a non-liner relationship exists between the variables in x and y axis. As per the scatter plot of changing production count over months of employee experience shows that there seems to be a relationship but that it is non-linear relationship which requires to use of a non-linear regression model to predict the data. Advantages and Disadvantages of Non-Linear Regression: Benefits Challenges The functionality for curve-fitting that is most flexible is offered by nonlinear regression. Selecting the nonlinear function that produces the best fit for a specific curve shape can be very time-consuming. Additionally, it can show oblique or nonlinear connections between variables. Since nonlinear models can have several local minima and maxima, it can be challenging to determine the ideal parameters and function for the data. In the data, nonlinear regression can detect more intricate patterns and behaviours. When a model is too complicated for the data, overfitting can happen, leading to poor generalisation abilities. It can also be applied to jobs involving forecasting, such as predicting future inventory based on current. However, fitting a nonlinear model might require more computation and requires careful model parameter selection to prevent overfitting. Most real-life phenomena typically involve nonlinear regression Nonlinear models typically describe observable relationships more accurately, but at the cost of added complexity. Governing criteria: The following factors should be taken into consideration when selecting non-linear regression: • Prioritise linear regression - Use linear regression first to see if it would fit the specific sort of curve in the data set. We must use nonlinear regression if satisfactory fit cannot be obtained using linear regression. • R-Squared - Non-Linear regression cannot yield a reliable R-Squared value. • P-Value - Non-Linear regression makes it impossible to calculate P-Value. • Goal - To verify that the data fits a model and acquire the best-fit values for the parameters, or to compare the fits of other models, we must carefully choose a model (or two alternative models). We should also pay attention to all the outcomes.
 1 point
This leaderboard is set to Kolkata/GMT+05:30