
Topics
-
The latest setback has fueled worries that Google was losing momentum just as OpenAI and Anthropic and a host of Chinese rivals have accelerated the pace of model releases. On the call on Wednesday, Pichai struck an unusually defensive tone as analysts pressed him on the state of Google's frontier models and whether they could still compete at the cutting edge of AI development. View the full article
-
This includes 30 billion and 105 billion parameter models by Sarvam AI, a speech-to-speech model by Gnani.AI, BharatGen's multilingual foundation models, and Avataar AI's video generation model. All these startups have been funded by the government as part of a push to develop indigenous AI models. Of the 20 models, five have been released so far. View the full article


Leaderboard
-
Mayank Gupta
Members2Points679Posts -
Kaviraj
Members2Points10Posts -
Shraddha Sequiera
Lean Six Sigma Black Belt1Points10Posts -
Chandra Shekhar Chauhan
Members1Points11Posts


Popular Content
Showing content with the highest reputation on 06/22/2022 in Posts
-
2 pointsAll published answers have explained the two tools correctly. Best answer has been provided by Kaviraj for using the same data set and comparing the two tools. Answers from Rahul Arora and Chandra Shekhar Chauhan are also a must read.2 points
-
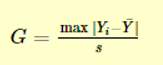
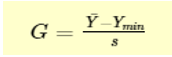
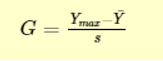
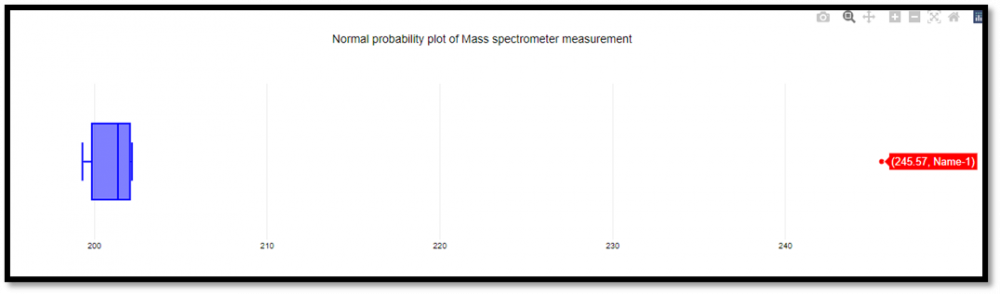
2 pointsGrubbs test is a statistical method used to find the outlier in the data range. Also, this test is used to find a single outlier in a normally distributed data set. This test is used to find if the maximum or the minimum value is an outlier in the given data range. Definition - Hypothesis of Grubbs test: Ho - There are no outliers in the given data set Ha - There is only one outlier in the given data set Test Statistic for the Grubbs' test - Y¯ represents sample mean and s represents standard deviation, the Grubbs test statistic is the largest absolute deviation from the sample mean in units of the given sample’s standard deviation. This is a 2-sided version of the test, the Grubbs test can also be defined as one of the following one-sided tests, 1. Test whether the minimum value is an outlier, 2. Test whether the maximum value is an outlier, Grubbs Test Example: Range given - 199.31, 199.53, 200.19, 200.82, 201.92, 201.95, 202.18, 245.57 Firstly a normal probability plot was generated, This plot indicates that the normality assumption is reasonable except for the maximum value. We, therefore, compute the Grubbs test for the given case to find whether the maximum value of 245.57, is an outlier or not. Test Results, H0: there are no outliers in the data Ha: the maximum value is an outlier Test statistic: G = 2.4687 Significance level: α = 0.05 Critical value for an upper one-tailed test: 2.032 Critical region: Reject H0 if G > 2.032 Hence we conclude that the maximum value is in fact an outlier at 0.05 significance level. Boxplots are used to graphically display different parameters briefly. Among other things, the median, the interquartile range, and the outliers can be read in a boxplot. The data used must have a metric scale level. Such as a person's age, electricity consumption, or temperature. How to interpret the boxplot? The box indicates the range in which the middle 50% of all values lie. Therefore, the lower end of the box is the 1st quartile, and the upper end is considered the 3rd quartile. Below q1 lies 25% of the data, and above q3 lie 25% of the data. In the boxplot, the solid line represents the median whereas the dashed line represents the mean. The T-shaped whiskers in the boxplot are the last part, which is within 1.5 times the interquartile range. This means, that the T-shaped whisker is the maximum value of your data but at most 1.5 times the interquartile range. Therefore, if there is an outlier, then the whisker goes up to 1.5 times the interquartile range. If there is no outlier present in the data, then the whisker is the maximum value. Hence, the upper whisker is either the maximum value or 1.5 times the interquartile range. Depending on which value is smaller. The same applies to the lower whisker as well, which is either the minimum or 1.5 times the interquartile range. Points that are further away are considered outliers. If no point is further away than 1.5 times the interquartile range, the T-shaped whisker thus gives the maximum or minimum value. Box Plot Example: Range - 199.31, 199.53, 200.19, 200.82, 201.92, 201.95, 202.18, 245.57 From the above example it’s graphically visible that the data value of 245.57 is not falling within 1.5 times the interquartile, hence it’s an outlier. Conclusion – I would prefer a box plot to find the outliers in normally distributed data range, since its less complex and easy to easy to understand because of its graphical representation. Thanks.


 2 points
 -
1 pointGrubbs Test is being used to detect outliers in a univariate data set (data of one variable) assumed to come from a normal distribution population. Grubbs test is based on the assumptions of normality. First we should verify that the data can be reasonably follow the normal distribution before applying the Grubbs test. Grubbs test detect one outlier at a time. We need to Calculate the G Calculated value by using below formula; GCalc = I Xi- x Bar I / SD, Xi , X Bar and SD denoting the questionable value, sample mean and standard deviation. The Grubbs test statistic is the largest absolute deviation from the sample mean in units of the sample standard deviation. Based on No of sample in data set, we can get the G Table value. For example n=4 G tab= 1.463 and n=5 G tab= 1.672 at 95% confidence. If G calc > G tab, then outlier should be rejected; if G calc < G table, then outlier should be kept. Example: Data 5, 10, 9.5, 9.8, 9.9 Let say questionable value is 5. X Bar= (5+10+9.5+9.8+9.9) / 5 = 8.84 SD = Root [(5-8.84)2+(10-8.84)2+(9.5-8.84)2+(9.8-8.84)2+(9.9-8.84)2] / 5-1 = 2.155 GCalc = I Xi- x Bar I / SD = I 5- 8.84 I / 2.155 = 1.782 ~ 1.80 G tab for n=5 is 1.672 Here G Calc > G tab; therefore outlier should be rejected. Box Plot Box plot is a method for graphically demonstrating the locality, spread and skewness groups of numerical data through their quartiles. In addition to the box on box plot, there can be lines extending from the box indicating variability outside the upper and lower quartiles. Outliers that differ significantly from the rest of the data set may be plotted as individual points beyond the whiskers on the box plot. Box plots are non-parametric; they display variation in samples of a statistical population without making any assumptions of the underlying statistical distribution. The spacings in each subsection of the box plot indicate the degree of dispersion and skewness of the data, which are usually described using the five number summary- sample minimum, lower quartile, median, upper quartile, sample maximum. In addition, the box-plot allows one to visually estimate various estimators notably the interquartile range, midhinge, range, mid-range and trimean. Box plots can be drawn either horizontally or vertically. Example: Data 60, 82, 82, 84, 88, 90, 90, 92, 93, 97 Sample minimum range - 60 Median= (88+90)/2= 89 Lower Quartile Q1= median of lower values = 82 Upper quartile Q3= median of upper values = 92 IQR = Q3-Q1= 92-82=10 Sample maximum= 97 Upper range = Q3+1.5 IQR = 92+1.5 x10 = 92+15= 107 Lower Range = Q1-1.5 IQR = 82-1.5 x10 = 82-15= 67 (Refer below Box-plot for this example; which has been made free hand) Generally we prefer the Box plot to identify the outliers for any statistical data set whenever Grubbs test could be used for univariable data set with normal distribution population. A box plot is a standardized way of displaying the dataset based on the five number summary like the minimum, the maximum, the sample median and the first and third quartiles.
 1 point
 -
1 pointGrubbs' test is used to detect a single outlier in a univariate data which follows a normal distribution. If you suspect more than one outlier may be present, this test may not be helpful. It considers the min and max value when detecting an outlier. Grubbs test can be used to detect if the max or min data is an outlier. As a part of analysis, it is important to check the outliers as this may impact the mean and standard deviation. An outlier should be detected and corrected however Grubs test may not be a robust technique to determine an outlier. Box plot instead can be used a excellent tool for detecting location and variation in a data set. It helps in identifying the middle 50% of the data, Lower quartile (25th Percentile) and upper quartile (75th percentile). Hence it help identify the median and extreme points(outliers). A box plot help u in comparison between various data sets and identifies the significant factor. It will help you read the location and variation between different groups and identify variation. Multiple data sets can be compared hence it helps you work with large data sets.1 point
-
1 pointOutliers in a dataset are basically the data points whose magnitude is significantly different from other data points in that dataset. Outliers signifies either error while keying in data or they signify presence of special cause. The most common method for identifying outliers is through Box plot however we can also leverage Grubbs Test to detect the same, but there is a marked difference in both the methodologies. Let us understand both these one be one:- Grubs Test:- It is one of the most commonly used hypothesis test for identifying outliers & it comes with the below hypothesis:- Ho: All the data points in a sample are drawn from a single population that follows a normal distribution Ha: One data point is not drawn from the same normally distributed population as other data points Thus a p-value of less than 0.05 indicates the presence of an outlier in the data. One of the biggest limitation of Grubbs test is that it assumes that the data is drawn from a normally distributed population, thus we have to first check whether the data qualifies the normality test. If the data fails the normality test then we cannot use Grubb’s test. Another limitation associated with Grubb’s test is that it only detects a single outlier at a time, thus requiring the outlier to be removed from the data set first & then again running multiple iterations of the test until no outliers are detected in the data. Box Plot:- Box-Plot is the commonly used graphical technique to detect outliers in a dataset. The outliers are based leverages Interquartile Range(IQR) with fences in order to identify outliers. Lower Fence : Q1 - 1.5*IQR Upper Fence : Q3 + 1.5*IQR Thus any value below the lower fence or above the upper fence will be considered as an outlier. The box-plot shows outliers as datapoints in the form of asterisk. Box plot is a more robust method to detect outliers as it is not driven by the assumption of normality & once can also detect multiple outliers in the data in a single iteration itself. Conclusion:- The best blend would be to use box plot coupled with domain expertise to identify & treat the outliers in a data.1 point


This leaderboard is set to Kolkata/GMT+05:30