
Topics
-
Fifty-five women engineering students completed an AI bootcamp focused on rural Karnataka. Participants developed AI-based solutions after visiting villages and conducting field interviews. The She Innovates bootcamp partnered with several organizations to achieve its goals. This initiative aims to boost women's participation in AI and entrepreneurship. It encourages AI applications for rural development and community-focused sectors. View the full article
-
Besi's quarterly orders more than doubled, fueled by AI and hybrid bonding technology. The company saw increased customer adoption of its advanced chip packaging solutions. Demand for AI applications continues to drive growth in data centers. Besi anticipates revenue growth between ten and fifteen percent. This strong performance aligns with other semiconductor sector reports. View the full article


Leaderboard
-
Mohamed Asif Abdul Hameed
Fraternity Members1Points78Posts -
Mayank Gupta
Members1Points679Posts


Popular Content
Showing content with the highest reputation on 08/26/2020 in Posts
-
Hello Kishan Some guidelines 1. Objective is to improve the process timelines - Lean 2. Objective is to reduce the number of defects or improve quality - Six Sigma 3. Project is best suited for Lean Six Sigma approach if the cause and solution are unknown. If any or both of these are known, it is suitable for Kaizen 4. Relatively smaller improvements - Kaizen Apply the above filters and then use a project selection criteria to select one project from the many potential projects.1 point
-
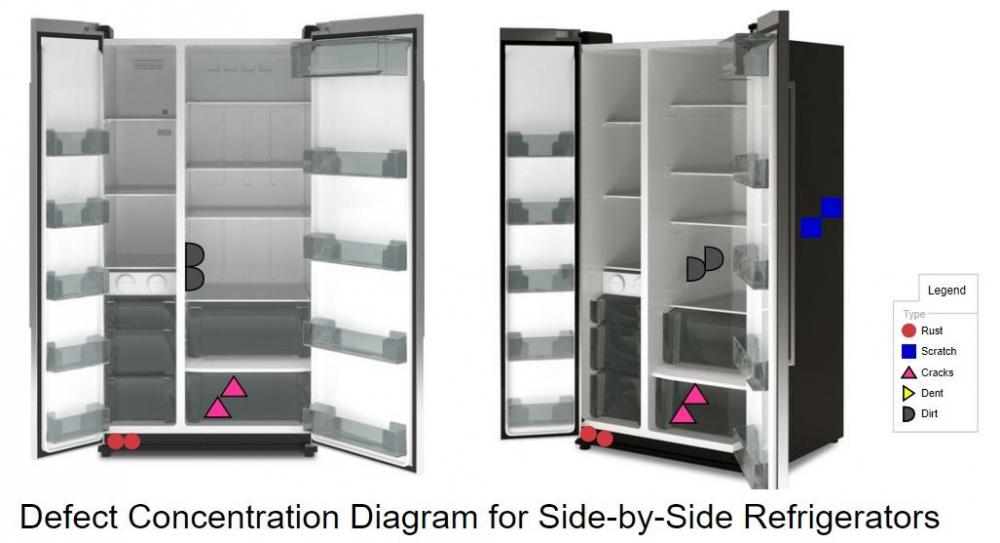
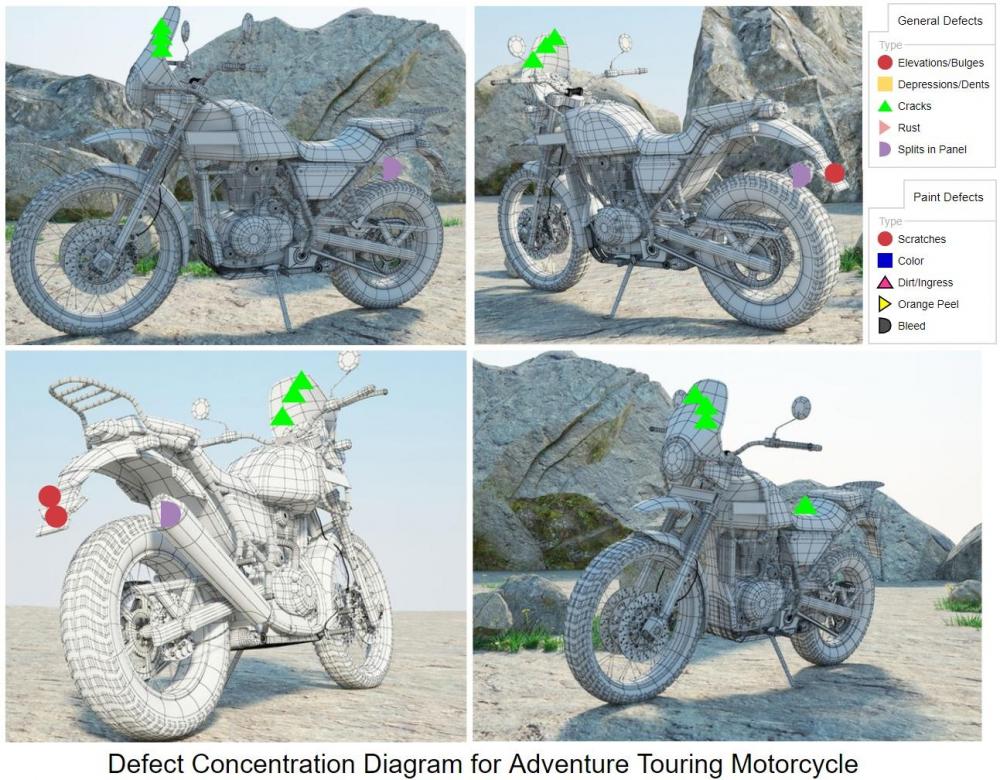
1 pointDefect Concentration Diagram / Problem Concentration Diagram is one of the "Magnificent Seven" SPC tools. It is also referred as Location Plot or Defect Location Check Sheet. Defect Concentration Diagram is a graphical tool that is used in analyzing the causes of the unit defects. It can be used and applied to any process, it shows the picture of the unit/product (or item of interest) and associated defects in the unit, in all relevant views. Location and frequencies of various defects are clearly given in visuals. Defect data segregated based on location. The diagram is further analyzed to determine if the defect location of the unit provides any useful information about the potential causes of the defects. This is repeated with enough sampling of units, to study patterns of defect and to set the focus area of improvement. It is widely used during, Problem identification (data collection phase) When analyzing a part for potential defects When a part has multiple defects when problems arise after purchase of parts Defects to a large outspread affects shipping decisions and Defect classification is a vital step associated with Inspection. Based on the severity of the defect, it is usually classified as Minor, Major and Critical. Minor Defects - Don’t affect the function/form of the item Major defects - Affect the function, performance or appearance of a product Critical defects - Unusable and/or could cause harm to the user Analysis Actionable: Based on the study, it would help the product manufacture to make decisions like Asking supplier to correct quality issues – Ask for replacement of the supplied item Re-inspect – ensuring to correct the defects Callback products – Keeps customer safe Chargeback suppliers - Re-inspection and Re-work cost Destroy unusable goods - prevent defective goods getting into grey market It help to a great extend in product improvement for example, A smartphone manufacturer can analyze defect concentration diagram of unusable/defective smartphone which the customer returned during warranty to study the type, frequency, severity and also the pattern of the defects to strengthen and improve the smartphone in the subsequent release. Recent Advancement: Usually inspection is performed manually by human and it could be sometimes unstable and insufficient. Surface defects, such as scratches, cracks and dents are common during manufacturing process. Defect identification methods have improved a lot in recent times. One such improvement is Automatic Surface Defect Inspection System for Automobiles Using 3D Machine Vision Methods with integrated software’s which gives Defect Concentration Diagram in multi dimension. To reduce the number of Rejects, it is necessary to know not only the percentage but also the location and the types of defects. Defect Concentration Diagram is a great tool to locate the type, frequency, location and the pattern of the occurring defect.

 1 point


This leaderboard is set to Kolkata/GMT+05:30