NagarajKailas
Members
-
Joined
-
Last visited
Everything posted by NagarajKailas
-
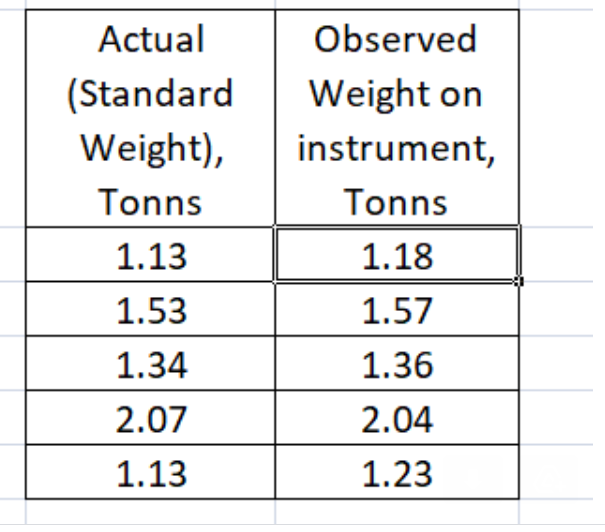
the regression eqn is The regression equation is observed = - 0.2340 + 1.128 actual
-
Sir While checking an instrument the following is the observation Now with this instrument a load is checked and the instrument measured 30.800 Tonns How can I now estimate the actual weight measured. Pls suggestHypothesis testing: It is a statistical tool that evaluates two mutually exclusive statements about a population. The Hypothesis testing uses the sampled data to determine which statement is the best supported by the sampled data. the two mutually exclusive statements being the Null Hypothesis (Ho) and the Alternate Hypothesis (Ha) Situations where Hypothesis testing can be deployed are Is the mean height of boys greater than the mean height of the girls in the same age group Are male and female graduates with the similar competency and experience earning equally in diverse fields and so on . However, there is a likely chance that the hypothesis testing is not practiced by the eligible six sigma professionals. it could be due to the reasons as listed below 1. The Organization culture: There could be organizations which run on unstructured methodologies, this is likley in proprietory type of organizations where in the authorities in the organization are less confident on the employees, or do not want to risk the six sigma professionals job wherein the jobs are less secure and providing replacements are tedious tasks. 2. Lack of support from Higher reporting authorities: When the higher authorities lack the wisdom to rely on the statistical techniques owing to incompetency. 3. Time constraints: It is very likely that the project timelines are not met and that further time to analyse the data is felt as time eating exercise. 4. Lack of trust on the competency of the six sigma professional: When the higher authorities sense a fear in the misinterpretation of data by the six sigma professionals then they take a call on their past experience and make unfactual decisions. 5. No testimony of previous records of continual improvements due to continual attrition of employees and frequent replacements.The Industry guidelines provide the insights whether a process is capable or not. The general accpetable Minimum value for Cp is 1.33 and for the given data the Cp is 1.33, this is an indication of how the process could perform relative to the specification limits (USL and LSL). In the given case study the Cp is 1.33 & Cpk is 1.11. This Cp relates to the process spread. it is a normally distributed population, 99.73% of the variation is within the + 3 std deviations of the process average. The Cp compares the specification width to the Process Width and is the capability the process could acheive. the Cpk value 1.11 infers both the process spread and the process mean, Cpk cosiders the location of the Process mean and as Cp is > Cpk it infers that the process is not centered and it is recommended to reduce the variation in the process.Firstly, I would acknowledge and thank for the opportunity provided and recommend the following 1. Mark the 7 forms of waste, 2. Prepare and look into the flow chart of the processes in the organization 3. Identify the processes in which there is the 7 forms of waste / identify the potential chance for the occurrence of the 7 forms of waste 4. Prepare a RPN score RPN = Severity*occurrence*detection, to identify the failures 5. Identify the prioritized failures and make a list of potential projects 6. Identify the project and do financial benefit analysis and make it the project 7. Identify the causes for the occurrence of the identified waste 8. Arrrive at the corrective actions, implement the corrective actions 9. Verify the effectiveness of the actions 10. Measure the waste reduction, if reduction is not appreaciable repeat the steps 7,8,9 11. If the results are appreciable go back to step 5 and take up the next projects and repeat the steps 6 to 10hye in a day production histogram data i could find this p value < 0.005. what does it mean?How de we measure the product reliability, in a manufacture line with capacity of 10,000 panels of different capacity?Hye One of the most common questions I ve been facing is why is the Quality Assurance function held responsible for the QMS, EMS implementation and why the QMS , EMS implementation is a part of the QA Job? Pls throw some light on this fuzzy regions