

Mohamed Asif Abdul Hameed
Fraternity Members
-
Joined
-
Last visited
Everything posted by Mohamed Asif Abdul Hameed
-
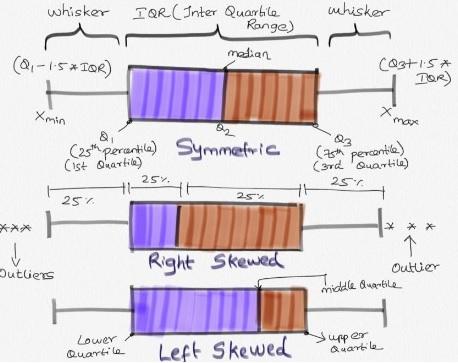
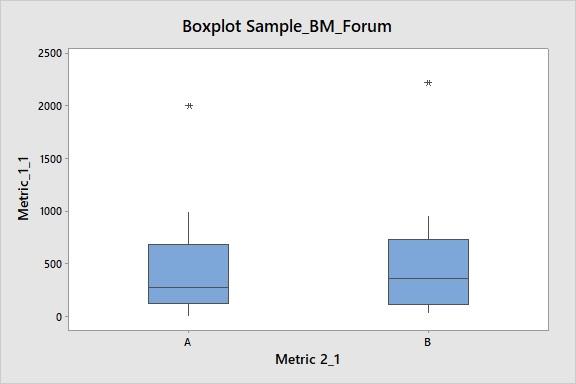
Mohamed Asif Abdul Hameed replied to Vishwadeep Khatri's topic in We ask and you answer! The best answer wins!Box plot (box and whisker plot): This analysis creates visual representation of the range and distribution of Quantitative data (continuous data). It creates 4 Quartile groups. Quartile Group 1: Min - 25th Percentile (Q1) Quartile Group 2: 25th Percentile (Q1) - 50th Percentile (Q2, Median) Quartile Group 3: 50th Percentile (Q2) - 75th Percentile (Q3) Quartile Group 4: 75th Percentile (Q3) - Max In this, Q3-Q1 is Inter Quartile Range (IQR) Insights from Box-plot: Comparing multiple data sets (Categorical variable for grouping (1-4); Understanding Data Symmetry and Skewness * It gives spread of data points. Lowest(min) and highest(max) value in the data set. * It shows outliers (if any) present in the data. Outliers are values which is greater than 1.5 times of IQR away from 25th percentile or 75th percentile. * It clearly shows if the distribution is skewed (left or right. Refer to enclosed pic) * Median: This separates lower 50% of observations from the upper 50% of observations. * Box plot with groups, when we have further categories, we can use ‘categorical variables for grouping’, this helps us to identifying further distribution spread among the groups. Example Reference: This example is for Box Plot Graph with Groups. Group A and Group B Respectively. In this, it is clearly evident that there are outliers in both the graph. Group A is right Skewed. We will have more clarity on the distribution of data in both groups by visual representation.
-
Mohamed Asif Abdul Hameed replied to Vishwadeep Khatri's topic in We ask and you answer! The best answer wins!Major difference between DFMEA and PFMEA: DFMEA (Design Failure Mode Effect Analysis) detects potential failure modes with regards to a Product or a Service. Whereas, PFMEA (Process Failure Mode Effect Analysis) detects potential failure modes with regards to a Process (usually Manufacturing and Assembly processes). DFMEA - Emphasis on Product Function PFMEA - Emphasis on Process Input Variable Another major difference would be in DFMEA, it is used to detect potential deficiencies in Products/Services before they are being released to production. Preferably In PFMEA, needs to be performed before starting with new process. However, most of the time it is used for analysing deficiencies in existing processes. Irrespective of the difference, similar kind of steps is followed in both DFMEA and PFMEA. Mostly DFMEA is seen from a perspective of identifying deficiencies on Product life or from an Product malfunction view on the contrary PFMEA is seen from a perspective of identifying deficiencies on Product Quality or from improving reliability of the Process standpoint. In a typical Product Manufacturing Flow, DFMEA activity is performed before PFMEA. I would like to explain this with an example in Software and Manufacturing sector. [Refer Enclosed Image] PFMEA is developed to ensure effective process control and any abnormality/feedback is sent back to DFMEA for effective design changes (if any) for optimized flow and if it is effectively used, it can result in good improvement in Quality, Cost, Delivery and Reliability. Proactive design changes which will prevent process/product failure which can go as a feedback from PFMEA to DFMEA

-
Mohamed Asif Abdul Hameed replied to Vishwadeep Khatri's topic in We ask and you answer! The best answer wins!Thanks for creating this guide. It gives us direction to find the appropriate test to be performed. Enhancement that I would like to recommend is a) To include what the referred test compares, and b) To include navigation path (Mostly we use Minitab for the analysis) For Instance, for the criteria: Dependent variable being Continuous and Independent variable being Discrete, more than 2 categories, with sample size less than 10. The Result could be: Hypothesis Test to use Kruskal Wallis or Mood's Median Test Basis the information provided, it is the best suited hypothesis test This test compares medians of Multiple Groups. Minitab Navigation: Stat > Nonparametric > Kruskal-Wallis..

