Asangi
Members
-
Joined
-
Last visited
-
Can AI Influence the Culture of an Organization? Positive Influences Greater Transparency AI Dashboards (Quality trends, Machine down time, Defect Pareto analysis, Defect causes and WIP levels)Make visible to everybody. This will lead teams to get decisions solely depend on data and facts. Accountability When AI tracks real-time production performance, bottlenecks, or defect patterns, teams can clearly see which processes need attention. This reduces blame culture and shifts focus to process accountability rather than individual mistakes. Continuous learning & Skill Development Root causes can be identified (Defect Analysis) faster. Employees will learn quickly and also will build up a Data driven decision making environment . AI Reduces manual work and employees will have more time with root cause analysis, Kaizen activities and for more continuous improvement projects Negative Influence If employees will not understand the AI model and if they don't know to analyze data It can create a confusion or mistrust Production team might trying to fail the implementation due to fear of job losses. if employees stopped think critically and might depend solely on AI system will weaken employees analytical skills If AI flags performance issues incorrectly, it may appear that certain teams are underperforming, creating unfair perceptions and tension . How to ensure AI strengthen culture.... Make AI visible Use AI to support people not to Replace them Provide trainings on How AI works/How to interpret AI dashbord Allow teams to test AI tools, fail fast, learn fast. keep humans responsible .let them take critical actions. Use AI data to improve process With the right leadership approach, AI becomes a supporting continuous improvement, learning, and innovation.
-
When Should an AI System Be Retired or Replaced? An AI life cycle scenario is describes how an AI System is developed, deployed, used, maintained, and eventually retired or replaced over time in a real business process. Just like a product or a machine, AI systems also have a life cycle — from birth (development) to end of life (retirement). Indicators for the replaced or retirement 1.Outdated Data Over the time the data set used to train the AI model might not represent the current product mix ,machine changes, style changes and labor performance. It will not identified new product changes .and AI system will be new to the system .The dataset used for training no longer represents and new product range cannot be integrated with model. 2.Data Accuracy AI is initially trained to identify defect in limited range .but Over time, the AI model’s accuracy drops — false negatives increase as new fabric types, dye shades, or patterns are introduced. When such errors comes it will be aa problem to quality control decisions and customer satisfaction. This indicates AI should be redesigned or replaced. 3.High Maintenance cost Maintenance cost will be high over the period .sometimes buying a replacement will be more cost effective 4.Business Goals change Goals might changed over the period .if its designed for specifically to detect defect for woven fabric so now the problem is for some other fabric type so it wont give better results . 5.Tecnolgy advancement if new machines has inbuilt defect sensors ,might no need AI system to detect fabric defcts.so AI add no more value to that .This is where retirement of AI is indicating so to ensure smooth transition we required a risk control Plan. Parelle run Phase To identify gaps, deploy the new AI mode in shadow mode Knowledge retention. Document the old system logics, reports and findings specially false negative and false positive patter Operator training Conduct hands-on sessions for quality teams and maintenance engineers to understand how the new AI model behaves and how to interpret its dashboard. Governance and Monitoring Define new KPI and need to create a monitoring power BI dashboard for continuous learning. set Reviews to asses post deployment Stability apparel industry evolve very fast so the AI model implemented to identify fabric defects models accuracy ,relevance and cost effective factors can be declined over the time so evaluating performance with new AI technologies and plan for a replacement while marinating smooth production flow is very important.
-
How Should AI Be Monitored After Deployment? In manufacturing or any other industry deploying AI is not a end of innovation. Its a beginning of continues evaluation. Even the most accurate AI models drift in long-term due to changes in material ,workforce behavior and machine. There fore post deployment monitoring is important to maintain the system reliable and ethical. Lets consider a practical example from .Ai to predict daily production capacity in apparel industry How to monitor after deployment 1)First we need to check the accuracy of the prediction Compare forecast out put and daily actual production Track MAPE-Mean Absolute % error Alert if deviation is >10% 2)Monitor Business Impact KPI Monitor Line efficiency Rate, OTD and Overtime cost Use before-and-after control charts to ensure that improvements achieved after AI implementation are sustained. Drill down these KPIs to all layers — from management to line-level teams — to ensure alignment and ownership across the organization. 3)Monitor for Changes Identify changes and alert .when product types ,machines and workforce changes the model may need retraining Detect data drift in input features such as operator efficiency or machine downtime using statistical comparison Set automated alerts when such changes occurs so the model can be reviewed. 4) Maintain Human Oversight Supervisors should review AI’s daily plan suggestions and provide feedback when adjustments are made manually This ensures AI remains a decision-support tool, not a fully autonomous system. 5)Retraining and Triggers Significant difference between AI prediction and actual performance for 2–3 consecutive weeks. Retraining may also be required when new product styles are introduced or when line configurations change. Post deployment monitoring ensure AI to perform Effectively under real Factory Conditions. By tracking MAPE, monitoring Business KPIs, Detecting the data drift ,keeping human oversight and setting clear training triggers can maintain implementation reliable ,ethical and Continuously Improving AI systems.
-
The reason most improvements made during the Improve phase tend to slip away is due to the following: Lack of process ownership – If no one takes full responsibility for sustaining the process improvement, it will not last. Over time, even if the process is documented during handover, it may stop being practiced. Poor handover – Inadequate knowledge transfer or transition leads to confusion and inconsistency. Lack of standardization – Without clear and standardized procedures, people revert to old habits. Weak monitoring systems – If the process is not regularly monitored, deviations go unnoticed. Lack of leadership support – When leadership does not actively support or reinforce the changes, the improvements lose momentum. Tools & Techniques to Sustain Improvements 1. There are several tools and techniques to prevent these issues. One of the most effective is the Control Plan. It helps address poor handovers and lack of ownership, among other challenges. A Control Plan outlines: What needs to be monitored Who is responsible for the monitoring How frequently it should be done What actions to take if variations occur Using a Control Plan ensures that improvements are sustained over time.\\ 2. Control charts This will help us to monitor, control and improve process performance over time . It will mainly identify variations, visualize trends and shifts in the process and its ensure improvements are sustained. Control charts –Detects early warning signals It will reduce daily fire fighting by taking proactive control Encourages employees on data driven decision makings 3. Control Methods · Mistake proofing /poka yoke–eliminate human errors/Reduce dependence on manual work. · Spc charts · Source Inspection · Standard operating procedures 4. Routine Audits for to sustain improvements 5. Conduct structured Trainings for all process users 6. Dash board and KPI monitoring to capture important measurements .Power BI dashboards for real time Data.
-
A Gantt chart is a horizontal bar chart used in project management to visually represent tasks, timelines, and project progress over time. It first breaks down the project into tasks from start to finish. Then, it helps allocate resources efficiently by assigning tasks to team members, preventing overallocation and conflicts. Additionally, it enables tracking of project status, including completed, pending, and ongoing tasks. Most importantly, a Gantt chart provides a clear overview of the project for customers and department heads, ensuring better communication and decision-making. When using Gantt chart despite benefits we have limitations too so projects mangers use different strategies to mitigate those. Let’s discuss some of strategies , 1.Critical path Method They will use critical path method to identify the most crucial tasks and mitigating the the risk associated with dependencies 2.Project Management Software Also they are using project management software's like MS project ,Trello ,click up etc . this includes lot of benefit come from one package improved collaboration, efficient task management, better planning and scheduling, enhanced communication, streamlined resource allocation, effective risk mitigation, budget control, and increased overall productivity by allowing teams to easily track progress, assign tasks, and share information centrally across a project lifecycle. 3.focused small phases /Lean Six sigma They will also break down large projects into smaller phases. Lean Six Sigma plays a significant role in this process, as it provides structured project scoping tools to help teams focus on the most critical areas 4.Risk Management While Gantt charts visually map tasks and dependencies, they don’t inherently handle risks. To manage potential delays and uncertainties like Delays in material procurement, equipment breakdowns, scope changes and resource shortages. they create alternative actions to keep project on track .sometimes they maintain risk register to updates those risks and the relevant risk owner will monitor and update with corrective actions. 5.Review Need to regularly review the project tasks and need to update real time changes, then only this Gantt chart will be useful. By applying these strategies, project managers can make Gantt charts more effective to real-world problems.
-
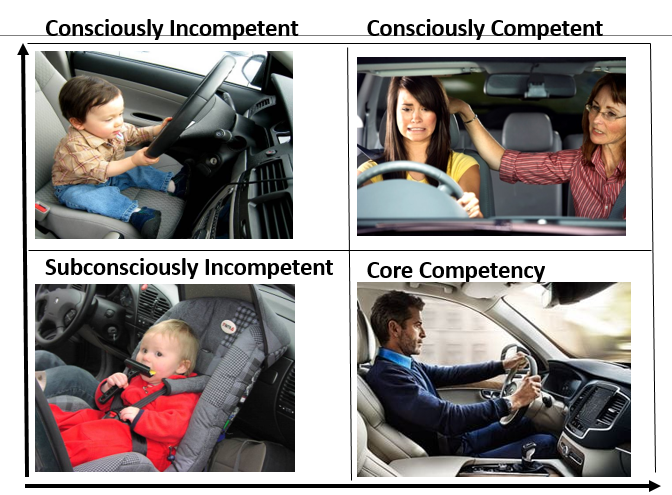
While best practices are well-documented and accessible, only a few companies achieve world-class excellence by implementing them effectively. Here’s why: 1. Lack of continuous culture . Many companies focus only one time implementations rather than treating best practices as ongoing journey. This is evident in the six sigma Competency model, where the consciously competent level is considered as a dangerous phase. If organization do not sustain their six sigma journey through continuous improvement, regular training and consistent applications, they will never reach the core competency level. While many companies recognix=ze the need for six sigmas and its benefits they often fail to set in to their culture. This Lack of sustained effort is a major reason why only a few companies achieve long tern success. 2.Resistance to Change Employees and leadership often resist new methods due to fear, comfort with the status quo, or lack of understanding. below are some examples Employees are comfortable with their current way of working. Any new process or system creates uncertainty, making them feel anxious about their role and future. Most of employees has common mind set "We've always done it this way" People prefer stability and may not see the need for change Employees may not understand the benefit of the new implementations. If leadership fails to explain the reason behind the change employees might think it as a extra work for them If previous change initiatives they might not believe the new changes Employees may feel they don’t have the time, tools, or training to adopt the new methods. 3.poor execution Every industry has distinct processes and products, making it essential to customize implementations according to each specific aspect. Simply copying and pasting the same implementation process from one industry to another can lead to failure. Therefore, customization is crucial. It is important to utilize standard world-class best practices, but these should be adapted to fit your unique business processes. By doing so, organizations can maximize the effectiveness of their implementations and achieve better results 4.Lack of leadership Commitment Leaders play a key role in sustaining the implementation of best practices. Frequent changes in higher management, accompanied by varying directions, can hinder long-term success. That’s why training for upper management is crucial before any implementation begins. When leaders believe in and support the initiatives, the chances of success significantly increase. It is essential for them to collaborate and contribute actively to maintain these practices over the long term. 5.Inadequate Training Employees need proper training to implement them effectively. 6.Failure to Measure & Sustain Improvements Many Companies do not track the implantations impact with their KPIs If you do not track the impact of the changes that have been implemented, those changes will not sustain over the long term. 7.Qucik Wins companies often seek for quick wins and expect immediate outcome from best practices. World class companies do not simply use best practices to achieve success. they set it that top their culture. employees are well educated about the processes and regular trainings ensures that these practices become habitual. As a result, these companies have succeeded in sustaining their excellence
-
Impact of self-serving Bias in root cause Analysis: 1.Defensive Behavior Individuals or departments might refuse to acknowledge their role in a problem out of fear of blame or reputational damage and discourages analysis of process failures. This hinders open and honest discussions which is important for problem solving. Example: A customer service team faces complaints about delayed responses. When questioned, the team leader claims, "It’s because IT hasn’t fixed the software bugs. This kind of behaviors will delay in responses and This will not solve the actual problem and will look at real causes of the issues 2. Distortion of Problem Understanding When team members are busy with day to day fire fighting’s and with inefficiencies, they may shift the focus of root cause analysis toward external factors such as supplier issues or customer complaints. This result in an incomplete understanding of the process, missing gaps . Example : In a manufacturing process, a high defect rate is observed in a product. So team is blaming suppliers saying it is due to poor quality of raw material, without identify their own process and machine problems. This prevents the team from addressing the real root cause of the issue. 3.Confirmation Bias Reinforcement Teams may focus on data supporting their beliefs about external issues, ignoring internal mistakes, leading to biased decisions. Example: In a logistics operation, late deliveries are blamed on traffic, ignoring GPS data that shows the real causes: poor route planning and loading delays at the warehouse. 4.Suboptimal Solutions Blaming external causes leads teams to address surface symptoms, missing deeper issues and causing recurring problems or limited progress. Example: A retail store blames stock outs on suppliers and increases safety stock, ignoring the real issues of poor demand forecasting and team communication. This raises costs without solving the problem. Strategies to Mitigate Self-Serving Bias in root cause Analysis. 1. Cultivate a Blame-Free Environment: The key idea is to foster a positive and constructive environment where mistakes or problems are viewed as chances to improve, rather than reasons to blame someone. This approach helps teams focus on finding solutions and learning from challenges instead of getting stuck in a cycle of defensiveness or finger-pointing. For example: When a problem occurs, asking "What can we learn from this?" shifts the focus to growth and understanding. On the other hand, asking "Whose fault is it?" creates fear and defensiveness. This can lead to hiding issues or avoiding responsibility, which prevents genuine improvement. 2.Engage in Facilitated Discussions: · Involve an unbiased facilitator to mediate discussions, ensuring all perspectives are heard and biases are minimized. 3.Rely on Data-Driven Analysis: · Use quantitative tools like Cause-and-Effect Diagrams, Pareto Charts, and Control Charts to focus discussions on evidence rather than opinions. · Apply 5 why Analysis Techniqe rather than blaming to individuals. For example, instead of "Why did John make this error?" ask, "Why did the process allow this error to happen?" · Lately cross check identified root causes with independent data sources or audits to ensure objectivity · Perform hypothesis testing to to validate the significance of causes. 4.Use Diverse Perspectives: · Involve team members from various departments or external stakeholders to challenge assumptions and bring fresh insights. This helps uncover root causes that may be overlooked due to internal biases. 5.Train Teams on Cognitive Biases Educate teams about self-serving bias and its potential impacts on decision-making. Awareness can help individuals recognize and counteract their biases. Creating a culture of openness, using data effectively, and promoting critical thinking helps Lean Six Sigma teams overcome self-serving bias. This allows them to pinpoint root causes accurately and implement lasting improvements.
-
Q 723. What is Non-parametric Analysis? In which type of industries is it mostly used? Highlight its advantages using some examples. Non parametric analysis is a type of statistical method that doesn’t rely on strict assumptions about data. This Data more flexible and work well for : · Ordinal data · Nominal data · Small sample sizes · Skewed data or outliers Industries Where Non-Parametric Analysis is Used and examples Industry Reason of using non-parametric Analysis Example Test mainly used Health care and pharmaceutical Can experience lot of non-normal data, small sample sizes, and ordinal variables. -Analyzing patient recovery times under different treatment. -The effectiveness of two drugs. -Patients satisfaction analysis. - Comparing adverse drug reaction among patients using 3 medications Kruskal-Wallis H Test Mann-Whitney U Test). Wilcoxon Signed-Rank Test Chi square test Retail and consumer behavior can handle diverse data types, such as customer preferences, purchasing habits, and survey responses. - Customer preference by by age group - Sales performance comparison - Discount strategy evaluation -Loyalty program impact -seasonal sales trend - correlation between spend Chi-Square Test Kruskal-Wallis Test Mann-Whitney U Test Wilcoxon Signed-Rank Test Friedman Test Spearman’s Rank Correlation Insurance or investment companies deal with often non-normal, skewed, or ordinal. Non-parametric methods are ideal for analyzing claims, customer behaviors, risk assessments, and portfolio performance in these sectors. - Comparing claim processing times - Customer satisfaction pre/post-policy change - Investment preferences by age group or employee’s categories -Portfolio performance by advisors - Correlation between premium and claims Kruskal-Wallis Test Wilcoxon Signed-Rank Test Chi square test Mann-Whitney U Test Spearman’s Rank Correlation Hotel industry The hotel industry often deals with complex non normally distributed data, ex: customer reviews /satisfaction -Analyzing guest satisfaction across multiple branches -Comparing room service ratings across branches - Measuring the impact of a new loyalty program - Analyzing guest preferences for room types - Evaluating staff performance pre/post training Kruskal-Wallis Test Wilcoxon Signed-Rank Chi-square Test Sign Test Education In Education always use in ordinal data -Evaluating teaching methods -comparing student performance across school -Comparing academic stress level Kruskal-Wallis Test Mann-Whitney U Test Spearman’s Rank Correlation Non-parametric analysis is a flexible and reliable method for analyzing data, especially when traditional techniques don’t work well. It’s ideal for uneven data, small samples, or ranked information. This approach is used in many industries to uncover valuable insights, even from irregular datasets.
-
An underlying knowledge base in a knowledge management system can be unusable for several reasons 1.due to outdates content -knowledge bases can contain irrelevant information leading to employees confusion and inefficiency 2.poor organization-without proper organization, users may struggle to find out the required content 3.lack of searchability-not optimize the search functions and will be difficult to find out required information 4.inconsistent quality -information may not complete or inconsistent .this will make hard users to trust or apply the content effectively 5.limited user engagement-if users do not update content the the kb can be incomplete . this can be happened due to lack of awareness of KB Value 6.technical issues - slow performance and bugs and compatibility issues with other systems 7.Lack of user training- user might not know how to use the system effectively due to lack of training The strategies that can be implemented to improve usability and effectiveness Of KB . 1. Regular Updates and maintenance -to keep the data base remain accurate ,relevant and valuable an effective review process is very important .ex: how often content need to be reviewed, using calendaring tool to schedule reviews ,assign responsibility ,assign content owners, regular audits to check accuracy, evaluate completeness 2.clear categorization and structuring -understand user needs / create logical categories like high level categories and then sub categories ( Break down of main categories )/using descriptive labels/standardized naming/tagging 3.Enhanced search functionality-Advance Indexing ( need to index the content ,including titles ,sub headings /Multilingual support / having search filters by categories or sub categories . 4.Content standardization-This ensures the clarity and consistency and professionalism .this helps users to find and understand the information. using uniform structure for templates /set writing guidelines/consistent terminology ,can use screen shots diagrams charts for better understanding/ using standardize icon .regular audits and review /rugular trainings to keep the standard 5.User Engagement and Incentives -need to make the KB user friendly .can use clean ,visually appealing interface with easy navigation /Mobile accessibility /can be enable user comment sections to have the user interaction and improvements /live chat integration/incentives for engagement / feed back analysis 6.Establishing Regular feed back loops -Create accessible feedback mechanism /establish feedback review process /Implement reward system /act on feedback 7.Training and support-user trainings /technical trainings this will enhance KB usability but also a collaborative enhancement where users and contributors empowered to maintain the system effectively 8.Integration with other system-kB can be linked with ERP and CRM tools(salesforce, HubSpot ) ,customer support platforms . this will enhance its functionality How AI solutions can contribute : 1.Automated tagging and categorization- AI can automatically tag and categorize content 2.Content personalization -Analyze user behavior and suggest relevant content 3.Smart search capabilities-AI can make search engines smarter by understanding not only words ,synonyms and natural language 4.Automated content creation- AI generate summarize articles ,creating new knowledge articles 5.Predective analytics- AI can analyze patterns to understand user future information need 6. Continuous content improvement -AI can monitored the low quality content and automatic update is based on new data 7.Chatsbots and virtual assistant- chatbots can provide immediate answers and engage with users in real time By using AI in these areas ,a knowledge base can work better ,be more flexible and focus on what users need .AI helps by automatically organizing content ,improving search and making the user experience more personalized. This keep the KB up to date ,easy to use and responsive to what people are looking for. Tools like chatbots, predictions what users might need automatic content creation make the KB smarter and more efficient, helping it grow and improve over time for both users and contributors .
-
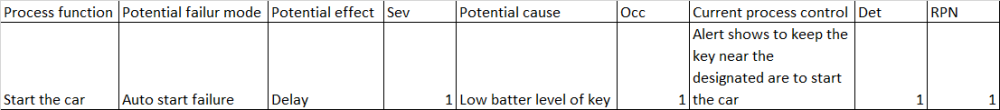
In FMEA, Risk Priority Number helps us assess the risk in the process. While potentially RPN can range from 1 to 1000, could there be a process step, where the RPN is 1? Provide examples to support your answer. Risk priority number helps us to prioritized the potential failure modes. RPN is the product of severity, occurrence and Detection . (RPN = Severity * Occurrence* Detection.) In some situations it can be 1 when severity = 1 , occurrence =1 and detection 1.This is the minimum level that RPN can be. RPN =1= 1 (Sev)*1(Occ)*1(Detection) Severity number 1 shows low severity that are unnoticeable or can be reworked areas. Occurrence ranking 1 implies the failure cause is very unlikely to occur, Detection rank 1 implies if process automatically detect the failure and the controls will almost certainly detect the existence of a failure Please refer below Example for more understanding , low battery level of car key In some Auto car’s if battery level is low in car key we won’t be able to start the car automatically but it is detecting by the vehicle and advised to keep the key at a designated area near steering wheel to start the car.