

Subham De Sarkar
Members
-
Joined
-
Last visited
-
Subham De Sarkar changed their profile photo
-
Subham De Sarkar replied to Vishwadeep Khatri's topic in We ask and you answer! The best answer wins!A tree diagram is a planning and analytical tool used to segment larger problems into smaller ones in order to gradually break down difficulties in detail. It is also known as an analytical tree, a systematic diagram, and a hierarchy diagram. Among the seven management tools, it is one. Effective operation planning and management require the usage of these instruments. The 7M tools' main objective is to assist managers in planning, analysing, and making decisions. You can split down complex ideas into increasingly more specific parts using a tree diagram. Here, it is intended to methodically dissect a concept into its component parts. The first item in the tree diagram branches into two or more others. The branch continued to divide, possibly into two or more. With a trunk and several branches, it has the appearance of a tree. Advantages § The diagram can be easily constructed and visualised. § The dependencies are clearly understood § It is thorough, representing the results and leading up to the project's objective. § Excellent adaptability and simplicity of use to support management in any field Disadvantages § Despite being simple to make, the entire diagram might be complicated. information visualisation § stifling with numerous branches once a particular threshold is reached § It's challenging to add additional branches in the middle because the entire structure needs to be moved to the lower levels of the tree. Steps to create a Tree Diagram § Find the project's or the problem's aim statement. According to a vertical tree or horizontal tree, position the goal at the top or on the left side of the design. § Determine the main tasks and subtasks that must be completed to reach the project's objective. § For each task and its subtasks, come up with all potential solutions. From general to specific, the diagram should progress. § Verify each item and note any new tasks that the goal-achieving task tree needs to include. § Keep going until you reach the foundational components. In other words, keep going until all choices have been explored.

-
Subham De Sarkar replied to Vishwadeep Khatri's topic in We ask and you answer! The best answer wins!About Tornado Diagram: A tornado diagram, which is a type of bar chart, aids project managers in performing a sensitivity analysis to ascertain the effects of various risks on a project. In order for the project manager to make decisions first on the high impact items, this information is arranged in descending order. Why Tornado diagram can be used in Quantitative Risk Analysis? Any project on which you work inevitably carries a number of risks. Until you figure out how to prioritise them, it might be difficult for you to keep track of all these risks. As a result, you should rank the risks based on their importance and degree of impact. Risks are accompanied by gains as well as losses. You run the risk of not receiving the expected level of quality if you choose to work with a new vendor on a project in an effort to cut costs. Calculating the risk's cost and associated benefit is necessary. You can prioritise the risks based on their potential impact by placing them on a bar chart. You can manage risks and make quick decisions in the best interests of the project by using a tornado diagram to represent the risks. Risks and rewards are typically proportional in size. Example: People frequently look for tornado pmp and tornado diagram pmp when looking for examples of tornado diagrams, but these diagrams are not just for pmp. Outside of project management, they can also be used for risk assessment. The risks and rewards are shown on either side of a tornado diagram like the one shown above. On the left is a representation of the risk, and on the right is a representation of the reward. As you can see, it seems like the risks and rewards are roughly equal. The risk and reward of Risk V are the lowest. The risk outweighs the benefit. This risk is not worthwhile because it carries a greater risk than the potential reward. Even if it is successful, the reward has little impact in the overall scheme of things. The top 3 or Top 4 options should receive more of your attention because they offer a greater reward and therefore call for more careful consideration. Additionally, they have a much higher level of reward compared to the possible loss. This is not to say that risks shouldn't be taken at the top. The chart is just one of the many tools you have at your disposal to evaluate risks. The chart tells you which decisions are more important to you and how much time you should spend carefully weighing each option. The decisions that need to be made may depend on a number of other factors. Analysis of Sensitivity Using a Tornado Diagram Sensitivity analysis is a notion in project risk management. In terms of how and to what extent decisions are likely to affect a project, it quantifies risks. This can also be calculated in terms of time rather than just in terms of monetary value. Particularly when a project's completion or goals are constrained by a deadline or are otherwise time-sensitive. The tornado diagram is crucial in helping you prioritise these risks and determine which ones are worth taking for the project and which ones are not worth much consideration. While it is still possible to manage the project successfully without these tools, it is more likely that you will overlook some risks or spend excessive time analysing risks of minor importance.

-
Subham De Sarkar replied to Vishwadeep Khatri's topic in We ask and you answer! The best answer wins!PAT: The amount that is left over after a company has paid all of its operating and non-operating expenses, other liabilities, and taxes is referred to as profit after tax. This profit is what the company keeps as retained earnings in reserves or distributes to its shareholders as dividends. Features of PAT § Numerous other names were also used for it, including Net Operating Profit After Tax (NOPAT) and just Net Profit After Tax. § Profit After Tax is frequently a useful number when calculating ratios that assess the profitability and effectiveness of the business. § When a company is publicly traded, Profit After Tax margin (PAT) is used to illustrate how any change in value will affect the stock price. § Profit After Tax is calculated on a per-share basis if the company is publicly traded and is shown on the income statement of the company. § PAT values that are high indicate high efficacy, and vice versa. § The dividends paid to equity shareholders are directly correlated to PAT; the higher the profit after tax, the better the dividends. Organizations in practically every sector can gain competitive advantages by implementing the Lean Six Sigma principles to improve financial health of the organization. Lean six sigma will help PAT in the following way a) Error Minimization Lean Six Sigma enables more concentrated and effective operations in divisions not solely dedicated to manufacturing. According to one case study on billing reconciliation, customer accounts were charged less than what was owed on average 60% of the time due to billing errors. However, the organisation was able to almost completely resolve this issue after implementing LSS. b) Identification of Problem LSS has the advantage of using quantitative techniques to pinpoint key impact points (KPI). LSS can be used to covertly and effectively address efficiency issues within these KPIs once they have been identified. The process map is a crucial LSS tool for locating KPIs and any problems they may have. Professionals can identify problems with current procedures and use their findings to improve them or eliminate processes that aren't adding value by defining the boundaries and requirements of the current process. c)Continual Development Since Lean Six Sigma is intended to be a continuous improvement system, training in LSS is still beneficial years after it was first implemented. Organizations can use the DMADV (Define, Measure, Analyze, Design, Verify) process to create new workflows and processes as well as enhance existing ones by putting it into practise. Companies like Capital One have discovered that implementing lean six sigma in banking produces results that go far beyond their day-to-day work, despite the initial application of the methodology frequently focusing directly on specific product and process improvements.
-
Subham De Sarkar replied to Vishwadeep Khatri's topic in We ask and you answer! The best answer wins!Definition of Waterfall chart: An example of data visualisation that aids in comprehending the cumulative impact of successively introduced positive or negative values is the waterfall chart. These intermediate values may be based on categories or on time. Due to the appearance of columns (or bricks) suspended in midair, the waterfall chart is also known as a flying bricks chart or a Mario chart. It is frequently referred to as a bridge in the world of finance. A brief History of Waterfall Chart: In its client presentations, the strategic consulting firm McKinsey & Company (James O. McKinsey, a professor at the University of Chicago, founded McKinsey & Company in 1926. This multinational management consulting firm provides expert services to businesses, governments, and other organisations. The oldest and largest of the "Big Three" management consultancies (MBB), or the three biggest strategy consulting companies in the world, is McKinsey. The company's primary areas of focus are their clients' finances and business operations. )made waterfall charts widely used. Features of waterfall chart : shows how sequential or categorical positive and negative values applied to the starting value have an additive effect. Both time-based (values in and out by month) and category-based (various sources of income and various sources of expenses for a given time period) additions and subtraction are possible. Sub-components of the incoming and outgoing streams are represented by color-coded floating blocks, while totals and major sub-totals are represented by full columns. A chart like this appears to be a waterfall. Excel's stacked column charts and the "hidden" building blocks' shading and outlines can be used to create waterfall charts. Bridge Charts are another name for waterfall charts. Fig: Construction of waterfall chart Use of Waterfall chart in the field of business excellence: 1. Waterfall charts can be used to illustrate any process that involves additions and subtractions from a starting value, but they are most frequently used in business applications. 2. In finance, waterfall charts are frequently used to illustrate how practitioners arrive at a net value and to aid in the visualisation of: Revenue statements broken down by region, month, or P&L line Income or cash flow Assessing business profit Shifts in stock prices Return on capital invested 3. Pay close attention to project budgets. There are numerous analytics tools that can assist you in keeping everything on track. It can be challenging to keep a project on schedule and within budget. A waterfall chart allows you to specifically see metrics like: Phase-by-phase project spending Variance from the budget 4. Increase sales and interest in the brand Use waterfall charts to lead your sales or marketing team to the appropriate insights. To increase brand and customer interest, they should be able to quickly and easily create these charts and visualise data on what works and what doesn't. They could visualise and track: Growth or churn rates for customers or subscribers by month Revenues per product Contributions to totals by region, graph Competitor research Using campaign cash flow to find new clients 5. A study of root causes in various industries Waterfall charts are used by BI managers to show what led to an event, where things went wrong, or where the plan was deviated from. It's a useful way to provide quick insights to an executive team who are interested in the highs and lows. Waterfall charts are also used in the following sectors: To visualise patient days by nursing unit in healthcare Visualizing inventory balances over time in retail Contributions to totals by region, graph Competitor research Using campaign cash flow to find new clients 6. Easily manage stock and inventory The production team can maintain optimal levels for profitability by analysing how stock and inventory levels change over time.

-
Subham De Sarkar replied to Vishwadeep Khatri's topic in We ask and you answer! The best answer wins!Trial and Error One Factor at a Time Multiple Factors at a Time This is problem solving method for relatively simple problem This is problem solving method relatively complex method This is problem solving method relatively complex method Multiple attempts to be made to get a solution Only one factor can be changed at a time, but others remain unchanged. Multiple factors can be changed at a time Trial and error doesn't try to apply a solution to other issues in a general way. This can be used to generalize a solution to other problems. This can be used to generalize a solution to other problems. This is a non-optimal method to find solution. This is an optimal method to find solution. This is an optimal method to find solution. This is not for finding optimal solutions This is relatively slower than the Multiple factors at a time to find optimal solutions In addition, it can speed up the finding of optimal solutions compared to OFAT experiments. Over the other two more structured approaches, trial and error will be preferred for the following conditions 1.When you have more test subjects than you require for each test, trial, and error works best. 2.When optimal solution is not required 3. When there are a testably finite number of potential solutions, it is possible to use trial and error to find all solution or the best solution
-
Subham De Sarkar replied to Vishwadeep Khatri's topic in We ask and you answer! The best answer wins!In his book Statistics as Principled Argument, Robert Abelson outlines a series of standards known as the MAGIC criteria. In this work, he makes the argument that the purpose of statistical analysis should be to provide the MAGIC criteria as a means of making convincing assertions about the world. Magnitude – What size is the impact? Effect size matters more than effect size, in my opinion. Articulation – How detailed is it?Statements with greater precision have greater persuasive power. Generality – How broadly is it applicable? Effects that are more widespread than others are more persuasive. Claims that appeal to a wider audience are more convincing. Interestingness – Effects that "have the potential, through empirical investigation, to affect what people feel about an important subject" are particularly interesting, according to research. Effects that are more captivating than others are those that are more fascinating. Furthermore, unexpected results are more interesting than those that only corroborate what is already known. Credibility – Claims that are credible rather than unbelievable are more persuasive. The credibility of the assertions made must be established by the researcher. Results that conflict with earlier findings are less reliable. The linkage between MAGIC Criteria and DMAIC Define- Declaring the business problem, aim, prospective resources, project scope, and high-level project timetable explicitly is the goal of this step. This can be related with “Magnitude” of MAGIC. This means how big is the effect? So it can be considered as declaring the business problem, aim, prospective resources Measure- This step's objective is to evaluate how well the problem or goal has been specified. This is a data collecting stage whose goal is to create baselines for process performance. This can be related with “Articulation” of MAGIC criteria How precisely stated is it?. The precision is one of the important criteria of measurement. Analyze- This step's objectives are to find, validate, and choose the root cause for elimination. This can be related with “Interestingness” of MAGIC criteria . Effects that "have the potential, through empirical investigation, to affect what people feel about an important subject" are particularly interesting, according to research. Improve- Finding, testing, and putting into practise a partial or comprehensive solution to the issue are the goals of this step. Depending on the circumstances. Determine innovative ways to reduce the main causes in order to solve and avoid process issues. This can be related with “Generality” of MAGIC criteria. Effects that are more common than others are more credible. Claims that appeal to a wider audience are more convincing. Control- This step's goal is to integrate the changes and assure sustainability; this is also known as "making the change stick." This can be related with “Credibility” of MAGIC criteria Claims that are credible rather than unbelievable are more effective. The researcher must demonstrate the veracity of the claims made. So more credible means more acceptable so the solution will be more sustainable.
-
Subham De Sarkar replied to Vishwadeep Khatri's topic in We ask and you answer! The best answer wins!Intelligent automation uses artificial intelligence (AI) technologies like machine learning, natural language processing, structured data interaction, and intelligent document processing, whereas RPA typically focuses on automating repetitive tasks and rules-based processes. RPA is great for repetitive tasks that frequently string together to form a simple business process, like logging into an account, clicking a box, or moving a file from point A to point B, for instance, when you log in to your email account with the same username and password. The RPA solution does not function entirely at its best when a variation is introduced, it is a fact. Variations are adapted by people, but software bots that only follow rules do not. Due to this The RPA solution does not function entirely at its best when a variation is introduced, it is a fact. Variations are adapted by people, but software bots that only follow rules do not. Because of this, rule-driven RPA is inferior to AI-driven Intelligent Automation, also known as Intelligent Process Automation (IPA). IPA implements RPA capabilities in addition to adding capabilities to process automation that are only possible with bots that can continuously learn and adjust to changing data.
-
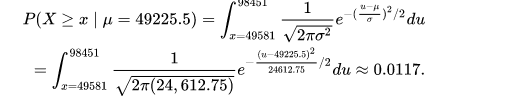
Subham De Sarkar replied to Vishwadeep Khatri's topic in We ask and you answer! The best answer wins!Lindley paradox The Lindley paradox is a perplexing situation in statistics where, depending on the prior distribution selection, the results of the frequentist and Bayesian approaches to a hypothesis testing problem differ. Two hypotheses, Ho and H1, as well as some prior distribution pi that represents uncertainty as to which hypothesis is more accurate before taking into account, can each account for the result x of an experiment. The Lindley paradox appears when: A frequentist test of Ho finds that the result x is "significant," i.e., there is enough evidence to reject Ho at the 5% level. 2. There is strong evidence that Ho agrees with x more strongly than H1 based on the posterior probability of Ho given x being high. These outcomes are possible when Ho is highly specific, H1 is more diffuse, and neither Ho nor H1 is strongly favoured by the prior distribution, as shown in the example below. The paradox proposed by Lindley is illustrated by the next numerical example. 49,581 boys and 48,870 girls have been born in a particular city over a specific time frame. Therefore, the observed percentage of male births is 49,581/98,451 0.5036. Assumed to be a binomial variable with parameter, the proportion of male births. Whether is 0.5 or another value is what we want to find out. In other words, the alternative to Ho:Ø 0.5 is the null hypothesis, Ho:Ø =0.5. Calculating a p-value, or the likelihood of observing a fraction of boys at least as large as x assuming Ho is true, is the frequentist method for testing Ho. Due to the large number of births, we can use a normal approximation to calculate the percentage of male births, xN(, 2), where =np= n=98451x 0.5=49225.5 and 2=n(1-)=98451x0.5x0.5=24612.75 A frequentist would typically conduct a two-sided test, for which the p-value would be P2x0.0117=0.0235, because we would have been equally surprised if we had observed 49,581 female births, or x0.4964. The frequentist approach rejects Ho in both cases because the p-values are less than the significance level,, of 5% and Ho does not agree with the observed data.
-
Subham De Sarkar replied to Vishwadeep Khatri's topic in We ask and you answer! The best answer wins!The disadvantages of Pugh matrix is following 1) First off, it is impossible to determine whether the list of criteria options is exhaustive because it is arbitrary. More likely, some crucial requirements are not met. 2)Additionally, the inclusion of some less crucial criteria may prevent decision-makers from making the best choice. Even with weighing, scoring methodologies have a tendency to equalise all requirements. 3)Finally, you don't base the values you give to your guesses on precise measurements. The decision matrix conveys a sense of objectivity and science without providing any quantitative measurements. The above problems can be largely solved by the Analytic Hierarchy Process (AHP) 1) The consistency of the decision can be checked by AHP 2) By determining weights and priorities with the help of informed judgments, it is possible to compare both qualitative and quantitative data. 3) It can be used for group decision making environments When Pugh Matrix is preferred over AHP? The Pugh matrix is very fast method over AHP, and it can be easily calculated manually and the AHP is much lengthy process than Pugh matrix. So it can be preferred over AHP where simple decision making is required rather than complex multi criteria decision making.
-
Subham De Sarkar replied to Vishwadeep Khatri's topic in We ask and you answer! The best answer wins!About Project Artifact You make something called an artefact. Artifacts are outputs, documents, templates, or a particular deliverable that are related to project management. Type of project Artifact present 1. strategic artifacts • Business case • Project roadmap • Project charter • Project vision statement 2.logs and registers • Risk register • Backlog • Assumption log • Stakeholder register 3. plans • Communications management plan • Scope management plan • Release plan • Test plan • Iteration plan • Logistics plan 4. hierarchy charts • Work breakdown structure • Risk breakdown structure • Organizational breakdown structure • Product breakdown structure 5.baselines • Scope baseline • Budget • Performance measurement baseline • Milestone schedule 6. visual data and information • Flowcharts • Gantt chart • Dashboard • S-curve • Cycle time chart 7.reports • Quality report • Risk assessment report • Status report • Progress report 8. agreements and contracts • Memorandum of Understanding (MoU) • Fixed price contract • Time and materials contract • The indefinite-delivery, indefinite-quantity contract Project management artifacts Phase wise 1. Originating. 2. Initiating. 3. Planning. 4. Controlling, monitoring, and executing. 5. Project status. 6.Closing

