

rohit chaudhary
Members
-
Joined
-
Last visited
-
rohit chaudhary replied to Vishwadeep Khatri's topic in We ask and you answer! The best answer wins!ANOVA stands for Analysis of Variance. It is a statistical analysis method to study the impact of factor/s on response/s. There are different types of ANOVA methods in use, as below: 1. One way ANOVA: This method studies the impact of ONE FACTOR, with 3 or more sub-groups, on ONE RESPONSE. Eg.: Impact of Exercise type (Cardio, Weightlifting, Yoga) on Weight lost. 2. Two way ANOVA: This method studies the impact of TWO FACTORS, on ONE RESPONSE, both independently and as an interaction (between both factors). Eg. : Impact of Exercise type & Gender, on Weight loss. 3. ANCOVA: This method is similar to ANOVA in that it also studies the impact of subgroups on Response, however it also accounts for impact on response of one or more COVARIATES. COVARIATE is an independent variable that has an impact on response but is not a direct factor under study. Eg.: Impact of Exercise type (Cardio, Weightlifting, Yoga) on Weight lost after removing/accounting for Impact of Gym size and Gym fees. 4. MANOVA: This method involves studying impact of ONE or more FACTORS on TWO or more RESPONSES. Like ANOVA it can be done 1-way & 2-way. Eg.: Impact of Exercise type and Gender on Weight loss and Income 5. MANCOVA: This method is similar to MANOVA, as it is about studying impact of ONE or more FACTORS on TWO or more RESPONSES, but after accounting for impact of one or more COVARIATES. Eg.: Impact of Exercise type (Cardio, Weightlifting, Yoga) & Gender on Weight lost & Income, after removing/accounting for Impact of Gym size and Gym fees.
- 10 replies
-
- anova variants
- anova
- ancova
- manova
-
Tagged with:
-
rohit chaudhary replied to Vishwadeep Khatri's topic in We ask and you answer! The best answer wins!Autocorrelation is the degree of correlation of the same variable measured at two different time intervals. While it is useful in scenarios such as predicting weather or stock market prices, it also poses an issue with regression analyses. It is an issue in regression analysis because presence of autocorrelation in residuals means that they are not independent over time and hence we cannot rely on the standard errors and hence can’t rely on the p value. To help remove auto-correlation from regression analysis, we could use Durbin-Watson test to identify the presence of autocorrelation first and then look for any missing key variable from the analysis. Usually, it’s due to missing key variable that autocorrelation occurs. If this doesn’t fix then there are few transformation methods that could help sort this issue, such as Cochrane-Orcutt Procedure, Hildreth-Lu Procedure & First Differences Procedure.
-
rohit chaudhary replied to Vishwadeep Khatri's topic in We ask and you answer! The best answer wins!Rare event control charts are used for observations or events, when they occur rarely. Plotting such rare events on traditional discrete data charts, like C, U, NP & P charts, will not be effective primarily for two reasons as below: 1. Since discrete control charts are time-series based and the probability of event occurring is so low that it’ll be a very time consuming and difficult to task to collect required number of events to plot on these chart to make statistical sense. 2. Discrete control charts also require to collect total number of opportunities to calculate the control limits. Rare event control charts address both of these issues for rare events scenarios as they only require to record the number of events between rarely occurring events, when using G Chart, or the time elapsed between the rarely occurring events, when using T Chart. How to read rare event control charts: The logic is to look for points, shown in red in Minitab, which are above UCL. These points are the desirable points as these would mean a higher number of events/time elapsed between two rarely occurring undesirable events. And points below or near LCL are those which require attention as these mean lesser than usual number of events/time elapsed has happened between two rarely occurring undesirable events.
-
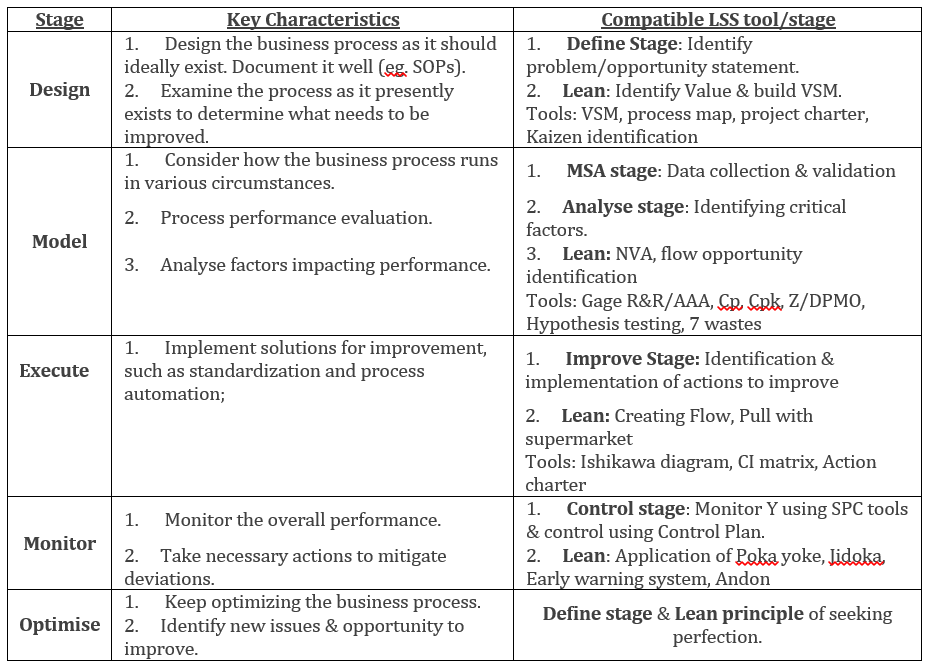
rohit chaudhary replied to Vishwadeep Khatri's topic in We ask and you answer! The best answer wins!BPM stands for Business Process Management, which is a discipline deployed by organisations to establish, execute & optimise business processes. The 5 stages within BPM lifecycle are given below, along with key characteristics and compatible LSS tools.
-
rohit chaudhary replied to Vishwadeep Khatri's topic in We ask and you answer! The best answer wins!With advent of data collection techniques, such as data generated by sensors and analog-to-digital converters, organisations are inherently enabled to capture more data than they can analyse using current Analytical abilities & Business Intelligence tools to derive insights for decision making. Key challenges with usage of Dark data are: 1. Limitations of resources, such as lack of highly skilled analytics teams or limitation of BI tools, which are currently available in organisation to process such huge amount of data. 2. Data being unstructured, that is data is in difficult to categorise formats, hence not feasible for analysis. 3. Expensiveness of processing dark data leading to non-usage. 4. Delay in processing dark data leading to un-usable insights. Such as, geo-location of customer if not known immediately might turn out to be un-usable at later point. Storage of Dark data also poses few issues for organisations, such as: 1. Storage of dark data, which could be upto 99% of data collected for some organisation, requires lot of energy. As per one study by James Glanz in Sep 2012, published in New York Times, 90% of energy is wasted by data centres for storing dark data. 2. Breach of sensitive information, especially of customers and organisation, could lead to issues like Identity theft and might do more harm than any good. 3. Higher cost of audit & compliance for storing dark data. 4. Losing, or requiring more effort to obtain good data and insights due to enormous volume of dark data. However, there are efforts made in direction to reduce harmful effects of storing Dark data, such as discarding data which are not used through timely audits. Also, to improve usability, organisation are looking to employ higher computing capability, highly skilled MIS teams, AI capabilities & use of techniques like Hadoop or Splunk integrated with Big Data analytics to process faster and larger amount of dark data. There are technological advancement happening at rapid pace to reduce cost pressure also to analyse dark data by companies such as Veritas & Datumise. Organisations such as Amazon, Apple, Google, Facebook & Bloomberg are aggressively tapping into Dark data using cutting edge methodologies such as AI enabled data collection and analysis, advanced big data analytics etc.
-
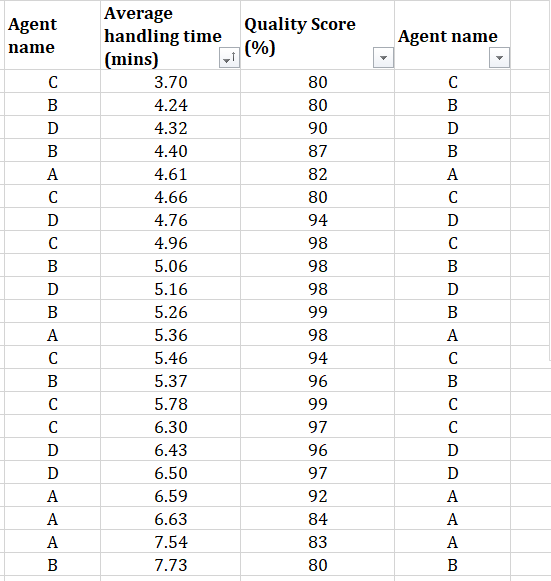
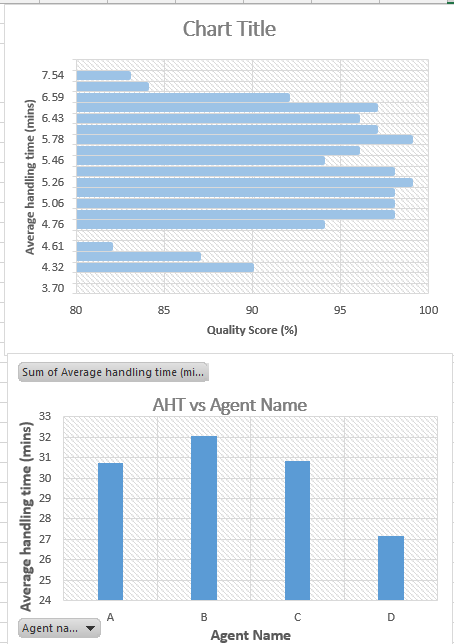
rohit chaudhary replied to Vishwadeep Khatri's topic in We ask and you answer! The best answer wins!Data visualisation tools, such as Tableau, differentiate the Data into two types, namely Dimension and Measure. Where, while Measure is used for a variable which is Quantifiable and mostly continuous in nature, such as AHT, Turn-around time, sales, cost etc. Whereas Dimension is nomenclature used for defining a variable which is qualitative and discrete in nature, such as Region, Team leader, Process name, Agent name etc. To understand the difference better, attached gives an example showing AHT measure against QC score measure & Agent name dimension. The first graph shows AHT compared to QC scores, where both are measures. And QC is one variable which is continuous in nature and it’s values is in a sequence, hence could be shown in one direction only (80 to 100 or 100 to 80) and can’t be broken. The second graph shows the AHT against the Agent name, where agent name variable gives dimension to AHT measure and shows AHT as a quantity, in this case average of AHT, for each individual agent. Here agents are independent of each other, hence their positions on graph could be changed or shown as separate graph entities.
-
rohit chaudhary replied to Vishwadeep Khatri's topic in We ask and you answer! The best answer wins!A Mafia Offer is the offer that solves market’s core problem/s such that it makes it unmatchable by its competitors in the foreseeable future. Customer desire and drools over such offer and prefer over others as it addresses their core issues, such as desire or requirement for immediate delivery of product or service, return of products without any questions asked, etc, where competition don’t have the capabilities to deliver the same in current market, at least for a very significant time period in coming future. These are usually very tough to crack and pose a high risk of failing to achieve the stage where they can make such offer to market. Also, usually requires challenging the constraints prevalent in the industry, and thus needs overhauling the Ongoing operational processes. USPs on the other hand, like CVP (Customer Value Proposition), is aimed at Outing performing its competition by providing certain features of its product, service, or way of delivery better than others. These are mostly achieved by improvement in operations or technology. Thus, clearly USP is different from Mafia offer on aspects covered below: 1. Mafia offer is aimed at solving the customers’ core issues, while USP is aimed at only providing current service/product better than others. 2. Mafia offer, mostly, requires major overhauling of current way of working, while USP is achieved by improvements in current way of working. Mafia offer potentially will create new discoveries and patents in the process of coming up with new combination. 3. Mafia offer is comparatively more time consuming, capital intensive and risky method. 4. Mafia offer could potentially create, seemingly, Monopolies for the foreseeable future. While USPs give a competitive edge which could be surpassed by competition relatively easily. 5. Mafia offer, make industry monopolies like: a. Dominoes in pizza delivery when they introduced 30 minutes or free offer b. Hyundai in cars, when they offered to buy back within 2 years if customer loses the job in certain markets (during Covid period). c. Amazon in product delivery, when they offered no question asked return policy. d. Tesla, when they offered the electric car, with battery efficiency far above the competition, with their innovative battery making processes.
-
rohit chaudhary replied to Vishwadeep Khatri's topic in We ask and you answer! The best answer wins!1. Conceptually the difference between the two metrics is as below: Fleiss’ Kappa is based on the concept that the observed agreement is corrected for the agreement expected by chance. Whereas, Krippendorff’s alpha is based on the observed disagreement corrected for disagreement expected by chance. 2. Difference between the two metrics in observations is as below: While for both, the point estimates of Fleiss’ K and Krippendorff’s alpha do not differ from each other in all scenarios. The difference lies in the cases of missing data (completely at random), where Krippendorff’s alpha provides stable estimates, while the Fleiss’ Kappa could potentially lead to biased estimates. Hence Krippendorff’s alpha is preferred if the measurement scale is not nominal and/or missing values are present (completely at random). To make it more general, for those who are interested in a one-fits-all approach, Krippendorff’s alpha could be used as the measure of choice.
-
rohit chaudhary replied to Vishwadeep Khatri's topic in We ask and you answer! The best answer wins!The underlying definition of a Robot is that, it is a programmable machine that is capable of taking a number of undertaking complex series of actions, either assisted by Humans or unassisted. Robots, could be classified into two categories (as per IFR, International Federation of Robotics) on the basis of application and way of us as below: 1. Industrial Robots: These are traditional robots that are programmed to work in isolation from human contact, largely in Industrial settings. Industrial robots are majorly used for Assembly operations, Heavy material movements and Machine feeding. 2. Cobots: Also known as Collaborative Robots, are robots designed to work with direct human interactions, either in close proximities or within a shared space. These are closely related to what is called as Service Bots, and the main uses are in domestic & professional settings including below Applications: a. Pick & place objects (e.g. Moving documents within office space) b. Quality inspection (eg. Alicona uses its 3D metrology inspection cameras) c. Machine tending, like tool changes or raw material replacement d. Packaging & Palletizing, where tasks are repetitive and involve small payloads e. Process tasks, situations that requires a tool to interact with a workpiece (eg. da Vinci System, built with robot arms and high-tech cameras to assist surgeons during operations.) f. Finish tasks, such as polishing and grinding The key differences between Cobot and Traditional robots are as below: 1. A Cobot can act as an assistant to a human operator and is typically used in applications working alongside human operators. Traditional robots are programmed to complete an automated task with very little or no human interaction. 2. Traditional robots are designed to do industrial tasks and Cobots are used in domestic & professional settings. 3. Cobots are built with safety for humans, these are built generally as rounded and lightweight materials, whereas Traditional robots are not built for humans to work next to them and could be highly unsafe as these are built as heavy machineries.
-
rohit chaudhary replied to Vishwadeep Khatri's topic in We ask and you answer! The best answer wins!Sandbox method is has proven to be an effective way to detect Malware in a safe virtual environment. However, sandbox evading malwares such as Locky, RogueRobin, Hawkball etc. have employed techniques which can detect if it's in the target environment or not. As per one study, published in apriorit.com, 98% of modern malwares deploy at least one evading technique, while there are more than 500 techniques now. Some of these techniques are such as, malware requiring run32dll.exe file to run which is not available in sandbox environment hence malware goes undetected. Another is where RogueRobin trojan looked for details such as BIOS version, memory & CPU cores to start affecting which are again aren't available in sandbox. Another one keeps detecting if it's connected to a debugger while collating host machine details. Majorly these techniques could be categorised into: user interactions, system analysis, environmental awareness, delayed execution and data obfuscation. To detect these techniques there are several techniques in use today, such as, 1. Prolonged Detection analysis, 2. Human interactions simulated, 3. Having real environmental artifacts like machine details, 4. Interact with malware like host machine till detected, 5. Having kernel analysis to detect malwares that impact rootkits and drivers at kernel space, 6. Using Machine learning to learn how malware behaves
