

Saurabh Dhaked
Members
-
Joined
-
Last visited
Everything posted by Saurabh Dhaked
-
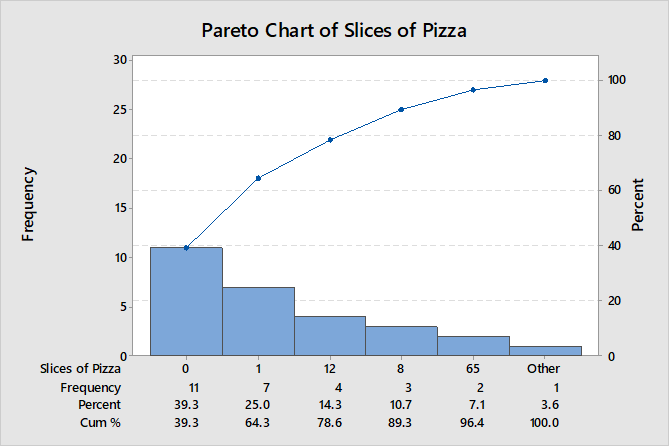
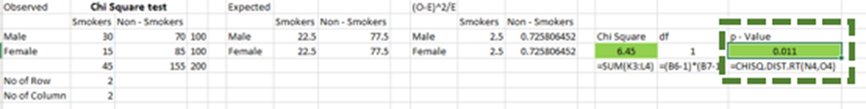
The Proficiency of Six Sigma Levels: The very purpose of Six Sigma in this real world is built a culture of Continuous Improvement and different levels of six sigma cater all such requirements by defining clearly roles & responsibility at each level which differentiated by belt level. Proficiency of Six Sigma Levels – Hierarchy Pyramid as follows: These levels are as follows: Six Sigma Master Black Belt Six Sigma Black Belt Six Sigma Green Belt Six Sigma Yellow Belt Note: Champion in this hierarchy pyramid is at the top and Six Sigma White Belt (at the bottom) is the basic tenets of 6σ philosophy. Roles of Six Sigma Levels: 1. Six Sigma Yellow Belt: This level is considered as foundation level of 6σ methodology and its place at the bottom of the hierarchy pyramid and just above to White Belt. Basic understanding of tools & stats are addressed through imparting of various Modules like: Ø Basic Statistics Ø 07 QC tools Ø Sometime, Advanced QC tools Ø Brief about Lean & its tools Ø RCA, Why-Why, Kaizen etc. Major Roles: Ø Participate in Improvement projects as member Ø Using of Problem Solving Tools & Techniques Ø General Purpose Control Ø Support to Green/Black Belt in Projects Ø Assist in Data-COPAI(Collection, Organisation, Presentation, Analysis, Improvement) Ø Root Cause Analysis Example: Suppose, we want to increase sales of Pizza for an outlet. Team has taken that challenge and initiated Six Sigma Black Belt Project. Hence, Primary role of YB candidate is to COPAI (Collection, Organisation, Presentation, Analysis, Improvement) by using various tools and techniques like Checksheet, Brainstorming, Fishbone diagram, Scatter plot, Control charts, Graphs etc to draw meaningful information and assist Green Belt candidate(who is also the part of same project). Example as follows: Pareto Analysis : Slices of Pizza vs Order Frequency 2. Six Sigma Green Belt: Once you are YB certified, you are eligible to up your level as Six Sigma Green Belt. GB candidates are closely associated in Six Sigma project and work under supervision of Black belt certified person. Having said that, their level is higher than YB hence they are well equipped with advanced level of statistical tools and gone through proper DMAIC methodology training. Major Roles: Ø Compile all information and analysis by YB candidate Ø Support to BB in Business Impact Project Ø Using of DMAIC Cycle and its presentation Ø Using of Advanced level of Statistics tools like Hypothesis, MSA etc. Ø Individual GB Project as Lead Ø Lean advanced tools like VSM etc. Example: Continuing the same example as above – Pizza Sales We can check whether sales: Is there any association between gender or not. Hence, GB candidate wants to test this hypothesis by selecting appropriate hypothesis test. In this case, he selected Chi Square test and will check p-value and draw inferences. 3. Six Sigma Black Belt: This is most valuable certification in the hierarchy pyramid and typical business impact project is driven by Six Sigma black Belt certified candidate. In this program, BB candidate is equipped by well versed and highly advanced statistical tools and using of Minitab. Leader of teams implementing the six sigma methodology on projects. Major Roles: Ø Highly advanced Statistical Tools & Techniques well versed Ø Ability in Design Thinking Ø Support to GB projects and leads Ø Assist to MBB Ø Using of Statistical Software i.e. Minitab Ø Imparting Training to YB & GB Candidates Ø Help to identify Business Pain Area and GB Projects Example: In the same Pizza sales example: Pizza taste & Sizes are one of the significant factors. Now as Black Belt – Many factors are changed simultaneously from one run to another run and the resulting change in response is studied using statistical techniques, Hence BB will go of DOE (Design of Experiment) to determine the optimal settings of the factors to minimize/target/maximize an output. 4. Six Sigma Master Black Belt: The MBB is responsible for translating the high level business goals into a Six Sigma strategy for the division and the associate functions. He works with the deployment leader to achieve the former. They also lead the development of the Six Sigma skills in the organization, for Black Belts, Green Belts, and the general associate base. MBB’s are responsible, together, for the success of the overall Division’s Six Sigma effort. They coordinate and lead activity on key cross-division value streams (e.g. Customer Service, Cycle Time, Research, etc). They also ensure that a culture that values openness, creativity and challenging the status quo develops in the organization. Major Roles: Ø Six sigma strategy and roll-out plan in the organization/function Ø Manage Project of the function Ø Mentor Teams Ø Achieve Lean Six Sigma Results Ø Cross-Functional Leadership Ø Project Execution and Removing Roadblocks Example: In same example – Pizza Sales: MBB will seek the approval from Top management for the DOE Trail and associate cost. Likewise many more assistance to Top management as well as mentoring to BB.


-
Heatmaps are used for the visualization purpose by using colours to represent various parameters and also demonstrate data in 02 dimensions. A heatmap is widely used in statistical analysis and make ease to draw inferences. Hence, it is one of the best data visualization tools while using Tableau, Power BI, ML etc. It shows the relationship between 02 factors on different axis (01 on X and other on Y axis) by using colors and gradient and also give us compressive picture of the data set. Nowadays, Heatmaps are used in various situations, applications or can say in every industry as it doesn’t take a long time to understand. Example of Heatmap: Suppose, we are working in the organization where they are in Poultry business. They want to analysis low profit reasons especially high mortality rate in chicks and want to initiate operational improvement project. First step to collect the data and freeze the target say in our case it is from 5% to1%. Now before deep dive into analysis phase, I would like to visualize the problem by using visualization tools like Heatmap, graphs etc. to check any seasonality effects. Here, we plotted data into heatmap (Mortality rate Year and Month). It shows the problem propagates Year 2009 onwards and found high mortality rate in the month July, August, and September. These are the months of rainy season where mortality rate go up. Hence, team will do brainstorming further to counter such problems. In the simplest way, we can say that heatmap gives us visual ad to draw meaningful information by seeing colors gradients. Heatmap - Mortality Rate Years and Months Another example: Heatmap is used to show population density, web designing, no of clicks, medical reports, risk management, weather condition, traffic congestion etc.

-
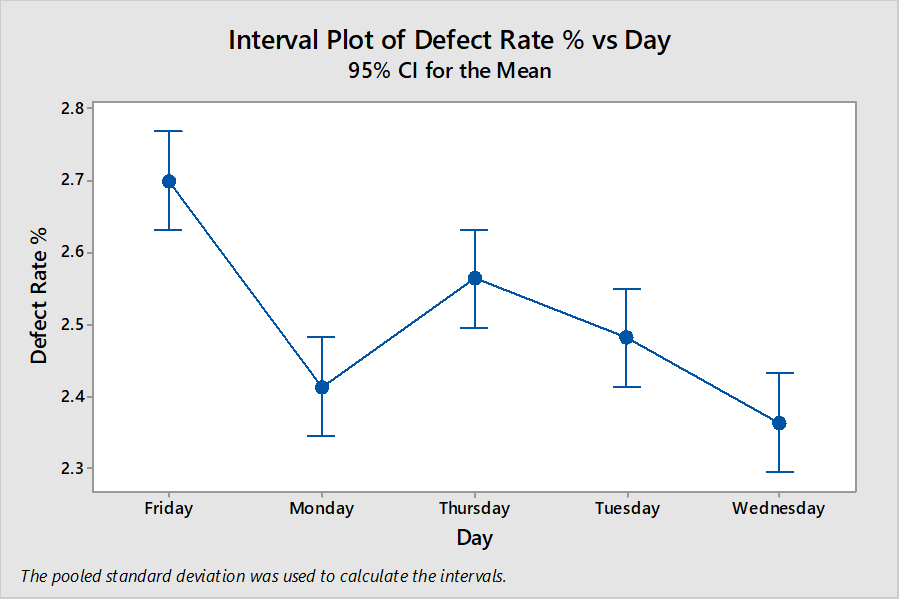
ANOM (Analysis of Means) is used to compare sample means with the grand mean (mean of the all samples) whereas ANOVA (Analysis of variance) is used to find whether sample means are equal or one of the pair is different. ANOM is preferred to differentiate between groups that is not the case in ANOVA. Let’s take an example for better understanding the difference between ANOM and ANOVA: Suppose, you are manager of manufacturing plant and tracking the defect % day wise. You want to analysis: is there any difference in the mean defect rate and which days are differ from others. In such case, we will use both ANOM and ANOVA. Let’s start with ANOVA analysis in Minitab: H0: All means are equal Ha: At least one mean is different After ANOVA analysis in Minitab, we got p value - 0.000 Inference: Accept the Ha, Hence At least one mean is different. But it is not showing which day is different from others means. Hence, ANOM come into picture which tells us which day (defect %) from the mean all days. ANOM is used 03 factors to analysis the data those are: 1. Sample Mean (Level Mean) 2. Grand Mean 3. Decision Limits Let’s take the same above example and this time, we will use ANOM to will see the results: Inference: Friday, Monday & Wednesday (%defect) are out of the decision limits. Red dot represents that there is significantly difference from the grand (overall) mean. Also, ANOVA is used for normal distribution whereas ANOM can be used for Normal, Poisson and Binominal Distribution

-
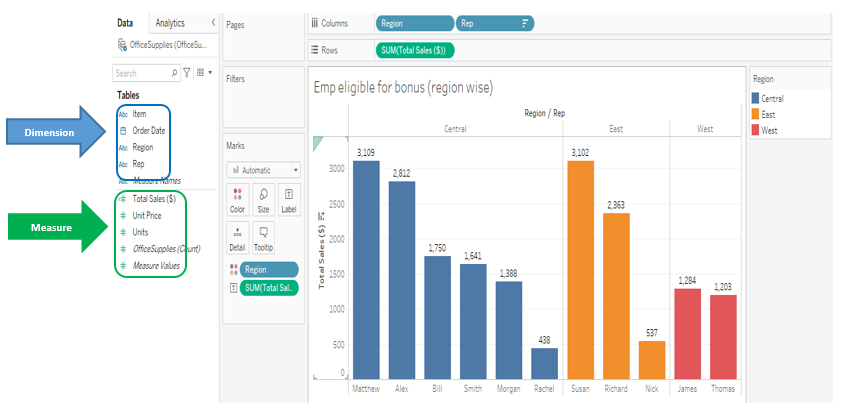
Like Data types in the basis statistic, we also have 02 types of data in the Data Visualization which are 1. Qualitative, 2. Quantitative So in the tableau, when we import data set from source, it gets divided into 02 category which are “Dimension” & “Measure”. Both factors play vital role in the data visualization. Dimensions represent Qualitative data like Name, type, Binary etc. Measures represent Quantitative data like Sales, Production, temperature etc. Dimension Measure Qualitative/Categorical Quantitative Cannot aggregate Can aggregate Field Blue Colour - Discrete Field Green Colour - Continuous Independent Variable Dependent Variable Min, Max, Sum not Work Will Work Duplication of the data is Possible Not Possible Not dependent on the measures Dependent on the dimensions
-
Yes, I do agree about the averages which are not always true still most of time we used the averages which tell us about central tendency of data. Average value is very sensitive for the outliers and will not represent actual picture of data set. Other Metrics are as follows: Metric When to use Example Mean No Outlier Average Temp in Winter Median Outlier Present Median Salary of IIM Mode Preferred Categorical Data Type of Pizza Selling Percentile Comparison & Outlier Present TAT for issuing of Insurance Policy Standard Deviation Minimize Variability, Measure of Spread Selection of Stock in Market Range Measure of Spread Heat Exchanger Temp range DPMO Checking Capability of Process/System for Discrete Data No of Defect in the HRC Sigma Level Checking Capability of Process/System for Discrete/Continuous Data Specification of Shaft 10+-.02 No of error in 1000 Documents Cp/Cpk, Pp/Ppk Capability performance with Specification Limit Customer Complaints How can we improve the performance metrics to reflect the actual feelings of the customers? What customer wants, can be reached to us through Specification Limit or through Voice of Customer (VOC). Our primary role is to convert VOC into CTQ through using of different metrics used in the above table. Also performing time to time customer survey, feedback and market understanding to get closer what actually customer wants and how to meet or exceed their expectations.
-
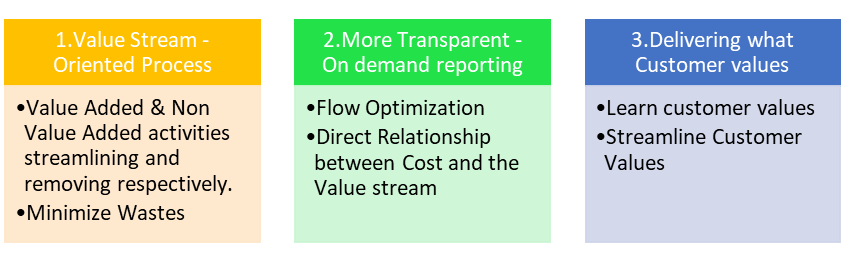
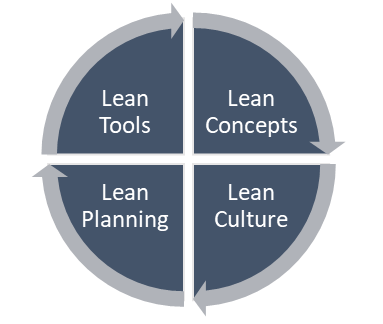
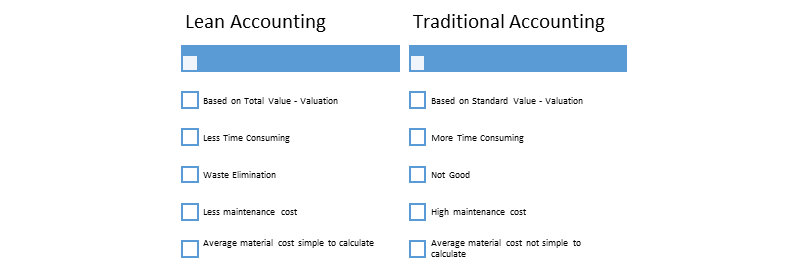
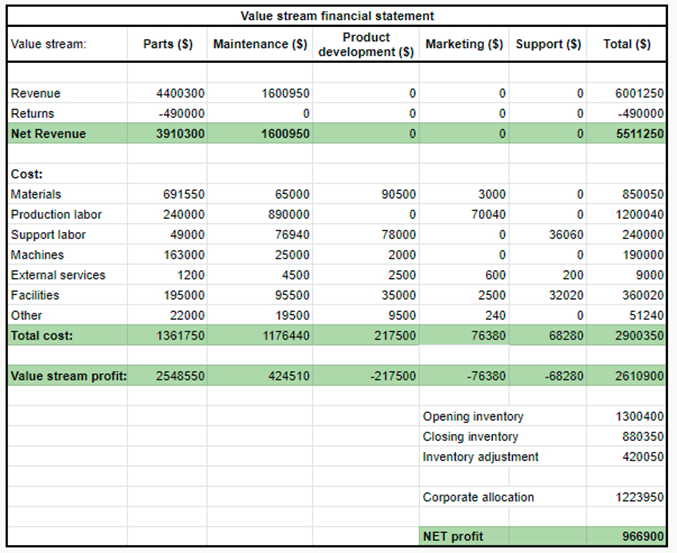
Lean Accounting The very purpose of accounting in any organization is to collect, analyze and draw a conclusion to make a decision on how to manage a business in good shape and Lean accounting is used to streamlining the process to maximize the profits. Lean Practices are adopted to optimize the accounting process and are used to eliminate non value added activities as well as waste in the process. There is always an argument between Lean accounting and conventional accounting practices keeping customer values in mind. A Lean approach to company accounting is a result of continuous improvement, just like all things Lean. Lean Accounting works based on 03 activities: Components of Lean Accounting: Example of Lean Accounting as follows: Inventory Valuation can be done either of the methods (Conventional vs Lean Accounting). Inventory Valuation through the conventional method is being done based on the standard cost which is assigned to each item in inventory whereas Lean accounting is mainly focused with the total value of inventory on the balance sheet instead Standard cost in conventional accounting. Also lean accounting companies have less pile up of inventory resultant maximize profits margin. Lean Vs Traditional Accounting Lean Accounting - Financial Statement Pros and Cons of Lean Accounting: SN Pros Cons 1 Cost Control – Minimize Waste and Increase profits Slow Implementation as done in small steps 2 Streamlining the Value Added Process Inventory Issue while meeting high demand 3 More and More with Less and Less High Cost of Implementation 4 Inculcate Lean culture Difficult to switch from traditional accounting 5 Best Practices in Financial management 6 Detailed and hands on knowledge of business costs and financial decisions

-
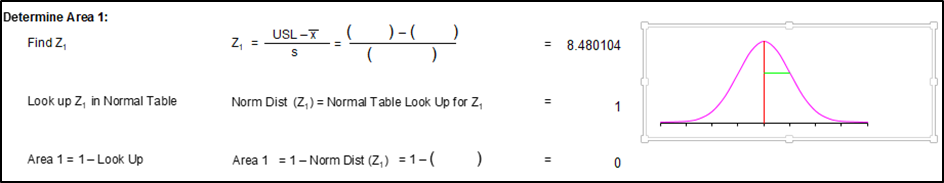
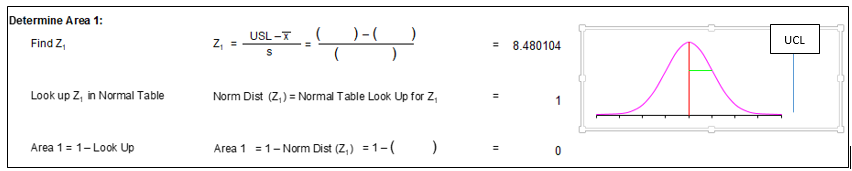
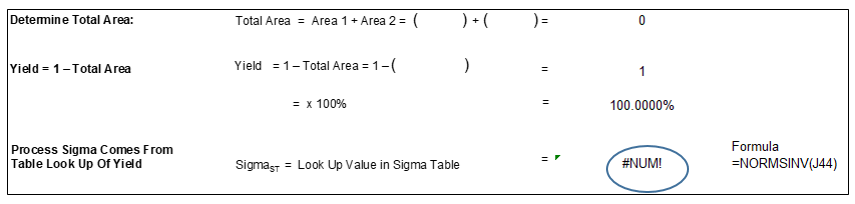
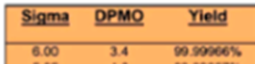
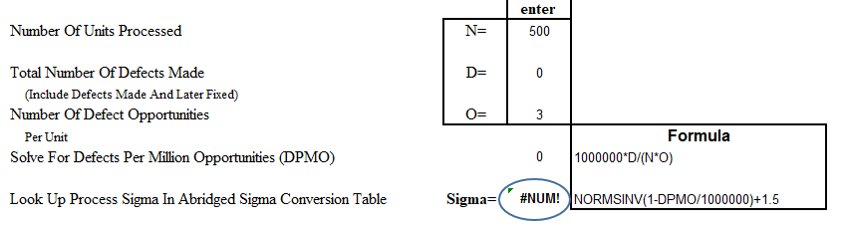
The Six Sigma level represents zero defects as 3.4 DPMO. Sigma level 6 and greater is considered generally an excellent process. But true zero defect is not possible. So I agree that Sigma level for a process can’t be calculated if there are zero defects. 1. Let’s take an example by using Continuous Data: Suppose, we have height data of African country citizens and based on sampling the average height is 6.7 Ft with standard deviation 0.153 and we are interested in Upper limit only and say USL is 8. What is the Sigma Level and whether is it feasible? X Bar – 6.7 s – 0.153 USL – 8 We are Skipping Area 2 as there is no LSL limit Determine Area 2: N/A As highlighted in the circle, Sigma Level couldn’t be calculated as UCL is very far away from the mean means close to zero defects. 99.9996% Yield @ 6 Sigma Level. Hence, 100% pragmatically not possible so as Sigma level also can’t determine. 2. Let’s take an example by using Discrete Data: Suppose we are HRC (Hot rolled coil) steel manufacturing company and our target to meet or exceed customer expectations. Steel market in India is booming and customer have lots of choices. So management decided to stringent the target which is zero defect. Before processing, they want to check Sigma level at zero defects and also current Sigma Level. No of Unit (N) – 500 Coils Total Defects (D) – 57 Defect opportunities per unit (O) – 3 DPMO = (D*1000000)/(N*O) = 38000 Sigma Level from Conversion Table – 3.27 If suppose defect is zero than calculate Sigma Level: Hence proved that if defect is zero, Sigma Level couldn’t be calculated. So Company will look to increase Sigma Level from 3.27 to 4 at the initial stage.
-
Customer Satisfaction is the one the CTQs for the organization at the all levels. Organization are looking at different improvement methodologies to get delighted their customers and meet their expectations and Six Sigma process proves the capability to control the process within customer specification that determine the accessibility of the process, service, product being manufactured or offered. Industries’ focus nowadays shifted to quality improvement activities especially in the service and manufacturing to reduce process deviation to meet customer demands. When I say variability that is meant to a) Process variation b) Measurement variation. To overcome such variability, we need to dive deep into statistics and Six Sigma served the purpose as it is statistical and scientific approach. Design of Experiment (DOE) is the one which deal with input factors responsible for the variations in the Output. 1. Objective of Design of Experiment (DOE) An Experiment in which purposeful changes are made to the certain parameters of a system so that one may observe and quantify the changes in the outputs in the most efficient way to meet our purpose. 1.1 Six Sigma majorly classified into 03 category by Pyzdek as follows: 1.2 There are 03 approaches for the Experimental Design: Ø Why is Shainin DOE considered a simpler alternative to Classical DOE? Shainin DOE approach is the simple and easy to understand among all approaches that why considered over Classical DOE. It is best to find vital few causes of Problem which have significant impacts and universally applicable across all type of industries. Shainin approach basically is considered to demonstrate continuous improvement by reducing issues to identify root causes and best part of this technique without using statistical software. In fact, Shainin DOE does not even require any knowledge of difficult statistical tools. Chronic Quality issues has been classified by Shainin Doe into 03 Xs which contribute over 80% of the variation altogether are as follows: 1. The Red X 2. The Pink X 3. The Pale Pink X Shainin believes in 02 strategy: 1. Vital Few 2. Talk to the Parts followed by Workers Comparison Table between Classical vs Shainin Characteristic Classical Shainin Tools and Technique Factorial DOE Full Factorial, Multi Vari, Paired Comparison etc. Statistical Knowledge High Almost Low Complexity High Low Ease of Implementation Moderate High Cost Moderate Low Time Moderate Low Effectiveness Moderate Highly Risk associated with the use of Shainin DOE 1 Limited use in case of complex problem 2 Not best in term of Low to Moderate Volume Production 3 Less Effective for the controllable Factors 4 No use of statistical Tools 5 Less effective when high degree of optimization required 6 Unsubstantiated and Exaggerated Conclusion: Shainin DOE gives edge over the 02 DOE approaches within the world of Six Sigma DOE.


-
The Juran Trilogy As we know it today, Quality has become a paramount concern and survival for the organisations in the cut throat competition. Organisation started focusing on the Quality and its concept widely popularized by Japanese Quality Guru and many others Gurus like Deming, Juran etc. Deming considered the father of quality by many and given a cycle called PDCA (Plan - Do - Check - Act) which have been the most powerful and influential. The methodology is called Deming Cycle. In 1960s, 07 QC tools has been introduced by Ishikawa and these tools are being used for problem solving and almost 80-85% problem could be analysed and solved by using them. In the continuation, one of the Quality Gurus Dr Joseph M Juran's contribution would be always remember in the world of Total Quality management (TQM). Dr Joseph Juran has developed The Juran Trilogy which is an improvement cycle that is addressed to reduce the cost of quality or can say cost of poor quality into process/product/service at the all levels. Earlier, the conventional thinking was to focus on quality control but nowadays this Trilogy has become essential part for most of functions and management best practices around the world as well as customer oriented. The Juran Trilogy represents the 03 elements: 1. Quality Planning: It is planning stage which have major activities such as Ø Identity who your customers are Ø Determine Voice of Customer (Needs) Ø To define Critical customer requirements Ø Convert CCR into CTQ Ø Create plan for Process or system to meet these requirements Ø Execute the Plan 2. Quality Control: To control the process for achieving consistent outcome over the period of time by meeting customer specifications. It can be done by using SPC(Statistical Process Control), Control charts etc: Ø Find out what are the needs to measure Ø Determine quality performance parameters Ø Set and compare goals with your performance Ø Do gap analysis Ø Act on the gap analysis findings 3. Quality Improvement: Continuous Improvement is the activity which carries out by most of companies nowadays to remain competitive and become part of culture. Ø Identify specific areas in need of improvement, and execute improvement projects. Ø Focus on Proactive approaches Ø Identify Breakthrough Projects Ø Focus on innovative and technological advancement project Ø Establish Team and execution plan for Improvements Ø Control to sustain the Gains The Juran Trilogy The World Competition in Quality The Juran Trilogy Example: Let’s have an example from Steel Industry where Juran Trilogy been used successfully. Quality related issues became crucial concern for the one the steel industries in India as customer has got lots of choices to buy steel from different industries within India. Hence, same steel company has decided to improve quality by using The Juran Trilogy: The contribution of one of the quality issues was around 1.6 % of total production and it was huge as we need to pay heavy compensation or can say very high cost of poor quality. 1. Quality Planning: Here, 1st through Pareto charts, we are able to find major contributor as far as concern about quality issues and in second stage we are able to find impacted customers due to poor quality and through feedback and customer survey, finally we got voice of customer and CTQ parameters. 2. Quality Control: In this stage, we identified the metric which was % of rejection and set business limits to keep in view specification limits. At the early stage while checking the performance we found few outlier or spikes the control charts and decided to investigate 1st found obvious reason which was system up gradation. Our target was to reduce by 50% from 1.6% to 0.8%. Once target set, do brainstorming for the potential causes and their solutions and implementation of solutions followed by sustenance plan. 3. Quality Improvement: Focus shifted to reduce chronic waste and to reduce variation through tightening the control limits by improving process further. Process FMEA been revised as a proactive approach and we get some breakthrough projects. Our technology has been outdated and need to go with new technology advancement. So we have made design changed as well as upgrade system which help us to redefine our control limits with improved Cpk 1.3. Later process has been standardized by creating control plan and modified SOPs.


-
Disney Creative Strategy is the one of strategies in which our dreams convert into execution or better to say successfully execution. This concept was inspired by Mr W Disney and since than became popular and followed by many business leaders. Ideas through dreaming are very similar like having brainstorming to identify number of the problems when we clubbed multiple dreaming altogether and than apply PDCA for the continuous improvements and practical meanings. This strategy is divided into 03 stages: 1. Dreamer 2. Realist 3. Critic In the next session, we will see all stages in details: 1. Dreamer: We all have dreams that may be good, bad, others. Having dreams are not an issue but not to chase them would definitely left question on you and shows your characteristic like lack of grit, determination, enthusiasm etc. If you have meaningful dream than try to convert into reality despite odds are not with you but you can give at least a genuine try to make it possible. Hence, that is the idea behind Disney Creative Strategy. First step to ask their employees to share their dreams and jotted down all the ideas into one sheet. Second Step to screening the multiple ideas and find potential ideas like we do in the problem solving methodologies through multivoting method. The very purpose to filter out ideas to stay focus on critical potential ideas and validating the ideas through process knowledge and data support and scoping of ideas would increase your success rate also. Once that activity is performed, we are ready to move on next step and at that point we are clear about our need, desire and associated solutions. 2. Realist: This step is the real challenge in the Disney Creative Strategy as we need to convert our dreams into reality. If you saw dream and don't act on it than all went in vain. Now, we have shortlisted dreams and our aim to evaluate action plan on them to make them happen at the work place. We need to formulate RACI for the every shortlisted dreams and a solid action plan to execute. So at that point we are pretty much clear about what is our action plan with timeline and method to assessment of the Ideas. 3. Critic: In the first 02 stages, We have dreams and shortlisted potential dreams or ideas and make action plan with timeline and its evaluation method. 3rd stage is Critic in which we need to have proactive approach if anything goes wrong in plan or action. Like we use PDPC(Process Design Program Chart) as advanced QC tools to check What could go wrong in process? same we did in this stage. In such scenario, we should have risk mitigation plan and associate counter measures and robust plan to be successfully implementation of Ideas into reality.