

Johanan Collins
Members
-
Joined
-
Last visited
Everything posted by Johanan Collins
-
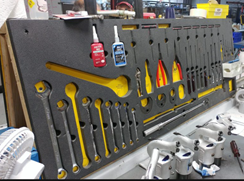
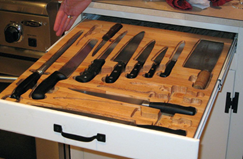
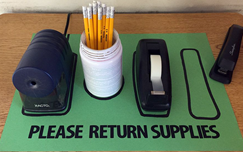
Johanan Collins replied to Vishwadeep Khatri's topic in We ask and you answer! The best answer wins!Shadow Boards The idea of Shadow Boards is an off-shoot of the 5S Lean Manufacturing Methodology. The implementation of 5S is generally the first step to reduce waste since it can be taken as independent, localized continuous improvements projects. Approvals for 5S Projects are at the lower level and even the individual level, hence they can be quickly implemented. ASQ defines the 5S process as follows • Seiri: To separate needed tools, parts, and instructions from unneeded materials and to remove the unneeded ones. • Seiton: To neatly arrange and identify parts and tools for ease of use. • Seiso: To conduct a cleanup campaign. • Seiketsu: To conduct seiri, seiton, and seiso daily to maintain a workplace in perfect condition. • Shitsuke: To form the habit of always following the first four S’s. Shadow Boards are applicable to the Second S of the 5S process. The Second S is to neatly arrange and identify parts and tools for ease of use. Shadow Boards are Boards that have either an outline, indentation, or painting of the tool or part that has to occupy that place. Some organizations may even use a wall as a shadow board. It is based on the concept, a place for everything, everything in its place. Shadow boards would not only save the time of retrieval, but it's location would also ensure ease of retrieval. New staff would find it easy to settle down into offices where shadow boards are used. Most importantly shadow boards would help the organization and individual to imbibe a culture of safety in the working environment. Shadow boards can be used at home, in offices, in factories, and various other workplaces. I have seen musicians using shadow boards to keep their musical instruments. References https://asq.org/quality-resources/lean/five-s-tutorial https://toolkeepers.com/portfolio-item/foam-shadow-board-honsa-tools/ https://www.national-engravers.co.uk/shadow-boards/mobile-shadow-board-5s/ https://www.pinterest.com/pin/333055334929155513/ https://www.pinterest.co.kr/pin/10766486586046608/


-
Johanan Collins replied to Vishwadeep Khatri's topic in We ask and you answer! The best answer wins!Heinrich's triangle Heinrich Triangle or Bird Triangle is also called the Accident Triangle. It is used in the prevention of industrial accidents and shows the relationships between near misses at the bottom of the triangle, minor accidents in the middle, and more serious/fatal accidents at the top of the triangle. The theory is that if the number of near misses is reduced, the proportional minor accidents and serious/fatal accidents will reduce. In the Swiss Cheese analogy, the increase in the number of slices will lead to the reduction of direct holes passing right through the block of cheese leading to a reduction in the number of accidents. This theory was first proposed by Herbert William Heinrich (1931). He studied about 75,000 accident reports that occurred at the industrial sites and from the insurance reports. The theory was fine-tuned by Frank E Bird by studying about 1.7 million industrial accidents. This is about 22 times the accidents studied by Heinrich. The resultant Accident Triangle from the study is widely used in Industrial Health and Safety programs. Who was Heinrich? Heinrich was an Assistant Superintendent working in an insurance company. His study was aimed at reducing the number of industrial accidents. He found that the ratio of the major injury accidents: minor injury accidents: no-injury accidents was 1:29:300. His logical conclusion was that the reduction of minor accidents will naturally lead to a reduction of major accidents. This ratio is depicted as the Heinrich Triangle. Heinrich’s Triangle in our Daily Life. Heinrich’s Triangle finds natural and logical use in our daily life. If we take concrete steps to make our living environment at home and office at office safe, it would naturally lead to the probability of major accidents reducing. For example, ensuring that the maintenance schedules of your car or other mechanical devices are carried out as per schedule, will lead to a reduction in accidents. One can say that following Heinrich’s Triangle in our personal lives would lead to a culture of safety in our near proximity. References https://en.wikipedia.org/wiki/Accident_triangle
-
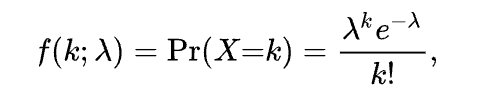
Johanan Collins replied to Vishwadeep Khatri's topic in We ask and you answer! The best answer wins!The Poisson Distribution is named after the French mathematician Simeon Denis Poisson. It is a discrete distribution that gives the probability of the number of events in a fixed interval of space, time, distance, volume, area, etc. These events should take place independent of each other and at a constant rate. The Poisson distribution is generally used where the number of events is very large and the occurrence of these events is rare. In simple terms it can be described as the average rate at which a specific event happens in a specific time frame, the event will follow a Poisson distribution. Assumptions k is the number of times the event can occur (k= 0,1,2,3,…..) The events are independent of each other The average rate at which events occur, are independent of the occurrences and may vary with time. Two events cannot occur at the same time. Examples The number of calls received in a Call Centre every hour. The number of decay events that occur from a radioactive source every day. No of Accidents in a day on Highway No 4. The number of meteorites greater than 0.5-meter dia that strike Earth in a year. The number of customers arriving at a Mall between 8 and 9 am. Number of Tsunamis that hit the East Coast of India in a decade Number Goals in a match. Number of Injuries in a football match. Number of Hat tricks in a cricket match Examples that are not Poisson Distribution The arrival of students for a class The arrival of spectators for a match. These are not Poisson Distributions since the rate of arrival is not constant and the events are not independent of each other since students and spectators come in batches. Occurrences of earthquakes may not follow a Poisson distribution since the aftershocks may not be independent of each other. Formula The formula for Poisson distribution is Where k is the number of occurrences, e = 2.71828 (Euler’s Number) Lamda = E(X) [The mean] = Variance(X) Lamda can also be taken as the rate for the number of events. Poisson Distribution in Management Poisson Distribution is generally used to improve operational efficiency. Poisson Distribution is used in Queueing Theory as the arrival rate, whereas the Exponential Distribution is used in the Service times. Managing Demand. Study of the demand through the Poisson Distribution can help in developing complementary services, managing the reservation system and overbookings such as in hotels and airlines, segmenting demand, offering price incentives, or promoting off-peak demand. Managing Supply. Similarly, the study of the supply can help in sharing capacity, take decisions on cross-training of staff, using part-time employees, increasing customer participation, scheduling work shifts, or creating adjustable capacity. References https://en.wikipedia.org/wiki/Poisson_distribution
-
Johanan Collins replied to Vishwadeep Khatri's topic in We ask and you answer! The best answer wins!Escape Point Escape Points is one of the eight steps of the “Eight Disciplines of Problem Solving” The 8D methodology was made popular by Ford Motors. The logic used in 8D is similar to the PDCA Cycle. The main goal of 8D is in the identification, correction, and elimination of problems that occur recurrently. It uses various analytical techniques including Statistical Analysis to determine the root cause of the problem. The eight steps of the 8D process are “Preparation and Emergency Response Actions”, “Use a Team”, “Describe the Problem”, “Develop Interim Containment Plan”, “Determine and Verify Root Causes and Escape Points”, “Verify Permanent Corrections for Problem that will resolve the problem for the customer”, “Define and Implement Corrective Actions”, “Prevent Recurrence / System Problems”, “Congratulate the Main Contributors to your Team”. Step 4 of the process “Determine and Verify Root Causes and Escape Points” involves identification of the root cause and taking steps to permanently eliminate it. During this step the Escape Point needs to be determined, i.e., the point closest in the process where the root cause could have been found but was not. Root Causes are generally grouped under Occurrence, Escape, and Systemic. The Occurrence Root Cause is the specific cause that resulted in the problem. It is the factor that brought about a change in the process. The escape root cause is the reason or cause as to why the problem escaped detection, the systematic root cause is the broader reason/cause that is responsible for the local cause or reason. It requires long-term corrective action. Escape points need to be identified during the Root Cause Analysis. The Escape Points can be controls that are currently in place in the process flow to detect the problem but have failed and allowed the problem to escape. Some examples of this can be audits, tests, sign-offs, etc. The Escape points in the process flow could also be blind spots. The points where the problem could have been detected but no controls were in place for its detection. https://en.wikipedia.org/wiki/Eight_disciplines_problem_solving https://quality-one.com/8d/
-
Johanan Collins replied to Vishwadeep Khatri's topic in We ask and you answer! The best answer wins!RICE The Rice scoring system is a prioritization framework that uses four factors viz, Reach Impact, Confidence and Effort to arrive at a decision. Being a quantitative prioritization technique, it relies more on data and removes the subjective and feeling aspects of decision-making. Reach is the number of people the initiative will reach in a given time frame. It is a number that is estimated by the team. An example of reach is “our project is expected to bring in 250 customers in the next month” or “our initiative is expected to bring in 100 customers in the next quarter”. The Reach would be 250 in the first case and 100 in the second case. The Team decides the definition of Reach and the best time frame. For example, Reach could be a number of customer transactions, trial sign-ups, users. The reach should generally use real measurements for the products metrics rather than wild guesses. Impact is more difficult to measure since the project cannot be isolated, hence it would be difficult to ascertain the impact of the project among other reasons and determine the primary reason why a certain action was taken. Intercom had developed a five-tier system to measure impact with 3 being massive impact, 2 high impact, 1 medium impact, 0.5 low impact, and 0.25 minimum impact. Confidence is a balance between data and gut feeling. The team may have data on Reach and a gut feeling about Impact or vice-verse. It is the Confidence score that will draw a balance between the two. Intercom set up a tier set of percentages to mark confidence with 100 percent meaning high confidence, 80% medium, and 50 % low confidence. A confidence score of below 50% is considered bad. Effort in this framework is similar to scoring Reach. It looks at the qualifications and number of people required for the project and is measured by Intercom as Person Months. If a Project takes 5 Person Months, then the Effort score is 5. Intercom takes anything less than a month as 0.5. Say 1 Week of planning, 1-2 Weeks of design, and 2-4 weeks of engineering time will give an effort score of 2 person-months. Putting the four factors together, the RICE formula would be as follows: - RICE = (Reach x Impact x Confidence)/Effort The numerators of the RICE formula viz. Reach, Impact and Confidence are considered as the expected benefits and the denominator viz Effort as the potential Cost. It is hence very similar to a Cost Benefit Analysis. The RICE score is the total impact per time worked. The team needs to do it for each project and compare the numerical values, to prioritize the project. My Thoughts. In a setting similar to Intercom, it would be a consistent framework to help teams objectively evaluate the relative importance of their initiatives. While looking at the score as a whole, the Team would be advised to look at the Numerator (RIC) and the Denominator (E) as two different scores. This would prevent the team from overlooking a good project with high benefit (RIC) just because of the Effort being high. In doing so, the Team can take on projects with low Effort as Kaizen Projects and with low Effort as DMAIC Projects. https://www.productplan.com/glossary/rice-scoring-model/
-
Johanan Collins replied to Vishwadeep Khatri's topic in We ask and you answer! The best answer wins!Time management is one of the essentials to stress-free living in modern times. Timeboxing is one of the several time management strategies in use to increase productivity such as Time blocking, Pomodoro method, Eat the Frog, Pareto principle, Getting Things Done (GTD). All of these primarily are tools to make the most of available time and achieve the set goals be they organizational or even individual goals. Timeboxing, creates a visual and realistic deadline to ensure that work gets completed. In Pomodoro, work is addressed within short time frames with breaks between working sessions, Timeboxing only allots the time and the work to a unit. However, one can move a step up from Timeboxing to Promodora. An “Eisenhower Matrix” may be performed to distinguish between tasks that are most urgent, not urgent, most important, and not important. The Pickle Jar Theory serves as a visual to set priorities by determining what is important and what is not important. From here one may move on to attacking the important and onerous jobs before settling down to less complex and easy ones as is done in” Eat the Frog” strategy. Often Timeboxing may not necessarily specify the types of tasks to time frame, they do provide the initial impetus and one may do a Pareto and get the easy ones out of the way. This is a great booster and it gives a feeling of accomplishment but one may not feel so, unless the timeboxing initiates the Pareto. Timeboxing does not however do not block-off related work from the set periods in the calendar this is done in Time blocking. Timeboxing is performed before employing Parkinson’s law. After allotting a time box for a particular task, divide them up by the amount of time it takes to complete them. Thereafter allot only half that time to complete each task ensuring it is completed within the deadline. Timeboxing also the is the first step before implementing Tony Robbins' Rapid Planning Method (RPM), which is a way of conditioning the brain to stay focused on the goal set. Benefits of using Timeboxing It helps the team to know how much time is left for a task's completion and clearly displays progress to the entire team throughout the life of the task. It gives a bird’ eye view of work on a calendar in relation to other tasks and objectives as it takes into consideration the amount of time needed to complete all steps for a particular work item. As the tasks are broken down into chewable bites it gives a feeling of manageability, keeping teams focused on the right priorities. Its visual nature tells the team their respective tasks, any potential delays or barriers that must be tackled. An overabundance of review meetings are avoided as it proves stakeholders and executive sponsors up to date on project status without the need to schedule. Disadvantages of Timeboxing Quality may sometimes be sacrificed due to the high priority placed on reaching deadlines. It is time-consuming to make lists and plans and is not flexible. It can be stressful when deadlines set are not met and it may be difficult to stick to plans needing a steep learning curve. References https://projectlifemastery.com/plan-your-day/ https://www.lifehack.org/articles/featured/how-to-use-parkinsons-law-to-your-advantage.html https://slab.com/blog/eisenhower-matrix/ https://upraise.io/blog/timeboxing-increases-productivity/
-
Johanan Collins replied to Vishwadeep Khatri's topic in We ask and you answer! The best answer wins!Jishu-Hozen means autonomous maintenance in Japanese. Jishu is translated into ‘independence or autonomy’ and Hozen is translated into ‘integrity, conversation or preservation’. It removes the concept of division of labor between the operator and maintainer. It may however require some multi-skilling and more skilled operators. Jishu-Hozen and TPM. It is one amongst the eight pillars of TPM, the others being Planned Maintenance, Quality Maintenance, Early Management, Safety, Health & Environment, Focussed Improvement, Training & Education, TPM in the Office. Objectives. The main objective is to train the employee to maintain the performance of his equipment. It is based on the operator-maintainer concept and prevents the operator from passing the buck for poor quality onto the maintainer. Jishu-Hozen takes advantage of the fact that generally the operator knows more about his equipment than the maintainer and can do the basic, daily and routine maintenance tasks such as tuning, inspection, cleaning, lubrication, etc. Benefits. This daily maintenance not only increases the machine life but also improves its performance thereby reducing variability in the process and defects. Jishu-Hozen could thus help in improving quality, improving profitability, reducing defects, reducing Mean Time to Repair, Increasing Mean Time Between Failures, increase ownership and skill level among operators, check for deterioration of the equipment, keep machines in optimal working condition, reduction of minor stoppages, eliminates failures, and develop personnel. TPM and Indian Navy. The Indian Navy uses the system of Planned Preventive Maintenance. This maintenance is either done by the operator on a periodic basis. This is followed by some maintenance schedules being carried out by the onboard technical staff. These tasks are generally carried out when the ship is at sea. After a certain period of time, the ship is given a Self-Maintenance Period. During this time the ship staff consisting of the operator and maintainer do maintenance of the equipment. Every third Self-Maintenance Period is an Assisted-Maintenance Period wherein the ship staff and the Fleet Maintenance Unit Staff carry our more major maintenance routines. Modular Design. The modular design of weapons and sensors on the ships enables ease in the implementation of the operator-maintainer concept. This is similar to the Design for Six Sigma.
-
Johanan Collins replied to Vishwadeep Khatri's topic in We ask and you answer! The best answer wins!Why Because Analysis Why Because Analysis is used for analysis of Accidents in various scenarios such as marine, rail, road, air etc. The advantage of WBA is that it can be used independent of the domain. It is a posteriori analysis method. WBA analysis increases the objectivity, reproducibility and reduces the falsification of the results. WB Graph. The results are depicted in a Why Because Graph which shows the causal relationship between the factors of the accident, with the nodes being the factors. The cause-and-effect relations are depicted by the directed edge. Process. It starts with the question – what is/are the accident/accidents? The causes of the accidents are then determined in an iterative process. Formal tests are then examined with respect to all potential cause and effect relationships. This iterative process continues till the time a result has been determined. The contributing cause i.e the related factor at each node i.e. the factor must be necessary to cause the accident and putting all the causes together should have caused the accident. Formal Test. There are two Formal Test viz the Counter Factual Test (Counter to the Fact) and the Causal Sufficiency Test. Counterfactual Test. The Counter Factual test asks the question; would the effect have happened without this cause or in other words does the cause actually contribute to the effect. Hence A is a cause for B if, and only if, had A not happened B could not have happened. A is the Necessary Causal Factor for B. The Counterfactual test does not answer is A is the only cause of B. A alone may not be sufficient and other causes may be required for B to occur. Causal Sufficiency Test. The Causal Sufficiency Test asks the question; are the listed causes sufficient for the effect to take place. This helps in identifying other causes. A correct WBG would require a positive CT and positive CST. This means the listed causes are sufficient, i.e. nothing is omitted (CST) and every cause is necessary (CT). Causal Chains and Sufficiency of Cause A Simple Causal Chain A More Complex Causal Chain Examples Fukushima Dia-Ichi runaway nucelar Reaction. Factors – Tsunami, Tohoku Earthquake. Collision of the Titanic. Factors – Excessive speed, Night, Life Boat Capacity, thought that the ship was unsinkable, unable to evade the iceberg. Car Safety System. Factors - Anti-Skid, Anti-Lock Brakes, Air Bags etc. In order for a fatal crash, a number of these systems have to fail. References https://en.wikipedia.org/wiki/Why%E2%80%93because_analysis Introduction to Why-Because Analysis Dipl.-Inform. Jan Sanders Computer Networks and Distributed Systems Group Technical Faculty, Bielefeld University mail: [email protected] web: www.rvs.uni-bielefeld.de in Association with Causalis Limited mail: [email protected] web: www.causalis.com February 1, 2012
-
Johanan Collins replied to Vishwadeep Khatri's topic in We ask and you answer! The best answer wins!ABC Analysis is used for Inventory Control. There are other Inventory Control models such as FSO (Fast, Slow, Occasional) which is based on the demand or usage of the item, VED (Vital, Essential, Desirable) which is based on the criticality/risk/strategic importance of the item. Inventory Decisions. Inventory policies such as safety stocks, inventory levels, audit, checks, level of control, number of suppliers, Review Policy, etc, are decided based on the category an item is placed into. How to do an ABC Analysis. A Spreadsheet of the Item Code, Cost of Purchase and Issue details (consumption) of the item is available. The consumption value for each line is obtained by multiplying the Purchase Cost with the Issue Details. These are then grouped by the Item Code to get the Annual Usage Value per Item Code. Since the procurement cost of an item may vary throughout the year, this is one of the methods that could be used. An alternate method would be to multiply the Average Procurement Cost with the Annual Usage. The data is then sorted on Annual Consumption Value in descending order. Finally, Pareto’s Principle is used to divide the items into the A, B and C Categories. The A category would generally contain 10 – 20% of the items which would generally account for 70 – 80% of the Annual Consumption Value. The C Category items would generally contain about 50 to 60% of the items and would account for about 5 to 10% of the Annual Consumption items. The B Category items would constitute the remaining items that fall in between the A and C categories and would constitute about 15 – 25% of the value. Since the A items are of high value and a few items, the control of these items are generally done at a higher Management level, whereas the C items being of lower value and in a large number, the control of these items are done by the clerical staff. Problem with ABC Analysis. ABC Model of Inventory Management is based on the Annual Consumption Value of the items. This only takes into account the cost and the consumption of the item. A critical item with low consumption would be classified as a C category item and not get the required priority in its management. Similarly, an item that has a low consumption and is of strategic importance to the company may land up in the C Category. Furthermore, there is a risk of items which affect the profit of the company, or items with less no of suppliers or items which are complex in nature to land up in the C Category. Leverage items and not-critical which are cheap, have a large number of suppliers and easier to manage. These items generally get classified as A Category items due to high consumption levels. These items could be easily managed at lower levels having controls in place to ensure their management. How to Overcome the Problems with ABC Analysis. ABC Analysis used independent of other systems would have the inherent problems elucidated above. ABC and VED. Combining it with the VED Analysis would avert the problem of classifying critical items as C Category and giving priority to the Vital and Essential Items. Also, the management could have a relook of the Desirable items that fall into the A Category. These expensive or high consumption items in the Desirable Category could be reassessed for their requirement. ABC and Kraljic Matrix. Combining the ABC analysis with the Kraljic Matrix would focus attention not only based on the Annual Consumption Value but also asking questions such as – Are these items of strategic importance, are these items Bottleneck items or Leverage items or non-Critical items?
-
Johanan Collins replied to Vishwadeep Khatri's topic in We ask and you answer! The best answer wins!PEST Analysis is a tool used to analyze the Political, Economic, Socio-Cultural and Technological environment that an organization operates in. It can also be used before a company enters a new geographical market. Political · Elections: When are the next elections, which parties are likely to win. What are the different political party’s stances? · Is the country politically stable? · Is the judicial system fair? · What are the laws in regard to copyright, property rights? · What new laws are on the books? · What are Business Regulations? Economic · Is the economy stable and growing? · What is the average disposable income in the country? · Is the unemployment rate at a manageable level? · Is the country part of an economic block? Socio-Cultural · What is the age profile of the company? · What is the population growth rate? · What is the average education level in the country? · What are the religious beliefs of the population? · What are the taboos and social attitudes? Technology · What are the new technologies that your company can use? · Are there any technological breakthroughs that will affect your business? · Are there infrastructure changes that will change how work is done? · What is the technological level of the competitors? Sources: https://www.mindtools.com/pages/article/newTMC_09.htm
-
Johanan Collins replied to Vishwadeep Khatri's topic in We ask and you answer! The best answer wins!SQDC stands for Safety, Quality, Delivery, and Cost. The SQDC board is located in the process area. The board measures how the processes are doing in regard to the areas of safety, quality, delivery, and cost. SQDC boards need to be checked on a daily basis by the management/leadership in the company. Each category in the SQDC board is tracked by two colors, Green and red. Green indicates success or goals being met while red indicates failure or errors which require the attention of the leadership. Each criterion is in the form of the corresponding letter (S for Safety), with 31 numbers pertaining to each day of the month. If the day has an issue, it is colored red, while if the day has no issues, it is colored green. As we can see SQDC board is an effective visual method for process management. Source: https://www.leansixsigmadefinition.com/glossary/sqdc-2/ https://theleanwarehouse.wordpress.com/2020/04/08/striving-for-continuous-improvement-with-sqdc-boards/
-
Johanan Collins replied to Vishwadeep Khatri's topic in We ask and you answer! The best answer wins!Bowling Chart is a visual method to monitor Key Performance Indicators or KPI’s. It is an easy and simple method to compare the organizations actual metrics to the goals and targets the organizations have set. It is called a Bowling chart as it resembles the scorecard of a bowling game. The Bowling Chart consists of two rows for each KPI, the target value and the actual value. The chart consists of three colors · Green: The team has met or in some cases surpassed the KPI’s. · Yellow: The team has met some secondary objectives but not the main KPI. · Red: KPI’s have not been met and the team is underperforming. The bowling chart with its visual cues make it an easy method to keep track of process improvements for policy deployments. Sources: https://blog.kainexus.com/customer/continuous-improvement-software/features/improvement-charts-and-data/bowling-charts/big-lebowski
-
Johanan Collins replied to Vishwadeep Khatri's topic in We ask and you answer! The best answer wins!Leader Standard Work or LSW is a set of behaviors, tools and actions that are integrated into the daily activities of leaders at all levels in an organization. This fosters a lean thinking corporate culture. Lean Standard Work must be documented and put into consistent practice. When opportunities present itself, the processes need to be improved through experimentation and reflection. A few processes that usually make up a part of Lean Standard Work are · Hoshin Kanari or Strategy Development: In the case of Lean Standard Work the organizations long term goals and visions are kept in view and worked towards on a daily basis. · Gemba Walks: In Lean Standard Work the leader visits and takes stock of the processes under them at regular intervals, and in order to not make it repetitive the leader should document the purpose of their Gemba walk and what they observed on it. · Huddle Meetings: These are short meetings where employees can bring to their manager any issues or challenges. The main advantage of Lean Standard Work is that it fosters organizational change by insisting on behavioral changes in the organization’s leaders, by doing this, it makes the leaders lead from the from and the rest of the organization follows. Lean Standard Work is one of the best ways to initiate lean processes in an organization and the added benefit is that ensure easy sustenance or maintenance of Lean processes and Lean Culture.
-
Johanan Collins replied to Vishwadeep Khatri's topic in We ask and you answer! The best answer wins!Deductive reasoning is a scientific method that uses deduction to check or test theories and hypothesis. Deductive reasoning consists of three steps, premise one, premise two and an inference. For Example, Premise one is all men are mortal, premise two is Sampson is a man. Thus, we infer that Sampson is a mortal. Deductive Reasoning is the foundation of research and academic research in specific. In academic research we first make claims, gather data, and then test the claims or to be specific the hypothesis. Inductive Reasoning makes broad claims about an observation. Data is gathered and then conclusions are drawn making it opposite to deductive reasoning. The main difference between the two forms of reasoning is that deductive makes claims based on theory while inductive makes claims based on observations. The main way that the two are used in the Lean six sigma world is inductive reasoning is used in Gemba walks and “management by walking around”, where the practitioner is observing the processes and then making decisions. While the entire DMAIC process under six sigma would be grouped under deductive reasoning as the practitioner theorizes a result, gathers data and tests if their results hold true.
-
Johanan Collins replied to Vishwadeep Khatri's topic in We ask and you answer! The best answer wins!SWOT Analysis is a strategic tool used by organizations to plan strategically and ascertain the organizations current position. SWOT Analysis consists of a matrix of four quadrants which are Strength, Weakness, Opportunity, and Threat. Strength · Analyze what the organization internally does well. · Analyze what the organization does better than the competition or cheaper than the competition. · What is the USP or the Unique Selling Proposition of the organization? Weakness · Analyze what the organization internally does poorly. · What tasks can be done better? · Can the following be improved (resources, symptoms procedures and people)? Opportunity · External chances for the organization to grow in the future. · The organization should take initiative and claim the opportunity. · Opportunities can occur in political decisions, demographic change, and social issues. Threat · External negative events that affect the organization. · Usually out of the control of the organization, for example a global pandemic, environmental issues, and political changes. · Anticipation and proactiveness is the best answer with effective reactions a close second. SWOT analysis are a good way for the organization to take a snapshot of its internal processes in the form of its strengths and weaknesses and to ascertain the outside factors that affect it in the form of opportunities and threat’s. A well-done SWOT analysis can be used in business excellence initiatives as it gives a good picture of the organization’s current status. Source: https://www.mindtools.com/pages/article/newTMC_05.htm
-
Johanan Collins replied to Vishwadeep Khatri's topic in We ask and you answer! The best answer wins!Kamishiba or paper theater is a component of the Toyota Production System. They are visual control tools that help with the sequence, and completion of work tasks. Kamishiba Boards display tasks according to a logical setup, like location, category against a certain time period. The board shows if the tasks are being done according to the logical sequence and if any problems were encountered and reported on. An example of Kamishibai in the service industry is tracking the amount of time a customer service call is taking. The board can have multiple customer service representatives on it with the time that they are taking, when they go over the usual allotted time the board shows red, informing the supervisor that the problem might require their help. Source: https://traccsolution.com/blog/kamishibai/ https://blog.gembaacademy.com/2006/11/21/what_is_a_kamishibai/
-
Johanan Collins replied to Vishwadeep Khatri's topic in We ask and you answer! The best answer wins!Rapid Application Development or RAD is an approach in agile software development that focuses on user feedback in ongoing projects through rapid prototyping. RAD was started in the 1980’s by Barry Boehm and James Martin with the understanding that software resources are not tangible like raw materials. Unlike in manufacturing where a physical design sets the design in stone for a time period. RAD makes use of the inherent flexibility of software which does not have a physical model. The four steps of RAD are Define Requirements: RAD starts of by defining requirements, but in this case, they are more akin to a loose set of guidelines instead of specific requirements. The main reason is to enable the team to change requirements in any step of the project cycle. Prototyping: The team builds a prototype that can be demonstrated to the client. At early stages of the project the prototype can cut corners or not satisfy all the requirements. As the project cycle continues the prototype fills in the requirements that can be met. Feedback: After the prototype is presented to the client, the team collects feedback on everything. In this step the requirements are scrutinized. Clients may also change requirements if they find that a certain requirement is too ambitious for current technological ability. If there is negative feedback the team returns to step two and create a prototype with the feedback in mind. This cycle continues till feedback is positive or the client is satisfied. Product Finalization: In this step the project is optimized to improve stability and maintainability. The administrative steps required before project or product handoff like documentation. The reason why RAD emphasizes prototyping over planning is due to the following reasons Speed: Due to prototyping RAD projects are more likely to meet deadlines. Cost: The prototypes that are created by the RAD team consist of customer requirements. In early prototypes the client may choose to remove a requirement, thus reducing the time spent on working on the requirement before it is cut out before final implementation. The time and money spent on features that are finally cut off are actually not spent in a RAD process. RAD is not only suitable to software development but to other complex projects. For Example, the US Air Force was saddled with the much-criticized F-35 fighter jet program. The program was first initiated in 1997 with Lockheed Martin being awarded the program in 2001. The project was extremely ambitious. Some of the requirements were difficult to realize with the technology of the day, causing delays for the entire program. These delays have caused cost overrun of such mammoth proportions that some estimate that the program will cost $1.7 trillion over the project lifecycle. The United States Air Force in order to not fall into the same budget and design pitfalls decided to use RAD in agile software development, open architecture, and digital engineering, for its Next Generation Air Dominance fighter program. The program has been so successful that the US Air Force within one year designed a virtual model and constructed a working full-scale prototype – and flew it. When you compare this to the F35 which was approved in 1997 and first flew in 2006, a full nine years and the fighter still has issues in 2021. So, we can see with the NGAD that RAD & agile software development have been used successfully outside of the software development sector. Source : https://www.outsystems.com/blog/posts/rapid-application-development/ https://www.forbes.com/sites/davidaxe/2021/02/23/the-us-air-force-just-admitted-the-f-35-stealth-fighter-has-failed/ https://www.defensenews.com/air/2021/07/07/watchdog-group-finds-f-35-sustainment-costs-could-be-headed-off-affordability-cliff/#:~:text=The%20F%2D35%20program%20is,Program%20Evaluation%20office's%202020%20estimate. https://www.defensenews.com/breaking-news/2020/09/15/the-us-air-force-has-built-and-flown-a-mysterious-full-scale-prototype-of-its-future-fighter-jet/
-
Johanan Collins replied to Vishwadeep Khatri's topic in We ask and you answer! The best answer wins!Backcasting is planning method first formulated by John B. Robinson of the University of Waterloo. The core of this method is asking the question “if we want to attain a certain goal, what actions must be taken to get there?” In Backcasting we start of by setting a goal and then working back from the goal to ascertain what steps are needed to reach it. Instead of using the present to predict the future as in forecasting, Backcasting forms the future from the desired outcome and works backward to our present. For example, where Backcasting can be used for problem solving or forward thinking is if we were to take an 18 man who just started their bachelor’s degree, if he were forward thinking and had a long-term goal of getting married to a desirable woman, Backcasting would be the best method for him. His end goal would be to get married by the age of 27, he would fill in the pathway for him to be desirable to his future spouse. He would have to move step by step towards his end goal. The young man would need to finish his bachelor’s degree within four years Then get a good job for two years. Starting his master’s degree, which he should finish in two years. After graduating he would start working at a good job in order to be eligible to meet a prospective spouse. He spends one year getting to know said prospect and then ties the knot. As we can see this young forward-thinking man has created a path for himself using Backcasting. Sources: https://www.naturalstep.ca/backcasting https://sustainablebrands.com/read/new-metrics/backcasting-a-roadmap-to-transformational-change
-
Johanan Collins replied to Vishwadeep Khatri's topic in We ask and you answer! The best answer wins!Delphi technique is a technique that was created by Olaf Helmer and Norman Dalkey of the prestigious think tank Rand Corporation in the 1950’s to forecast the impact of technology on warfare. The name of the technique refers to the oracle of Delphi a priestess in ancient Greece who gave prophecies and advice. The goal of this method is to arrive at expert consensus. The Delphi technique makes use of experts who answer questionnaires anonymously, they then receive feedback of the group response in the form of statistical representative. This process repeats itself in rounds, and the questions in each round are based upon the answers from the previous round. In each round, participants rank their responses by the order of priority. This continues till the range of answers reduces to something that looks like expert consensus. Nominal Group Technique is similar to Delphi Technique in that it also uses rounds, the main difference is the questionnaire in Delphi and the discussions in NGT. But the similarities between the two are cosmetic as NGT is used in less important decisions that require prior decisions while Delphi Technique uses expert opinions for important decisions with higher stakes and can take considerable amount of time to get to expert consensus. Source: https://www.rand.org/topics/delphi-method.html https://landing.directorpoint.com/blog/delphi-and-ngt-decision-techniques/
-
Johanan Collins replied to Vishwadeep Khatri's topic in We ask and you answer! The best answer wins!ECRS or Eliminate, Combine, Rearrange and Simplify is a Lean technique. ECRS is used to reduce or eliminate wasteful steps from any business processes, be they a process in manufacturing or a process in the office. ECRS is a method that can be used for fast improvements. Eliminate: In a process which currently takes a certain number of steps, if we were to eliminate a step it would shorten the process. For funny example would be Tom Smykowski in the 1999 Cult comedy Office space, Tom’s job was to take “the specifications from the customer and bring them down to the software engineers”. The consultants eliminated his job as they had the customers directly send the specifications to the software engineers. A funny example from a cult classic but it does the job of explaining elimination. Combine: When elimination is not possible, the next step is to see if any of the steps in the process can be combined. A classic example would be the use of macros in Microsoft Excel. By creating a macro of multiple steps when working on a excel file you are combining all those steps together. The analyst does not have to do those steps again as the macro does it for him. Rearrange: When elimination or combining is not possible, rearrangement of steps is done to make the process safer, easier, or faster. A classic example of rearrangement of steps is Henry Ford’s assembly line for the production of cars. One of the main benefits was the reduction in the assembly of a car from half a day to under an hour. Simplify: When faced with a complicated process, simplifying steps is undertaken. This done to ensure that the process is easy to understand by the operators. Visual aids are an easy low-cost method of simplification. Sources: https://www.creativesafetysupply.com/glossary/ecrs/#:~:text=ECRS%20stands%20for%20Eliminate%2C%20Combine,processes%20or%20even%20office%20procedures. https://www.lean.org/LeanPost/Posting.cfm?LeanPostId=1245
-
Johanan Collins replied to Vishwadeep Khatri's topic in We ask and you answer! The best answer wins!Parkinson’s Law of time management was coined by Cyril Parkinson. This law showcases the tendency of people to be inefficient with the time that they require for a certain task. The more time a person is given to complete a task, the more inefficient they are with the time. To rephrase Parkinson’s Law, the work will be completed according to the deadline allotted to it. For example, take an entry level Business Computing class of 180 first year university students, the main project has a deadline of five weeks. The number of students who complete the project in the first week can be counted on one hand, while no more than 10 to 20 students complete the project with one week to spare. The vast majority of students will work piecemeal at it and then spend the last three days before the deadline to complete the project. We can see Parkinson’s law in action, majority of the students are inefficient with their time. We can infer certain things from Parkinson’s law. 1) Extra time does not correlate to a better job. For example, students who turn in their projects late most probably will not do a good job even though the amount of time they had to work on the project is more than their peers who turned the project in on time. 2) A fair amount of tasks are allotted more time than what they really need, in order to be accomplished. The project is allocated five weeks while only one week of actual work is needed. 3) Work is evaluated by meeting the goal and not by the time allotted to the work. A student’s project is graded according to it being completed correctly and not how much time it took. In order to improve the productivity of a team and take advantage of Parkinson’s Laws 1) Create goal-oriented tasks instead of time-based tasks. 2) Keep ambitious deadlines as the task is most likely going to take less than expected time to complete it. 3) Progressively reduce the allotted time to a task to find the best balance between time and quality. Source: Consuunt, Parkinson’s Law, Link: https://www.consuunt.com/parkinsons-law/