Johanan Collins
Members
-
Joined
-
Last visited
Everything posted by Johanan Collins
-
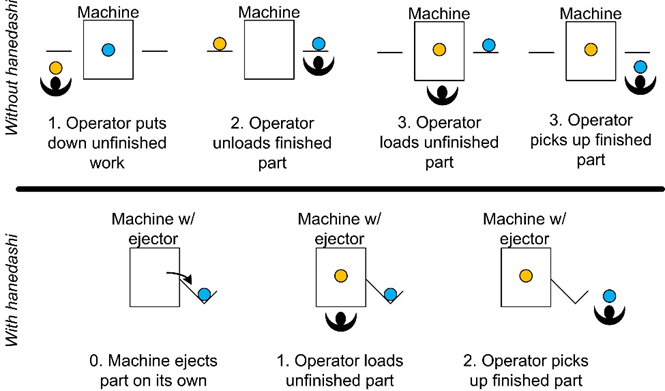
Johanan Collins replied to Vishwadeep Khatri's topic in We ask and you answer! The best answer wins!Hanedashi is a Japanese word that is translated to automatic ejection. A Hanedashi device is designed to automatically eject a part once the process on it is completed. In order to implement Hanedashi, the process should be reliable and stable. The operator would not need to inspect the finished product. The diagram below explains how a Hanedashi device reduces waste. In the above diagram, we can see that without Hanedashi, the operator is required to carry out 4 tasks, however, with Hanedashi this is reduced to 2 tasks. Chaku-Chaku Line. A chaku-chaku (load-load) line is Handdashi devices placed in a sequence. This enables a single operator to handle multiple machines thereby reducing waste, effort, Waste Reduction The wastes that are reduced are “Motion” and “Skills/ Under Utilization of Manpower”. Motion is reduced as - the operator only loads the part on the machine. The machine automatically ejects the part. - the operator does not have to walk to the back of the machine to remove the part, this reduces motion and movement. Skills/ Under Utilization of Manpower is reduced as the same operator will have more time to do other tasks. References https://www.isixsigma.com/dictionary/hanedashi/ https://www.velaction.com/hanedashi/ https://training.velaction.com/courses/structuring-standard-work for diagram above
-
Johanan Collins replied to Vishwadeep Khatri's topic in We ask and you answer! The best answer wins!A/B Testing or Bucket Testing or Split-Run Testing. It is a simple randomized controlled experiment of two samples hypothesis testing for two alternatives namely A and B. It tests the user’s response to Product A against Product B to see which is more attractive to the end-user. The products are similar in every way except for one attribute such as color or size. Version A could be the current product that would form the control group whereas version B is the treatment group which is a modification of version A. A/B testing helps to obtain major improvements through minor changes and obtain high rewards by taking small risks. Use Cases. Some of the use cases of A/B testing could be in newsletters, email campaigns, digital marketing, internet advertisement, website design, etc. Variant Options could be with respect to layout, theme, color scheme, images, headings, subheadings, font, font size, pricing, offers, call to action design, etc. Examples A/B testing can be used to design the purchase funnel on an e-commerce website. The drop-off rates of the two designs of the purchase funnel can be tested to see if the difference in the drop-off rates is statistically significant. A/B testing was first used by Google in 2000 to assess the ideal number of results to display on its search engine page since the larger number of results displayed on its page increased the loading time. A/B testing was used in Microsoft to assess the different ways to display advertising headlines on their search engine, Microsoft Bing. This experiment led to a revenue increase of 12% for the company within four hours of its implementation, without affecting the other user’s experience metrics. Email Marketing/Social Media Marketing with variations of “Offer ends soon” Vs “Offer ends by this weekend” Discount Rs.500 Vs 5% Discount Arial Font Vs Times New Romans Font Blue color Vs Red color To Determine the price point that offers the maximum total revenue. Political Campaigns. To determine what voters, want from a candidate. Testing of APIs by HTTP Routing. New features of APIs are tested through A/B Testing. In this case, a certain percentage of the end-users will get the new version through HTTP routing. This also ensures that in case of a bug, only a small percentage of users are affected. Segmentation and targeting. A/B testing can be used to determine the optimal variant for a particular segment of the market and specifically target that segment. References https://en.wikipedia.org/wiki/A/B_testing https://mailchimp.com/marketing-glossary/ab-tests/
-
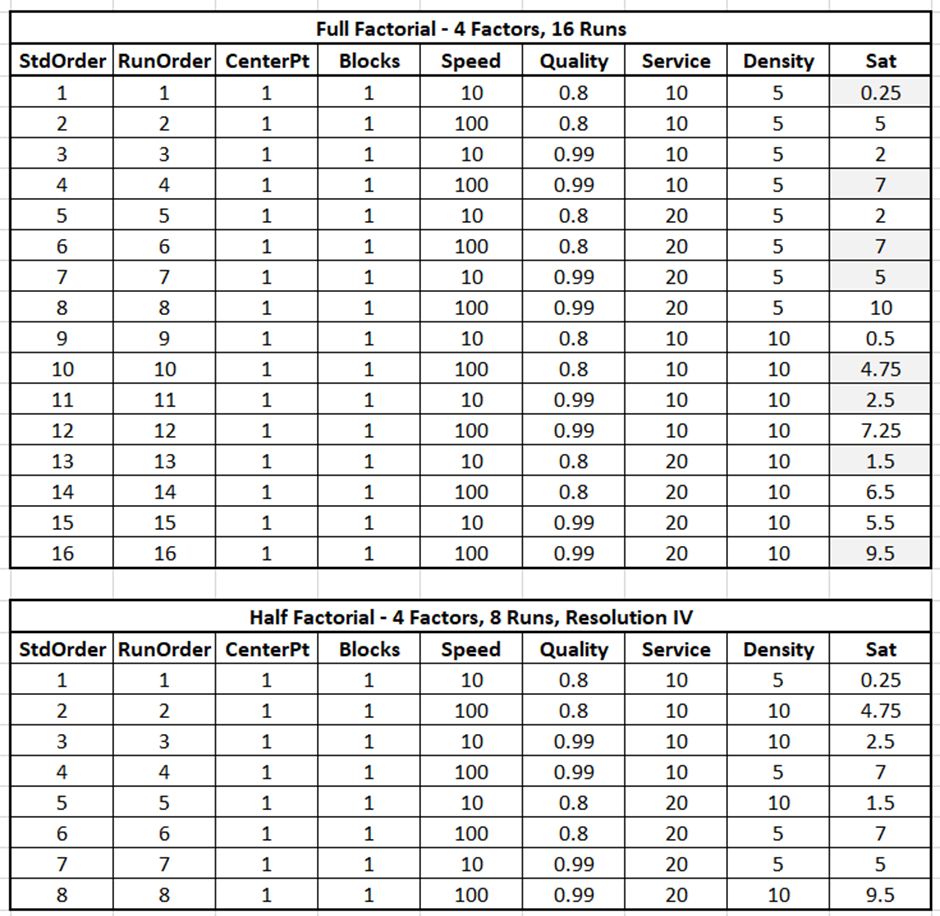
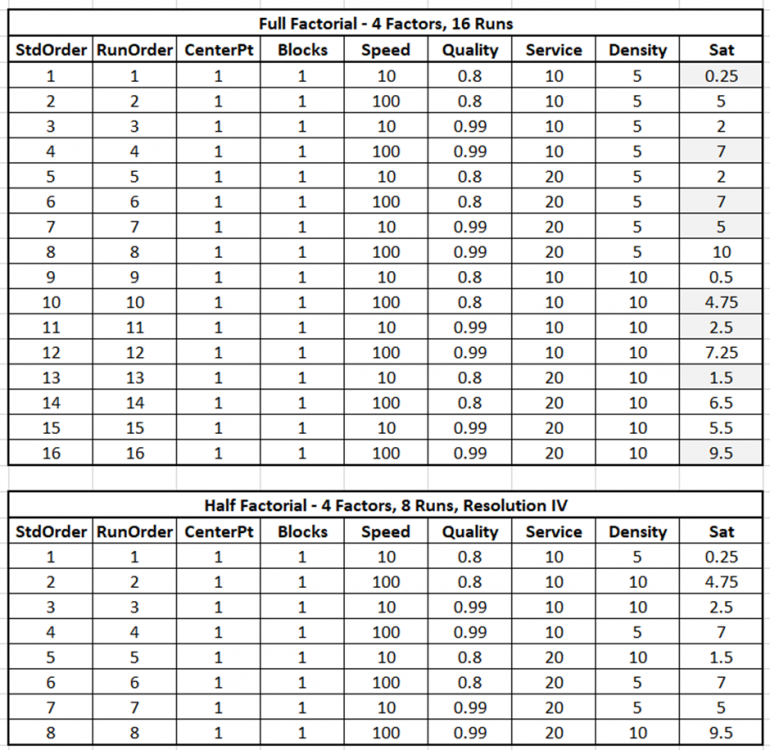
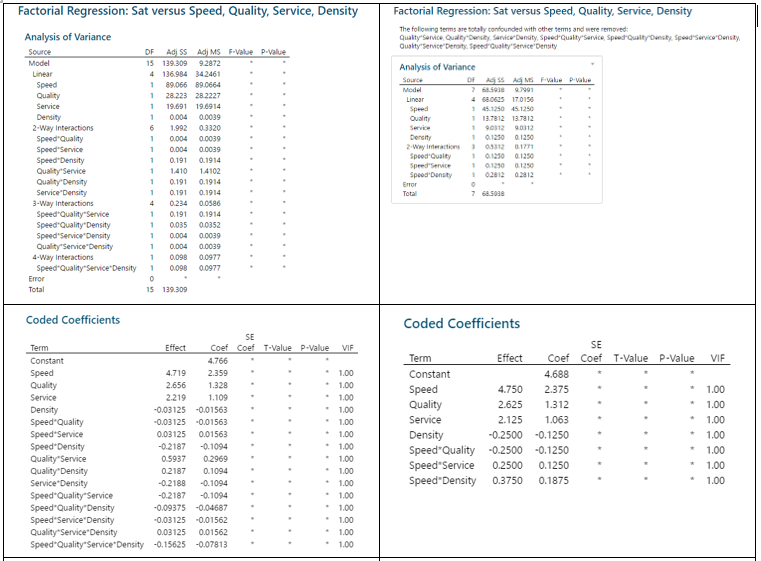
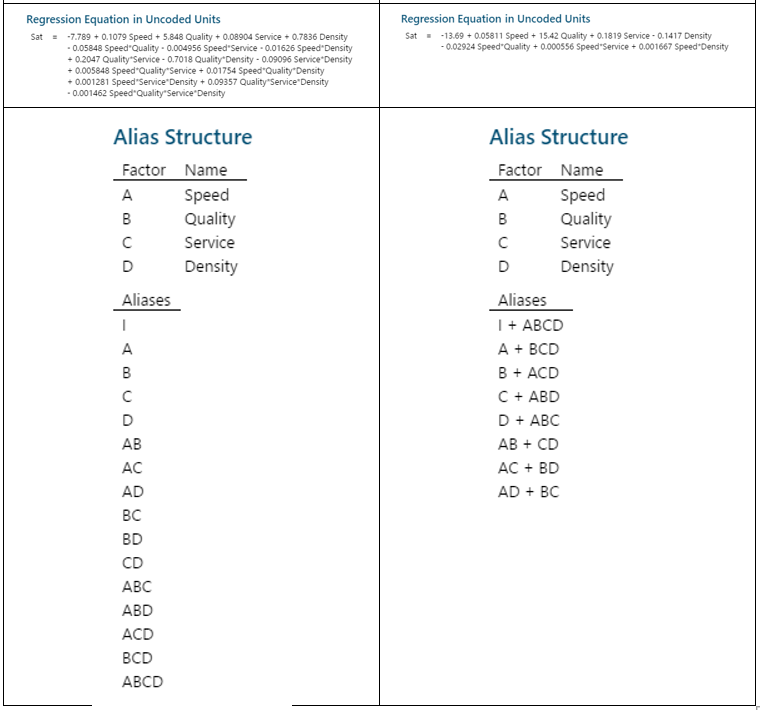
Johanan Collins replied to Vishwadeep Khatri's topic in We ask and you answer! The best answer wins!A Full Factorial Design does experiments for every possible unique combination of the Independent Variables and their impact on the dependent variable. It gives information on all the main effects and all the interactions. Screening DOE is also called Fractional Factorial DOE. It is used when there are a large number of possible independent variables and the researcher has a limit on the number of experiments that can be run. Screening DOE reduces the total runs on the number of experiments by removing those factors that are not statistically significant. This means that these factors will have a negligible effect on the output. The Plackett Burman Design is another type of screening DOE. Benefits of Screening DOE Saving of Time and Money. In the case of destructive testing, screening DOEs are helpful as it reduces the number of pieces of the experimental units scrapped. Fewer runs will require lesser time and resources. For example, an experiment with 10 factors would have 2^10 or 1024 unique runs. Out of these only, 56 will give the main and two-way interactions. The balance 968 will give the 3 way and higher interactions. Drawbacks of Screening DOE Loss of Resolution. In a Fractional Factorial design, some of the main effects are confounded or aliased with each other, this means they cannot be assessed separately. For example, in a Resolution III design, main effects are not aliased with other main effects but with other 2 factor interactions. In Resolution III design we will be able to estimate the combination of A+BC, B+AC, and C+AB. Resolution IV Versus Resolution III. In Resolution IV the main effect is aliased with 3-way interactions whereas in Resolution III the main effect is aliased with 2-way interactions. Since higher-order interactions are usually not significant a Resolution IV Design is preferable to a Resolution III Design. Comparison of Full Factorial Design Vs Screening The data below, having four factors namely Speed, Quality, Service, and Density has been assessed in a Full Factorial (16 Runs) and a Half Factorial (8 Runs) Resolution IV design on Minitab. The response variable is Sat which measures the Satisfaction Level. The data in the model is purely fictional and not experimental. The results of the above are displayed below In the Analysis of Variance, Coded Coefficients, Regression Equation we can see that the Full Factorial design has 15 degrees of freedom and the Half Factorial design has 7 degrees of freedom. We can see that the Full Factorial design gives four main effects, six 2-way interactions), four 3-way interactions, and one 4-way interaction. This adds up to the degrees of freedom (4 + 6 + 4 + 1 = 15). Whereas, we can see that the Half Factorial design gives four main effects, and three 2-way interactions (3). This adds up to the degrees of freedom (4 + 3 = 7). On observing the Alias Structure, we can see that in the Full Factorial design the main effects and the 2,3,4-way interactions are not confounded, however, in the Half Factorial design we can see that the Main Effects are confounded with the 3-way interactions and the 2-way interactions are confounded with other 2-way interactions. References https://www.isixsigma.com/dictionary/screening-doe/#:~:text=A%20screening%20DOE%2C%20also%20commonly%20referred%20to%20as,you%20to%20run%20a%20large%20number%20of%20experiments.
-
Johanan Collins replied to Vishwadeep Khatri's topic in We ask and you answer! The best answer wins!A covariate is a confusing term in statistics. (References 1 & 2) For example, SPSS describes a continuous independent variable as a Covariate in its General Linear Models and as an Independent Variable in Regression. Minitab describes a continuous independent variable as a Covariate in its General Linear Model. In research, one is looking for relationships between explanatory variables and the response variable. Covariates are the variables that the researcher is not interested in but it affects the response variable. Example 1 Which training methodology out of the three methodologies available is most effective in improving exam scores for the ICSE Exam? The Explanatory Variable is the training methodologies and the exam score is the response variable. Covariates, in this case, could be the current grade of the students, education level of parents, the income of parents, or studying abilities of the students within the three groups of the training methodologies. The variability on account of these covariates needs to be taken into consideration in order to see the correct relationship between the training methodology and the exam score. For example, in this case, we could use the current grade of the students as a covariate since the current grade would most likely be highly correlated with the exam score. Example 2. What is the relationship between the Square Foot Area of a house and its price? The Explanatory Variable is the Square Foot Area of the house and the price is the response variable. Covariates, in this case, could be the age of the house, the location of the house, or even the distance from the bus stop. The variability on account of these covariates needs to be taken into consideration in order to see the correct relationship between the Square Foot Area of the house and the price. For example, in this case, we could use the age of the house as a covariate since older houses are likely to be cheaper. The most common settings for Covariates are ANOVA and regression. ANOVA. Analysis of Variance is used to find if there is any statistical difference between three or more independent groups. However, in Example 1 above, we use the current grade as a covariate and would perform an ANCOVA (Analysis of Covariance). In this case, the students’ current grade, a continuous variable, is included as a covariate Regression. In regression, we are attempting to quantify a relationship between one or more independent explanatory variables and the response variable. We run a Multiple Linear Regression by including Square Footage (Variable of Interest) and House Age (the covariate) as an explanatory variable and House Price as the response variable. The regression coefficient of the Square Footage would give the change in House Price per unit change in Square Footage after taking into account the House Age. Thus, by adding House Age in the regression model in Example 2, the noise (variation on account of the covariate) is reduced. References 1. https://www.theanalysisfactor.com/confusing-statistical-terms-5-covariate/ 2. https://www.theanalysisfactor.com/series-on-confusing-statistical-terms/ 3. https://www.statology.org/covariate/
-
Johanan Collins replied to Vishwadeep Khatri's topic in We ask and you answer! The best answer wins!Parameter Diagram In its simplicity, the Parameter Diagram can be considered a schematic representation of the signal, noise, control factors, and response variable. Juran defines Parameter Diagrams in his book on Quality, viz. Quality Planning and Analysis. He states that performance is one of the most basic features of any product and equates performance to the output of a product/service/system. For example, in a TV, it could be colour density, in an electric car it could be range, etc. The output is a factor of various engineering principles that are used to combine materials, components, parts, assemblies, etc. Each of these inputs has a range of parameters, which the design team needs to establish. Setting the correct value for each parameter would then produce the desired output. The Parameter Diagram relates the inputs which may come from the system or customer to the desired output. The parameter diagram also takes into consideration external influences that are non-controllable. The Parameter Diagram can be used as a visual tool for brainstorming and documenting various factors such as control factors, noise factors, input signals, error states, and ideal responses. Use Cases of P-Diagram - It can be used as a very effective Brainstorming Tool. - It is helpful in the preparation of an FMEA, as each input could be analyzed for the failure modes and the effects can be analyzed and RPN Number calculated. - In complex systems where there is an interaction between numerous subsystems, design and engineering parameters, and operating conditions, the Parameter diagram helps the team to visually see each element. - It can also be used for Component FMEA when the visual representation of inputs, ideal response, noise factors, and control factors is helpful. - It can also be used in New Product Development, in combination with the Design of Experiments. An Indicative Diagram of a Parameter Diagram is below:- Definitions of Elements of P Diagram - Input Signals. These are generally the energy sources required by the system. Variations in these inputs can cause a change in the output. - Control Factors. These are the parameters that the design team can control or change. - Error States. These are the loss of energy or undesirable output - Noise Factors. These are factors that influence the output but are not under the direct control of the design team. These include fair wear and tear of the equipment, normal degradation of materials, tiredness of operator, etc. A robust design protects the system against such noise factors. - Ideal Response. This is the desired functional output of the system. Parameter Diagram, New Product Development, and Design of Experiments DMADV. New Product Development generally follows the DMADV (Define, Measure, Analise, Design, Verify) methodology. In the Define phase, the process and its design goals are defined. In the Measure phase, the CTQ is identified and measured. In the Analyse phase data is used to analyze the best possible design. In the Design Phase, the prototype is designed and finally, in the Verify phase, the outputs are verified in real conditions. The DMADV methodology is used in New Product Development or when further improvement of the existing product is not a commercially or technologically viable solution. In the first case, no data would be available for analysis, and in the second case, the data from the previous product could possibly be used for analysis. Design of Experiments. Experimental design is a critically important tool in scientific and engineering for improving the product realization process. Critical components of these activities are new manufacturing process design and development, and process management. The application in DoE helps in increasing process yield, reduced variability, development time, and cost. Applications of DoE include - Evaluation and comparison of basic design configurations - Evaluation of material alternatives - Selection of design parameters so that the product will work under a wide variety of field conditions, that is so that the product is robust - Determination of key product design parameters that impact product performance - Formulation of New Products Parameter Diagram. After representing the system schematically in a Parameter Diagram, the Design of Experiments can be used with the input signals, control factors and error states, ideal response can be optimized based on the inputs. References https://www.weibull.com/hotwire/issue182/fmeacorner182.htm https://kanbanize.com/lean-management/six-sigma/dmadv Design and Analysis of Experiments, Eight Edition, Douglas C. Montgomery, Wiley

-
Johanan Collins replied to Vishwadeep Khatri's topic in We ask and you answer! The best answer wins!Definitions of Reliability Manufacturing & Service - Change of Quality over time. - The ability of a product, service, or system to maintain the original level of quality over time and under different conditions. - The probability that is inherent in a system, service, or product that ensures it effectively carries out it’s designed function over a specified time, in a defined environment without failure. Research - Reliability is the consistency of a research study or measuring test. https://www.simplypsychology.org/reliability.html). - Reliability is the consistent replication of findings from research. A high correlation coefficient indicates high reliability. Psychometrics/Statistics - The overall consistency of a measure. A highly reliable measure repeatedly produces similar results under similar conditions. - "It is the characteristic of a set of test scores that relates to the amount of random error from the measurement process that might be embedded in the scores” https://en.wikipedia.org/wiki/Reliability_(statistics) Components of Reliability Manufacturing & Service These are the likelihood of success, the designed function, performance within given specification limits, a time period, and the environment/conditions such as the temperature, speed, or pressure. ASQ defines these elements as the probability of success, durability, dependability, quality over time, and availability to perform the function. Psychometry/Statistics. The components of reliability are precision, reproducibility, and consistency. Measurements are influenced by factors that contribute to consistency and factors that contribute to inconsistency. The factors that contribute to consistency are the stable characteristic of the person or the attribute that is being measured whereas the factors that contribute to inconsistency are attributes of the person or circumstance that might alter the measurement. Examples of these are things such as health, tiredness, motivation, emotions, comprehension of the task, attention, distractions, instructions, and even luck. Four Main Types of Reliability Test-retest. This is conducting the same test over a period of time. Interrater Reliability. This is conducting the same test but by different individuals Parallel Forms Reliability. This is conducting alternate versions of tests that are designed to measure the same attribute. Internal Consistency Reliability. This is the correlation between multiple items of the test and the construct it is supposed to measure. Examples of Reliability Electric Scooter under a warranty of 24,000 Kms or 2 years whichever is earlier Television. Life time guarantee. Ecommerce website uptime is 99.997% Once data entry error per one million keystrokes References https://asq.org/quality-resources/reliability https://www.simplypsychology.org/reliability.html https://en.wikipedia.org/wiki/Reliability_(statistics) https://www.scribbr.com/methodology/types-of-reliability/
-
Johanan Collins replied to Vishwadeep Khatri's topic in We ask and you answer! The best answer wins!Training Within Industry was a necessity during World War 2 from 1940 to 1945. The success of the war depended on the industry meeting the increased requirements during war. There was an increased need for trained and skilled manpower during the war when the manpower was required to fight the war and at the same time required to produce material. TWI provided a framework for improved methods of training and modern ways to meet the shortfall. During World war, about 1.6 Million workers were TWI trained in about 16,500 factories and plants. The program continued in Asia and Europe post the war to rebuild the countries. It is of note that Kaizen and the Toyota Production System was an offshoot of TWI. TWI was developed by experts from the Private industries. It consisted of four training programs of ten hours each. Due to the urgency, it used various experimental models, many of which were discarded. The successful programs were put together to form the TWI. The introductory sessions were the “Appreciation Sessions” that were used to gain management support. For the need of additional trainers, TWI had the “Trian the Trainer” sessions and “Institute Conductor’s Manual” for the master trainers. It also had a “Staff Only” program for staff development. The trainers used the 5 Needs of the Supervisor viz., knowledge of work and responsibility, skill in instruction, improving methods, and leading. The four training programs of ten hours are Job Instruction, Job Methods, Job Relations, and Program Development. Job Instruction (JI). JI trained experienced staff to train inexperienced staff more quickly. It consisted of breaking down the task into well-defined steps, with the procedure and key points, demonstrating it to the students, and observing the students perform the task. Hospitals, farms, and offices used a variation of the program. Job Methods (JM). Workers evaluate their own jobs and look for areas of improvement. The course teaches job breakdown and reasoning skills to determine if there is a need to eliminate, combine, rearrange, or simplify the step. Job Relations (JR). This course teaches supervisors to treat the workers as individuals, hence human relationships on the job are emphasized. Programme Development (PD). This course is for those responsible for the training function in order to assist those on the line to solve problems during production by training. References https://en.wikipedia.org/wiki/Training_Within_Industry
-
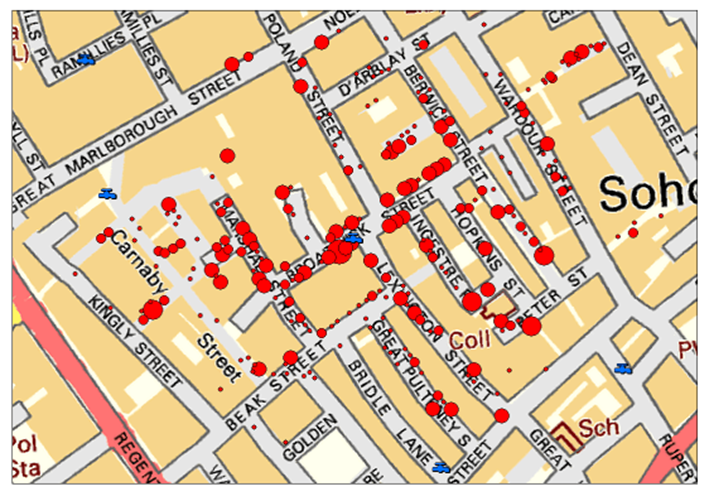
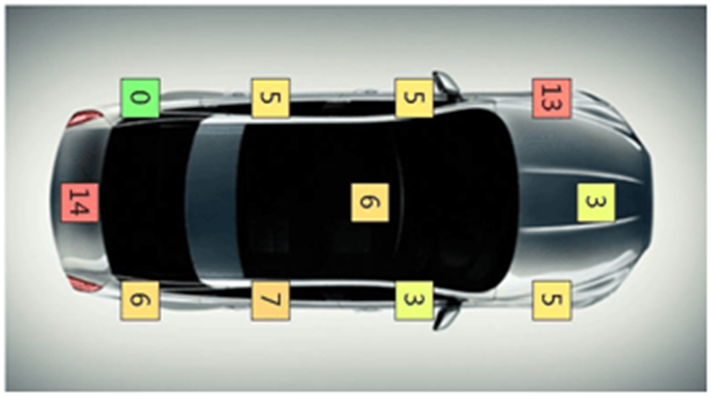
Johanan Collins replied to Vishwadeep Khatri's topic in We ask and you answer! The best answer wins!A Measles chart is also called a defect map or a defect location check sheet. It provides a visual image of the data collected rather than just collecting the count of the number of defects. In addition to the count and rate of defect, it shows the location of the defect. A drawing of the item is used to plot the place where the defect is occurring. The location of clusters of the defect could throw a better light on the nature of the defects, root cause identification, and its solution. Measles charts can throw light on the problem either by highlighting the areas where the maximum clusters of the problem occur as in the case of the 1845 Cholera Epidemic or by highlighting the areas where minimum/nil clusters of the problems occur as in the case of the Bomber Aircraft in World War 2. Examples Cholera Epidemic. The cholera epidemic hit Soho, London in 1854. Dr. John Snow, the father of epidemiology, plotted the location of deaths caused by the epidemic and the location of the pumps. His analysis led to the identification of the source as a contaminated public water pump. The removal of the handle of the pump stopped the epidemic. Survivability Bias World War 2 Survivability Bias draws attention to the survivors while evaluating a problem. Mathematician Albert Wald of the Statistical Research Group, United States did studies on neglected data and came to a conclusion that during World War 2, the retuning combat bombers needed to be strengthened in the areas where the bullet holes were minimum since the places with maximum bullet holes were not causing the aircraft to crash. A Measles chart of the returning aircraft gave an indication of the areas that showed the strongest part of the aircraft (a cluster of holes) and the most vulnerable parts of the aircraft having areas with no holes. The Measles clusters indicated the parts that were strong and needed the least additional protection. Defects in Cars The average number of defects that occur in the body of a car is 67. However, a Measles chart as indicated below show the locations that are more prone to defects. References. https://www.sixsigmadaily.com/measles-charts/ https://worldwarwings.com/the-statistics-that-kept-countless-allied-fighter-planes-in-the-sky/ https://www.r-bloggers.com/2013/03/john-snows-cholera-data-in-more-formats/ https://infodreamgroup.com/blog-defect-map-defect-location-advanced-attribute-spc/

-
Johanan Collins replied to Vishwadeep Khatri's topic in We ask and you answer! The best answer wins!Burn-in Testing is the testing of the components of a system before it is put into service or before its assembly into the system. It is done to establish the load capacity of a component by forcing it into failure under supervised test conditions. The plot of the Failure rate against time takes a shape of a Bathtub curve. This shows that the failure rate is high early in the product life cycle. The burn-in testing is done in a stressful and accelerated environment in order to determine the failure rate during this early stage of the product life cycle when the failure rate is high. The failed components would be improved upon and replaced thus preventing premature failure of the system. Since the Burn-in testing generally destroys the components, a trade-off needs to be made to ensure a high yield. Cost Implications. Burn-in testing is not done for all components. It will generally depend upon the cost of the test, the cost of the component since it is damaged during the test, the cost of failure, the cost of warranty claims, and the cost of goodwill lost. Advantages of Burn-in Testing Higher reliability of the product. Proactive prevention such as planned preventive maintenance. Fewer customer returns leading to fewer service and call centers. Better estimated lifespan of the product Examples of Burn-in Testing Electronic Components testing is done at high voltage, current or temperature. Audio Equipment is tested by leaving it on for a large number of days. Stress testing of ropes, wires, and jigs is done to assess the safe working load. References https://en.wikipedia.org/wiki/Burn-in https://www.techopedia.com/definition/2161/burn-in-testing#:~:text=Burn-in%20testing%20is%20the%20process%20of%20increasing%20the,be%20replaced%20before%20the%20device%20reaches%20the%20consumer.
-
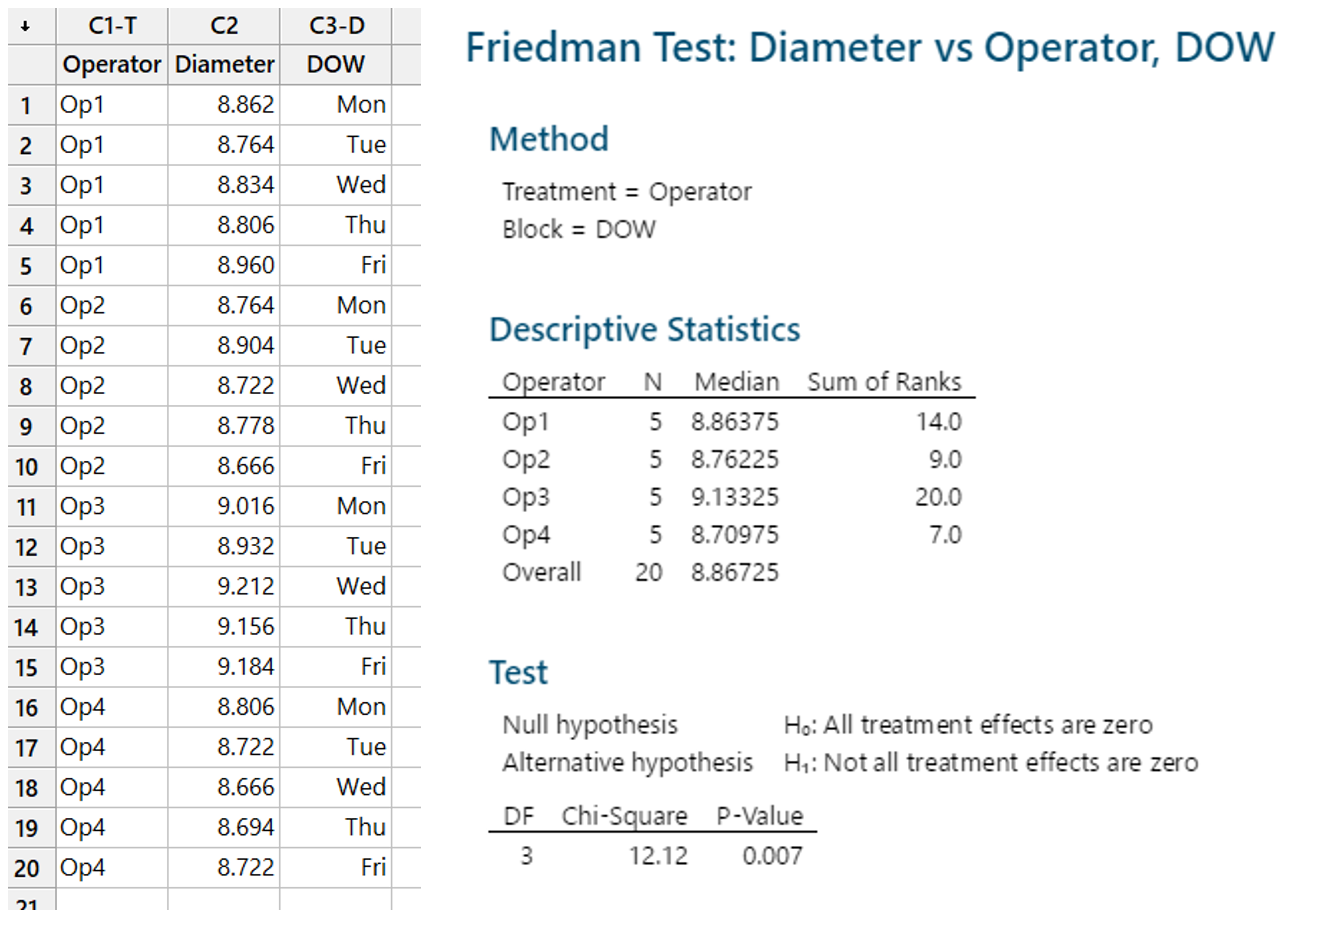
Johanan Collins replied to Vishwadeep Khatri's topic in We ask and you answer! The best answer wins!P-Value. Under the assumption that the Null Hypothesis is true, the P-Value is the probability of getting test results at least as extreme as the results actually observed. Hence a P-Value of 0.049 indicates that the likelihood of obtaining a value as extreme as the test result is 4.9% whereas a P-Value of 0.02 indicates that the likelihood of obtaining a value as extreme as the test result is 2%. Hence, we can conclude, the smaller the P-Value, the smaller is the likelihood of the outcome to be at least as extreme the actual results obtained. Statistical Significance: Statistical Significance (Alpha) is the probability of rejecting the Ho, given that it is true. When p <= Alpha, the results are statistically significant. Type 1 and Type 2 Errors. Type 1 Error is the rejection of a null hypothesis that is true. It is called a false positive. The probability of Type 1 error is Alpha. Type 2 Error is not rejecting the null hypothesis is false. It is called a false negative. The probability of Type 2 error is Beta where the Power of the Test is 1 - Beta In False positive/negative, the word false means that the conclusion drawn is false. Type 1 and Type 2 are complementary. If you decrease one, the other will increase. Example. Case 1. Convicting an innocent defendant is a type 1 error, whereas acquitting a criminal is a type 2 error. Case 2. Test results says you have corona virus but you don’t is type 1 error, whereas test results indicating that you don’t have the virus and you have the virus is type 2 error In Case 1, we will want a low significance level, however in Case 2 we will want a high significance level. Selection of Statistical Significance. The Statistical Significance is chosen before the collection of data. In Case 1, we will want a low significance level, however in Case 2 we will want a high significance level. In Academic Settings once the Statistical Significance (Alpha) is determined, and the p-value calculated and compared to the Alpha, the Null Hypothesis is either rejected or we fail to reject the null hypothesis. The absolute difference between the p-value and α is inconsequential. Having said that, (as against Scientific or Academic research), in a Managerial setting, say to accept a consignment based on the p value, the manager may do the following in case the p value is close to Alpha (0.048) (a) accept the consignment with caution or (b) take another sample to confirm the findings or (c) accept the consignment at a reduced price and sell it on a discount or (d) have an alternative use for the consignment. However, in case the reduced quality may have an adverse effect on the reputation of the firm, the Manager would then reject the consignment. References https://en.wikipedia.org/wiki/Type_I_and_type_II_errors https://en.wikipedia.org/wiki/P-value
-
Johanan Collins replied to Vishwadeep Khatri's topic in We ask and you answer! The best answer wins!Gen-ba or Gemba means Real Place. It means going to the actual place where the problem has occurred. An interesting article about the difference between Gemba and MBWA (Management by Walking Around) is on the Benchmark Six Sigma Forum. (Link in Reference 1) Gen-butsu means Real Part. Go to the real place and observe the real part and the real process. Gen-jitsu means Real Facts. It means collecting the real facts by going to the real place and observing the real part and the real process. This can be compared to the standard or ideal condition. The 4M data, i.e., Man, Machine, Material and Method may be collected. 3G Principles. Genba, Gebbutsu, and Genjitsu form the 3G Principles. 5G Principles. Genri and Gensoku are added to the 3G Principles Genri means Principles. It means verifying the related theory and/or principles. This helps in Root Cause Analysis Gensoku means Fundamental Rules. It means checking the Standards, Standard Operating Procedures, parameters, the level of training, motivation, etc. Example. Optimizing Crew Transportation of an Airline at a Metro City. ABC Airlines operates International and Domestic flights for their Pilots and Cabin crew from XYZ city. A transport delay generally leads to a flight delay causing both tangible and intangible loss for the airline. The transportation operations are contracted out to a vendor to carry out the operations. Problem. Increase in Flights being delayed on account of transport. Vendor asking for an increase in the number of cars for the operation. Application of 5G Principle Genba. This involved a visit to the airport and observing the operations both secretively, from a distance, and from within the parking lot. Genbutsu. Here it was observing the real process both for travel from home to airport and vice versa. Genjitsu. The real facts were collected some of these were, the geolocation of the addresses of all crew to calculate time and distance, flight schedule throughout the day, no of cars actually deployed with their registration numbers, odometer reading of all cars, number of crew in each car per trip, the spatial distance between crew being clubbed together in each trip, flight time – airport droptime on pickup , waiting time on drop, GPS feed, number of vendor supervisors deployed, non-productive trips (one way empty), breakdowns, preventive maintenance, the interaction between vendor supervisor, airline supervisor and crew, etc. Genri. The next step was to verify the related theory/principles. Timeline. A timeline of the entire operations was drawn out in Excel and peak loads and lean periods were calculated. The operations were balanced by combining the domestic and international operations into one contract. Further peak loads were handled through the hiring of Meru/Ola/Uber Cabs available at the airport. Geolocation. Geolocations of all crew members were plotted on the map and theoretical distances were calculated. These were compared with the actual odometer readings for corroboration of the facts. Infor Optimization Software, which is designed on various transportation and supply chain optimization theories such as traveling salesman etc., was deployed for optimizing the operations. Actual Odometer Readings. Actual daily odometer readings for each day of operations obtained from the cars, compared with the GPS readings. Average readings and standard deviations were calculated and the area under the normal curve was used to calculate probabilities of delay. Non-Productive Trips. Details of non-productive trips were studied and fed into the software which reduced the number of trips. Stakeholder Analysis. The stakeholders were the management (reduction in cost), crew (improved quality of service), vendor (increase in profit), Unions (political reasons), etc. Gensoku. The last step was to establish the Fundamental Rules. The number of cars for the operations was theoretically calculated and corroborated with the actual cars on the ground. Service Level Agreements, taking into consideration inputs from all stakeholders, were included as part of the contract. Airline Supervisors were given authority to hire Meru/Ola/Uber cabs on an as-required basis. The SLAs included the number of cars to be deployed during various time periods (peak and lean time periods) of the operations, waiting times (waiting times were increased in lean periods), number of crew to be clubbed in each cab (this was increased during peak operations), clear accountability and distribution of responsibilities between vendor and airline supervisor. Final Outcome. The above operations led to a reduction in the number of cars being deployed, nil transport delay on account of transport, increased satisfaction by the crew, clear accountability between vendor and airlines supervisor. The same model with a few modifications was applied in other Metros. The above example has been written after a detailed discussion with the person in charge of optimizing the transport optimization. References https://www.benchmarksixsigma.com/forum/topic/35238-gemba/#comment-46468 https://www.nikunjbhoraniya.com/2022/01/5-gen-methodology.html http://www.sixsigmatrainingfree.com/six-sigma-blog/gemba-gembutsu-genjitsu
-
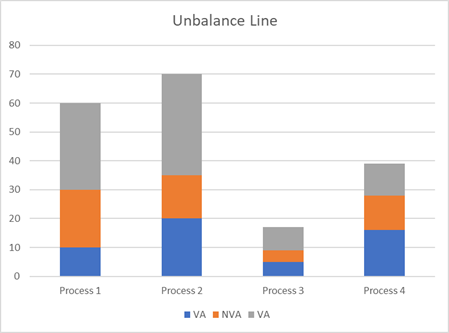
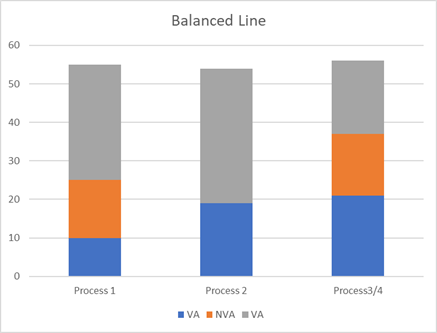
Johanan Collins replied to Vishwadeep Khatri's topic in We ask and you answer! The best answer wins!Overall Equipment Effectiveness / Overall Equipment Efficiency OEE measures the utilization of a machine. It is a ratio of the parts produced vs the theoretical capacity. Causes of OEE · Availability. Availability Losses can be due to planned maintenance, unplanned repairs, breakdowns, material shortage, changeovers, lack of transport for finished goods, absence of operator, etc. · Performance. Speed Losses are reduced rate of production due to wear and tear, poor maintenance, idling, lack of training leading to incorrect operation, wrong settings, etc. · Yield. Quality Losses are losses due to defects. These wastages can be in the form of scrap, rework, and start-up losses. Example. · Theoretical OEE – 100 parts per hour · Availability Losses – 5 parts per hour · Speed Losses – 10 parts per hour · Quality Losses – 15 parts per hour · Good parts produced – 70 · OEE – 70% TAKT Time Takt is a musical term. In German it means beat. It is the rhythm/rate at which production needs to be paced in order to meet customer demand. It is measured in Time/Unit. It helps in planning the resources such as employees, machines, raw material, transport, storage, etc with respect to the required production. Customers, transporters, employees, etc., can be given an accurate estimate of when to expect the finished goods. The Takt time changes as the business grow, hence necessary action such as increasing capacity will need to be taken to stay ahead of demand. Takt Time = Total Available Production Time/Customer Demand Example Total Available Production Time/day = 480 Minutes Cycle Time Cycle Time is the time spent on a specific task for one unit. Time/Unit Example 1. Unbalanced Line Cycle Time. · Cycle Time Task A = 30 sec/part, · Cycle Time Task B = 60 sec/par - Bottleneck, · Cycle Time Task C = 15 sec/part, · Cycle Time Task D 15 sec/part · Throughput without OEE = 60 parts/hour · Target Cycle Time = 60 Sec x 0.8 OEE = 48 Sec · Throughput with OEE (80%) = 3600/48 = 75 Parts Per Hour Example 2. Balanced Line Cycle Time. · Cycle Time Task A = 30 sec/part, · Cycle Time Task B1 = 30 sec/part, · Cycle Time Task B2 = 30 sec/part, · Cycle Time Task CD = 30 sec/part · Throughput without OEE= 120 parts/hour · Target Cycle Time = 30 Sec x 0.8 OEE = 24 Sec · Throughput with OEE (80%) = 3600/24 = 150 Parts Per Hour The target cycle time for a process is Takt Time multiplied by the OEE If the Target Cycle Time for a process is optimized without taking into consideration the reduced production due to OEE losses, it is likely that the customer demand is not going to be met. For the customer demand to be met taking into consideration OEE losses the · Average Output >= Average Customer Demand or · Target Cycle Time <= Takt Time x OEE This is illustrated in the examples above References https://www.benchmarksixsigma.com/forum/topic/36096-overall-equipment-effectiveness-oee/#comment-50835 https://www.allaboutlean.com/oee-definition/ https://www.allaboutlean.com/line-balancing-3/

-
Johanan Collins replied to Vishwadeep Khatri's topic in We ask and you answer! The best answer wins!Weighted Shortest Job First Prioritization Framework The WSJF framework is used to maximize ROI. It needs clear objectives before starting since the Return on Investment is linked to the priority assigned to a task. It predicts the value that the project will deliver before undertaking it. It is suitable to prioritize a very large range of features such as marketing, content marketing, bugs, type of product, business/technical risks, value to customers, etc. In simple mathematical terms, WSJF can be defined as the Cost of Delay divided by the Duration. The components of Cost of Delay as determined by the developer of the framework (SAFe) are:- · User/Business Value · Time Criticality · Risk reduction/opportunity enablement User/Business Value. Rank the tasks by relative importance to users and their potential impact on revenue. Questions asked at this stage are, what is the value to the business, what is the impact to revenue, what is the relative value to the end-user, and how important is it to the user, what are the negative impacts caused by delay, what are the users preference to this solution over others? The ranking was done by SAFe in a Fibonacci series of 1,2,3,5,8,13… Time Criticality. Ranks the tasks by urgency. Estimate the decay in value over time or the number of customers lost over time. Questions asked are, is there a fixed deadline, will the value decay over time, will users wait, will users move to another solution, how urgent is it for the business or product? The measurement was done by SAFe in a Fibonacci series of 1,2,3,5,8,13… Risk Reduction/Opportunity Enablement. Looks at long-term benefits against revenue, further improvements that will increase the number of potential customers. Helps to analyze legal/technical risks early in the project. Questions asked are, will this increase future business opportunities, is it important to eliminate future risks, is the risk of future delivery reduced, will the information received give value? The measurement was done by SAFe in a Fibonacci series of 1,2,3,5,8,13… Duration/Size of Job. Duration ranks the job by the complexity of realization. The greater the complexity, the greater is the measurement. This would include factors such as costs of manhours, etc. Duration is also called feature points, story points, relative size, or effort. Since it is in the denominator, a smaller number is better. Questions asked are what are the dependencies that add risks and increase the time, how big or complex is the implementation, what will be the time to implement? The measurement was done by SAFe in a Fibonacci series of 1,2,3,5,8,13… Drawbacks All criteria are treated equally. What if you want to give a greater weightage to business value? You will have to add weights to the criteria. It is based on relativity. It is difficult to measure duration and other criteria. Mitigation Consistency. Use the same score scale for all tasks to ensure consistency Expert Opinion. Experts (developers) will be more accurate in the estimation of development time. Managers will be more accurate in estimating business value. Collaboration between managers and experts needs to be done for more accurate estimation. Common Sense. Prioritization techniques help you to decide and not decide for you. Various other intangible factors need to be taken into consideration. Use Cases. It is commonly used to maximize economic benefits in business problems. Use cases are to prioritize projects, features, ideas, hypotheses, and user stories. RICE Scoring – Reach, Impact, Confidence, Effort The Rice scoring system is a prioritization framework that uses four factors viz, Reach Impact, Confidence and Effort to arrive at a decision. Being a quantitative prioritization technique, it relies more on data and removes the subjective and feeling aspects of decision-making. Further details of Rice and details of the Kano Model (Delighter, Satisfactory, Neutral, Dis-satisfied), MoSCoW Method: (Must have, Should have, Could have, Will have), Product Tree, Benefit Vs Effort can be read from the Benchmark Six Sigma Forum link here https://www.benchmarksixsigma.com/forum/topic/39068-rice-scoring/#comment-57229 Details of other Prioritization Matrix such as Eisenhower Matrix, 2x2 Matrix, Weighted Decision, VRDT, HEART, ICE, AARR, REAN are in the link in the references below. Some of them are explained below. VRTD Framework (SEO Content Prioritization) [Volume, Relevance, Difficulty, Time] There are four criteria for content prioritization i.e., volume, relevance, difficulty, and time Volume. This is the potential traffic to the website. The number of people who search for a keyword. It can be scored as 0 for less than <250, 1 for volume between 250 and 500, 2 for volume between 500 and 1000), and 3 for above 1000. These numbers are based on the average volume in your domain. Relevance. Traffic should be targeted and lead to conversions. How the keyword is relevant to the conversion to a customer. It can be scored as 0 for not relevant to 3 for highly relevant. Difficulty. Difficult keywords are difficult to rank in an SEO. The difficult score can range from 0 for easy to 3 for very difficult. Time is the time required to create content and can be scored as 0 for less than a day to 3 for above 10 days. The Final Score for the keywords is calculated as below Score = (Volume Score * 1) + (Relevance Score * 1) – (Difficulty*-1) – (Time Score*-1) HEART Framework [Happiness, Engagement, Adoption, Retention, and Task Success] The HEART Framework along with the Goals-Signals-Metrics is developed by Google to measure and improve User Experience. The HEART Framework uses categories to define user-centered metrics. ICE [Impact, Confidence, Ease of implementation] Prioritization The ICE framework is used to prioritize projects, marketing initiatives, features, user stories, hypotheses, etc in a rapid manner with limited resources. It takes into account both the value of the product feature and the efforts required. Score = (Impact + Confidence + Ease) / 3 Drawbacks. It is subjective. To circumvent the subjectiveness, the average score of the team can be taken. AARRR Framework [Acquisition, Activation, Retention, Referral, Revenue] The AARRR framework is a metric to understand user behavior. It is used for goal setting and customer journey optimization. Acquisition deals with the market channels used, Activation on the initial action that the user should take, Retention deals with repeat customers, Referral looks at the word-of-mouth aspect, and finally, Revenue deals with monetization. Importance of AARRR. Analyzing and understanding users’ behavior helps in targeting metrics that make a difference in the bottom line. It keeps the team focussed on what is important. REAN Framework [Reach, Engagement, Activation, and Nurture] Used to map and analyze goal setting, marketing effectiveness, and develop KPIs. Reach deals with brand awareness, Engage deals with audience interaction with the brand, Activation deals with conversion metrics, and Nurture deals with the effectiveness of the re-marketing efforts. RACE Planning Framework [Reach, Act, Convert, and Engage.] It is used for mapping and managing engagement activities. Reach deals with the volume of the website traffic, Act deals with conversions, time on site, likes, shares, etc., Convert deals with conversation rate optimization, retargeting, etc., and Engage deals with developing long term customers relationships. References https://www.benchmarksixsigma.com/forum/topic/39068-rice-scoring/#comment-57229 https://hello.ducalis.io/prioritization-frameworks/all-prioritization-templates

-
Johanan Collins replied to Vishwadeep Khatri's topic in We ask and you answer! The best answer wins!Advanced Product Quality Planning APQP is a structured tool for the design, development of the product/process in order to meet the customer’s expectations and requirements. The first Advanced Quality Planning handbook for suppliers was published by Ford Motors in the early 1980s. The success of this handbook led to the North American Automotive OEMs collectively bringing out the APQP process in 1994. This was then updated in 2008. The intention of APQP was to aggregate the common planning activities of all OEMs. IATF 16949:2016 Standard and Objectives. It is part of the five tools of the IATF 16949:2016 Standard. The other tools of the standard are MSA (Measurement System Analysis), FMEA (Failure Mode and Effect Analysis), SPC (Statistical Process Control), and PPAP (Production Part Approval Process). The objectives of APQP focus on communication, timely completion, minimal quality complaints, quality assurance, and customer requirements and expectations with a focus on risk mitigation associated with a change in the development of new products or processes. APQP uses cross-functional teams to understand the voice of the customer and translate it into clear technical specifications and characteristics. APQP - Phases APQP has five phases. They are plan and define program, product design and development, process design and development, product and process validation and the final phase is feedback, assessment, and corrective action. In “plan and define program” the customer’s needs and expectations are clearly understood. In “product design and development”, design features are developed. DFMEA (Design Failure Mode and Effects Analysis) and DFMA (Design for Manufacturability and Assembly is included). In “process design and development”, effective management systems to assure customer needs and expectations are built into the system. PFMEA (Process Failure Mode Effects Analysis) and control plans are part of this phase. In the “product and process validation” phase the manufacturing process is validated through a production trial run and production control plans are finalized. In the “feedback, assessment and corrective action” phase, continual improvement is undertaken in order to improve the customer satisfaction level. Benefits. The benefits of APQP are increased customer satisfaction and service performance. It helps in directing resources by identifying the vital few from the trivial many, on-time delivery of the quality product at a lower cost, reduction in variability, changes identified early in the development and avoiding changes after launch, mitigating risk, etc. When to use APQP? APQP involves the entire supply chain. It helps in communication between the supply chain, the organization, and the customer. The customer’s expectations are translated and understood throughout the entire supply chain. APQP hence brings the entire supply chain on one page with regard to the customers’ needs, and expectations. Use Cases. The use cases of APQP are below: - · New Product Introduction. APQP uses risk-based tools that focus on the entire range of aspects of the product and process such as design, quality control, service, packaging, continuous improvement, etc. APQP focuses on risk as a substitute for failure. · Product or Process Change (post-release). The change is done independently of the product development. The problems created by the change and its associated risks are prevented by using this approach. · Develop requirements from Voice of the Customer (VOC) and Quality Function Deployment (QFD). · Develop Product Quality plans, test plans, project timelines. · Linking DFMEA to PFMEA · Conduct Performance stability and capability studies in tandem with Statistical Process Control. Design for Six Sigma DFSS is a proven proactive approach to design used for translating the customers' and business needs into a well-designed product or service. It is used in process design and not process improvement for which the DMAIC methodology is used. DFSS incorporates the efficiencies of the six sigma methodologies in the new design. The DFSS team is cross-function to include all aspects of the product or service. The goal is to minimize the defects and variations at their root. DFSS not only reduces the time to market by between 25 to 40% but also ensures a high-quality product that meets customers' expectations. When to use DFSS? DFSS is used in the design of a totally new product or service. It is generally used when you replace a product instead of improving a product. This happens when the existing product or service is beyond improvement to meet the customers’ expectations. It is not used for incremental change to a process or product design. When designing a new product the DFSS methodology is used to prevent quality issues. It is used to optimize the design, shorten the time to market, meet the end users’ actual expectations, to provide a product or service at a very high-quality level for the first time. As in APAQ, it uses a Cross-Functional Team that focuses on what is Critical to Quality and the customers' requirements. The steps that DFSS could follow depend on various factors. DFSS could follow the DMADV, IDOV, or the DCCDI steps. In DMADV, the first three phases are similar to the DMAIC. In the Design phase of the DMADV, the Design of Experiments, Failure Mode and Effect Analysis, etc are undertaken. In the Verify phase of DMADV, Process FMEA is performed to evaluate the risk. Prototypes or pilots are undertaken and a Control Plan is developed. DFSS could also use DMADOV, which uses Optimization between the Design and Verify phases. Another variation to DFSS is Define Customer and Concept, Design, Implement (DCCDI) or the Identify, Design, Optimize, Verify (IDOV) APQP Vs DFSS · APQP is the product development process used as default to support supplier engagement. It is used to collaborate with suppliers. · DFSS is focused on high-value requirements or specifications that are different from past products. · APQP and DFSS share development tools and goals. · APQP is broader in scope than DFSS · APQP scales to the perceived risk that each supplier, design, or process contributes towards the success of a program. References https://en.wikipedia.org/wiki/Design_for_Six_Sigma DFSS and Advanced Product Quality Planning (APQP) in ISO/TS16949", Asian Journal on Quality, Vol. 8 No. 3, pp. 173-187. https://doi.org/10.1108/15982688200700031 https://quality-one.com/dfss/ https://quality-one.com/apqp/#:~:text=DFSS%20is%20a%20highly%20focused%20effort%20reserved%20for,%28OEM%29%20is%20preparing%20a%20new%20end%20user%20product.
-
Johanan Collins replied to Vishwadeep Khatri's topic in We ask and you answer! The best answer wins!What comes to your mind when you think about robots or bots? Some human-looking machine that does physical tasks! R2-D2 or C-3PO from Star Wars! However, with the increasing complexity and connectivity of the enterprise, automation of tasks done by humans on a computer interface is increasingly being automated. These are called Bots and offer the company a unique versatility by allowing it to scale based on the workload, budget, and other operational constraints. This change in the level of operations is done without any work stoppage or disruptions to the value chain. Besides scaling, and providing a better product/service, bots also give the company the capacity to work faster, with more precision, and leaner. Processes requiring repetitive and tedious action, require different levels of automation with regard to processes requiring a high level of cognition. Bots can be attended and/or unattended. Attended and unattended bots can be deployed at the same time to create a synergized, unified integrated platform. Bots can be thought of as different musicians/sections in an orchestra with each musician playing their part to create a beautiful harmony. Unattended RPAs Unattended Automation requires nil to very little human intervention. They are self-triggered and the tasks are endlessly completed in a batch process. That is to say that these bots can work round the clock throughout the year. If required, these bots can be monitored and controlled remotely via different platforms or interfaces. They can be analyzed, viewed, scheduled, and modified in real-time. This gives the employee a means to interact and collaborate with the bots and breakdown the communication and functional silos in the organization. Use Case Unattended Bots. These types of bots are generally used in back-office scenarios where a large volume of data is collected, sorted, analyzed, and distributed in the enterprise. Claim processing in Insurance companies are suitable candidates. Examples of unattended automation scenarios are below: - · Exception Based – Fully Automated RPAs · Human Prepared Processing · Validation through Human in the Loop Exception Based – Fully Automated RPAs Example. Health Insurance Companies are required to process large volumes of claims and invoices. The data is generally stored in a mix of multiple legacy and modern systems. APIs are not available for the integration of these multiple systems. Data has to be verified, updated, and moved between these systems A fully automated bot can be created to verify, move, update the data across all these systems. Based on the Service Level Agreements, the optimum number of bots can be deployed to process these invoices and claims. Human Prepared Processing These are processes that require human intervention to start the process, however can be automated once the process is started. This combines human creativity with software efficiency. Example. Mortgage Companies process a very large volume of mortgages. The Mortgage process involves human logic that is necessary to start the process, however, the rest of the process is repetitive and can be automated. The human logic designates when the appraisal is ordered, the required additions, and the appraisal firm. Validation through Human in the Loop In some cases, some processes require human intermittent intervention. Automation can be built into the process to seek human intervention when a problem arises. Example. The Accounts Payable Departments repeatedly process different types of not-standard invoices in different formats and forms. Machine Learning and Optical Character Recognition can be used to read these invoices. However, in case the unattended bot is unable to recognize the data, a human being would be called upon to intervene in the process and then hand over the process back to the unattended bot. Attended RPAs Attended bots require human intervention. These bots are at the employee workstation level and triggered by specific commands, actions, or events that the employee engages within the workflow. Since it generally involves switching between multiple interfaces, screens during the employee workflow, these bots are designed to be user-friendly and agile. Attended bots are generally restricted to a specific workstation, section, or department making the automation generally restricted to the employee engaging in the workflow at that moment Use Case Attended RPAs. These bots are generally used in customer-facing tasks. Call Centres are an ideal place for the use of attended RPAs. Call Centre operators need to switch between different screens and interfaces while addressing a customer issue. The unattended bots generally take care of the tasks involved in entering/retrieving the data so that the operator can spend more time interacting with the customer. Examples of attended automation scenarios are below: - · Attended, Interval: Robot takeover · Attended, in tandem: Working alongside the robot Attended, Interval: Robot takeover In Financial services companies, the process requires robot intervention at various stages to handle monotonous and repetitive tasks. The human can hand over control to the robot by some shortcut key to hand over this part of the process to the robot. In this model, there are a number of switches between the human and robot in order to complete the task. Attended, in tandem: Working alongside the robot This model is used when humans need to move between a conversation (Call centre) and repetitive tasks. This calls for humans and robots working alongside each other. In this case, the agent continues to focus on the customer, while the robot does the routine and mundane tasks References https://www.uipath.com/blog/rpa/unattended-attended-automation https://www.uipath.com/blog/automation/rpa-use-cases-part-one-unattended-robots https://www.uipath.com/blog/automation/rpa-use-cases-for-attended-robots-automation
-
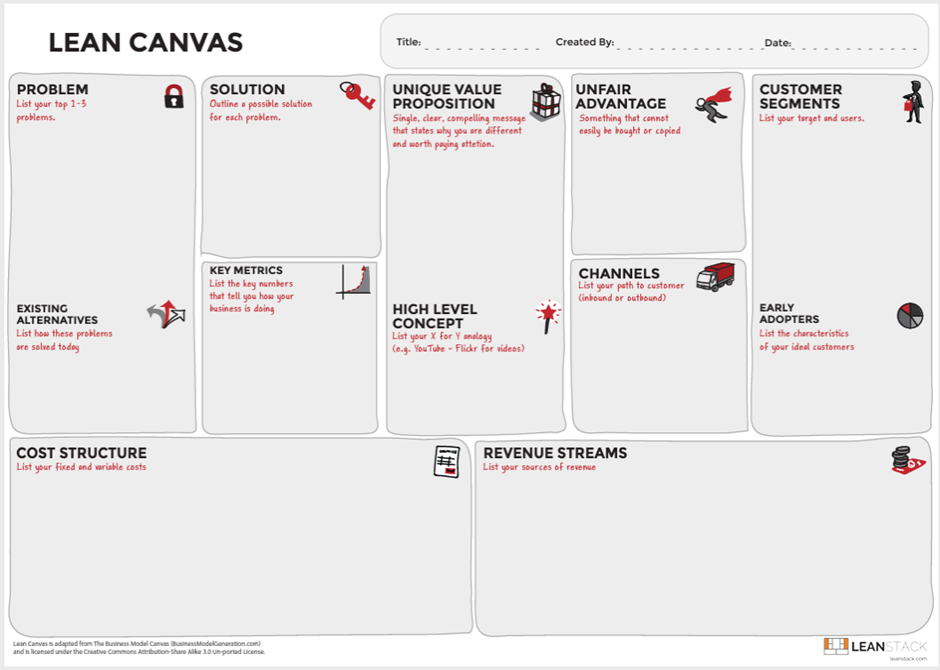
Johanan Collins replied to Vishwadeep Khatri's topic in We ask and you answer! The best answer wins!Lean Startup methodology is similar to Lean Manufacturing and Lean Software development with the aim to eliminate waste and increase value in the initial startup phase of a product or service. The Lean startup methodology ensures greater success with reduced funding, simple business plans, or an imperfect product/service. Continuous customer feedback is critical to lean startup methodology to ensure that the product/service is being developed as per the customers’ requirements. A minimum viable product is released and customer feedback is obtained early in the product design and development stage. Specific customer requirements are assessed through the minimal viable product, in order to develop the product/service required by the end-user with the least possible resources and risk. Objective - The Objectives of Lean Startup would be to shorten the product development cycle and to quickly check if the business model is viable by combining business-hypothesis-driven experimentation, iterative releases, and validated learning. Thus, we can say that Lean Startup methodology prioritizes customer feedback over intuition and flexibility over planning, with the assumption that Iterative building reduces the market risks and reduced initial capital requirements. Customer over Product - Customer development and not product development is key to the lean startup methodology. This was brought out by Steve Blank in his book “The Four Steps to the Epiphany: Successful Strategies for Products that Win” (2005, 5th edition 2013). The four steps of customer development as brought out by Blank are customer discovery, customer validation, customer creation, and company building. Customer discovery looks at the problem, the solution, and the business viability, customer validation looks at the business viability through purchases, customer creations look at scaling through customer acquisition, and company building looks at building the company departments and operations. Lean Startup Terminology - Eric Ries in this book “The Lean Startup” defined some specific terms. These are given below: - Minimum Viable Product. This is the minimum development of the product that would help in the collection of customer feedback to enable validated learning. Split Testing. This is also called A/B Test. Alternate versions are offered to the end-user at the same time. A statistical test is done in order to measure the difference in impact between the different versions. Actionable Metrics. These are important since they magnify the key drivers of the proposition. It may also be noted that vanity metrics for one firm may be an actionable metric for another firm. For example, page views may be an actionable metric for a magazine but a vanity metric for a financial firm. Pivot. A course correction to test a new premise about a product or strategy. Innovative Accounting. This deals with how to maintain accountability, maximize outcomes through the measurement of progress, planning milestones, and prioritizing activities. Build-Measure-Learn Loop. This loop is a learning cycle to Build a Minimum Viable Product, measure its effectiveness in the market, and learn and decide if you need to continue to pivot. Speed is critical in this iterative loop. Lean Principles used in Lean Startup Define Value - Lean startup determines right from the initial phase through the Minimum Viable Product actual or latent need of the customer that they are willing to pay for. The Build-Measure-Learn loops help in determining the value of what the customer wants, how they want it delivered, and the price which they are willing to pay for it. Map and Value Stream - Lean startup methodology prioritizes the customer’s value stream over the product. Starting with the customer as a reference point, the Lean startup methodology is able to measure through actionable metrics, what the customer values and what contributes to waste. Flow - The iterative Build-Measure-Learn loop that the Lean startup uses, would ensure the removal of steps that cause delays and thereby ensure flow in the process. Pull - The pull is created from customer needs. The Lean startup is focused on customer needs and hence incorporates a pull-based system into the lean startup methodology. Design of a product/service using Lean startup and Pull would ensure that the product developed would not only eliminate waste but also satisfy the customer's need. Perfection/Continuous Improvement - The iterative Build-Measure-Learn loop is akin to Continuous improvement which is the bedrock lean principle. Lean Canvas This is an adaptation of Alex Osterwalder’s Business Modelling Canvas which was developed by Ash Maura in 2010 for startups. It is a one-page business plan template. It replaces the problems/solution blocks and the key metrics/unfair advantage blocks in the Business Modelling Canvas with Key partners/Activities and Key resources/Customer relationships blocks respectively. It looks at the customer problems and delivers solutions through a unique value proposition. The Lean Canvas has nine sections viz. Identification of the Customer Segments. This includes the likely target customers of this product or service. Identification of the Problem. What are the top three problems of your target customers? Revenue Streams. What are the likely sources of revenue? Solution. What are the likely solutions to the problems faced by the customer segment? Unique Value Proposition. What is the single, unique, clear, compelling proposition that would engage a visitor and keep him interested in the product or service? Channels. What are the likely paths to my target customers? Key Metrics. What are the metrics that give a clear picture of the current position of my business? Cost Structure. What are my fixed and variable costs? Unfair Advantage. In what areas do I have a competitive advantage. A resource that has a competitive advantage should be valuable, rare, inimitable, and non-substitutable. Lean Canvas and Creation of the Lean Startup? The Lean Canvas gives a bird' eye view of every element that is necessary for the development of a Lean startup product or service. It draws the boundaries of every element that needs to be taken into consideration in the development of a product or service. Since the lean startup methodology is required to progress quickly within the Build-Learn-Measure loop, the Lean Canvass acts as an excellent template/framework to keep the development within viable boundaries. References https://en.wikipedia.org/wiki/Lean_startup https://theleanway.net/The-Five-Principles-of-Lean
-
Johanan Collins replied to Vishwadeep Khatri's topic in We ask and you answer! The best answer wins!Product Led Growth (PLG). Product led growth leads the user to experience value without hand-holding. This is gaining more importance now than in the past. A company that follows a strategy of PLG would depend on the experience of the customer to acquire and retain its market share. For PLG to be successful, there should be complete alignment between all departments such as Operations, Quality, Production, Procurement, HR, Marketing Sales, R & D, etc. Examples of PLG companies are Tesla, Apple, Zoom, Atlassian, Calendly, Slack, Dropbox. Sales Led Growth (SLG) Sales Let Growth is the traditional way of growth. In Sales led growth, there is a need for a salesperson to provide assistance in order for the end-user to have a meaningful outcome. Sales-led growth is less cost-efficient than Product led growth as it has a longer sales cycle and time-to-value. It leads to a lower revenue per employee as the firm needs to have more staff to offer support. As against Product led growth companies that target smaller businesses, Sales led growth targets bigger businesses. It is ideal for products targeting enterprises. In these companies, the users don’t have the incentive to use the product and hence need the support of the salesperson. In the case of Sales led growth, the switching cost is very high, hence the lifetime value is much higher. Deciding Factors to Choose one over the other PLG would be suitable for individual, smaller businesses, self-service products, transactional products, free trial, freemium option, online purchase, pricing tier pricing strategy, great user experience, product simplicity, minimum to nil setup, configuration, and training. A Sales Led Growth is more suitable for enterprises where the product is complex, expensive, and sophisticated and requires human assistance. It is used in places where the user does not either have the incentive, experience or is not proficient in the use of the product. It is also used in immature markets or in markets that are not yet ready for this type of product. References https://blog.close.com/product-led-sales-led-marketing-led/#:~:text=The%20first%20difference%20between%20product-led%20and%20sales-led%20is,number%20of%20subscribers%20%28email%20automation%20tools%20like%20Mailchimp%29 https://productled.com/blog/product-led-vs-sales-led/
-
Johanan Collins replied to Vishwadeep Khatri's topic in We ask and you answer! The best answer wins!Simply put a number of related projects managed together form a program and a number of unrelated projects/programs managed together form a portfolio. Project Management A Project is a temporary endeavor that has a start date/time and finish date/time and consumes resources. It is broken down into various tasks. Hence, we can say that a project has a charter, the deliverables, timeframe, budget, commitment of resources right at the beginning of the Project. Program Management A program is generally a long-term endeavor that consists of a number of concurrently executed projects. Hence, we can say that a program will align with the organizational strategic goals. The benefits of a program are ongoing and hence it does not have a specific timeframe. It moves from one level of improvement to the next level. The budget for a program is generally earmarked in the annual budget of the organization. Programs are managed at the higher levels of management. A program would accomplish multiple organizational goals, have multiple small deliverables over time, have mid-course corrections, change in plans, have ambiguity in the output, and will be ongoing. Program management helps the organization select projects based on its long-term strategic goals by constantly addressing the business risk. It helps maintain constant communication with all stakeholders thereby ensuring that the entire organization and its stakeholders are on the same page. By looking at the bigger picture, program management helps to effectively prioritize resources. Overall, it encourages an environment of continuous improvement towards a common strategic goal in the organization. Portfolio Management To begin with, a Portfolio has a bigger scope and objectives than program or project management. It deals with macro-management of the organization as against micromanagement in a Project. PMI defines portfolio management as it “ensures that an organization can leverage its project selection and execution success. It refers to the centralized management of one or more project portfolios to achieve strategic objectives.” This centralized management helps the organization achieve its overall long-term strategical objectives by setting project priorities based on the overall business objectives to make sure that the benefits to the business are optimized. It may however be noted that portfolio management does not oversee each individual project or program. PMI Study Circle defines a portfolio as a group of unrelated or related programs/projects. Hence it can consist of multiple programs or projects. As against project management, which consists of similar projects, a portfolio generally consists of dissimilar programs/projects. The KRA for a portfolio is the combined performance of its components which could be projects/programs. Portfolio Management supports the programs and projects through the optimum allocation and utilization of resources based on the organization’s long-term strategic goals. It results in better economies of scale and fewer risks. It ensures constant communication and better coordination among the stakeholders of the programs and projects leading to lesser conflicts and greater overall success of the programs and projects. Example Portfolio. The goal of a political party is to come to/remain in power. In order to come to/remain in power, the party has determined that it needs to focus on primary education, health care and women empowerment. These three focus areas would form the portfolio of the political party. Program – Primary Education. In the area of primary education, the party may decide on a program to reduce illiteracy in the country. It could break down this program into various projects such as building new schools, increasing the infrastructure in existing schools, training, and induction of new teachers. Program Health Care. In the area of health care, the party may decide on a program to increase the outreach of health care at the village level. It could break down this program into various projects such as building new hospitals/clinics, increasing the infrastructure in existing hospitals/clinics, training, and induction of new doctors and nurses. Program Women Empowerment. In the area of women empowerment care, the party may decide on a program to increase the percentage of women in the workforce. It could break down this program into various projects such as encouraging parents to educate daughters, encouraging parents to get daughters married after completing their education, creating a women friendly work environment. References https://www.clearpointstrategy.com/difference-between-program-and-project-management/ https://www.pmi.org/learning/featured-topics/portfolio https://pmstudycircle.com/project-management-vs-program-management-vs-portfolio-management/#:~:text=%20Program%20management%20manages%20similar%20projects%20while%20portfolio,changes%20with%20the%20strategic%20objectives%20of%20the%20organization.
-
Johanan Collins replied to Vishwadeep Khatri's topic in We ask and you answer! The best answer wins!Customer Journey Maps CJM is a visual depiction to understand what motivates and demotivates the customer. It looks at their needs, hesitations, and concerns. CJM moves the experience from a transactional process to building a relationship with the customer. CJM helps understand the way the consumers live and help to use this knowledge to design the right user experience for the customer. This is a view that is consumer-centric, covering the entire spectrum of the value chain such as the supply chain, operations, marketing, technology, hence an entire ecosystem that puts the consumer at the very focus CJM can also be described as a visual storytelling tool that maps out the relationship between the customer and the business over time. It depicts the engagement of the brand at various touchpoints with the customer. CJM is thus the customer's perspective as to how he/she engages with the business at various touchpoints. Businesses that do not give cognizance to this experience of the customer in the design of their process in customer engagement are more likely to fail. Major touchpoints can be purchases, orders, inquiries, or browsing of your online store. It could arise from traditional advertisements on TV, radio, newspapers, magazines, etc, or online digital marketing such as the use of Facebook Ads, Google Ads, etc. Advantages of CJM The Advantages of the CJM are numerous. It provides 30,000 feet view of the entire journey with the customer, it helps identify and sort out the customer's problems, it helps to build quicker and higher customer conversion rates and improve customer retention, it helps focus on the experience of the customer in each channel, it helps identify the progress and fallout points of the customer, it helps to prioritize the areas requiring improvement and it can help reveal the gaps between the departments and various marketing channels. Design Thinking Design thinking was an innovative approach to problem-solving that was predominantly used by the design community. It gained popularity in other domains after the publication of the Harvard Business article in 2008 “Design Thinking by Tim Brown. Wikipedia has defined design thinking as “a set of cognitive, strategic and practical processes by which design concepts are developed. Many of the key concepts and aspects of design thinking have been identified through studies, across different design domains, of design cognition and design activity in both laboratory and natural contexts. Design thinking is also associated with prescriptions for the innovation of products and services within business and social contexts”. CJM, Design Thinking and the Social Context Important to note in this definition is not only the key concepts of design thinking being identified from across different design domains but its application across various domains. Also of note in this definition is its association with prescriptions/innovations of both products and services with business and social contexts. The social context of the customer is becoming increasingly more important in the customer's journey towards the selection and use of a product and service. Social issues such as human rights, animal rights, global warming, etc. are becoming increasingly more important to the customer. Design Thinking Steps and CJM MIT in their article Design thinking, explained by Rebecca Linke, has indicated that the steps involved are “to fully understand the problem; explore a wide range of possible solutions; iterate extensively through prototyping and testing, and implement through the customary deployment mechanisms. As part of understanding the problem, the author brings out the importance of involving the end-users in understanding the problem and design of the solution. The Customer Journey Maps would go a long way in helping in understanding the problem and design of the solution. Visual Paradigm (visual-paradigm.com) has recommended six steps in creating the Customer Journey Map. These are defining the persona of the customer you are going to map. This may include their goals, motivations, pain points, etc. The next step is to define the customer's stages through which the customer will journey. These would be the major goals they are trying to achieve at that given phase. The third step is the touchpoints the customer is going to use to engage you. This is followed by the conduct of research, determining the friction points, and finally resolving the issue. Integrating design thinking and CJM would go a long way in preventing the design team working in silos and bringing innovative products and services to market that are lead to customer delight. References https://www.ey.com/en_us/consumer-products-retail/experience-led-consumer-journey?WT.mc_id=10649218&AA.tsrc=paidsearch&s_kwcid=AL!10073!10!72224410603189!72224849702987&msclkid=6e959f1441fe1f26d6a1fd108fa97139 https://en.wikipedia.org/wiki/Design_thinking https://www.visual-paradigm.com/guide/customer-experience/what-is-customer-journey-mapping/ https://mitsloan.mit.edu/ideas-made-to-matter/design-thinking-explained
-
Johanan Collins replied to Vishwadeep Khatri's topic in We ask and you answer! The best answer wins!Why Project Charter is Important? The Project Charter is a written document signed off with the project team and the project sponsor. It is also called the project scope statement or the sponsor document and includes the justification (opportunity statement, pain points, problem areas), the business case (financial benefits), the goal statement (success criteria, deliverables based on SMART objectives) the scope (in scope and out of scope), the team and the project plan. It is the basis on which future decisions are made. It is a document based on which the project team, can communicate with stakeholders to take the project forward. It authorizes the project team to use the organizational resources to take on the Project. It basically transfers the project from the champion to the project team. The project charter is not pulled out of thin air or without much thought. Considerable time is spent on its creation. This would include the conduct of a feasibility analysis to determine if it is a valid project, examine the project metrices, the financial benefits, propose a realistic budget, the Work Breakdown Structures, a feasible project schedule, Gantt charts, network diagrams, deadlines, check availability of internally available resources, determine ways on how to measure the success of the project and monitor satisfaction with the project progress. The Project Charter is also called the sponsor document. It is like a contract between the project sponsors (higher management) and the project team, wherein the expectations from the project sponsors and the project team are elucidated so that there is uniformity in understanding the project. It is a key document which gives the scope and purpose of the project at a high level. Risks of not having a Project Charter are No clarity of what is expected of the team No focus of the team Team will not be aligned as per the priorities No commitment of resources Without a project charter, the business case would not exist. The business case describes the big Y, the very reason for taking up the project. Without a project charter, the team will not know the nature of the problem, where it is appearing or its size. The team will not know the goal, what is to be accomplished by the end of the project, a measurable target, of a completion date. Without a goal statement, the team will not know what the goal is going to look like. Without the project charter, the team will not know the boundaries of the project and the key parameters that are included in the project The Project Plan lays down the milestones, of each phase. It lays down the who, what, when, where, how, and how much of the resources in terms of people, money, etc that will be needed. The Project charter gives the details of the team members available. Hence without knowing who is on the project team, their skills, capabilities, the project will be difficult to manage Taking on a project without a project charter is like randomly shooting an arrow and then drawing the target around it. It is like a pilot without a flight plan References https://blog.masterofproject.com/six-sigma-project-charter/#:~:text=The%20Six%20Sigma%20project%20charter%20essentially%20is%20a,defines%20the%20scope%20and%20purpose%20of%20any%20project.
-
Johanan Collins replied to Vishwadeep Khatri's topic in We ask and you answer! The best answer wins!Data Dredging Data dredging is the abuse of data analysis to detect patterns in data that can be used to show statistical significance when no significance exists. This searching of patterns can lead to an increase in false positives. It could be done by conducting various statistical tests, randomly changing the model parameters, and cherry-picking the findings that lead to statistically significant results. It is also called data butchery, snooping, fishing, significance questing or chasing, selective inference, or p-hacking. simplicable.com describes data dredging as being similar to data mining with the key difference being that data dredging is an automatic statistical search that does not have a hypothesis but just looks for patterns in data whereas data mining starts off with a hypothesis (what you are expecting to find in the data). With large data sets and computing power, the probability of finding correlational patterns in data would increase. It, therefore, looks for a pattern that fits the data rather than confirming if a pattern exists in the data. Data dredging makes it easier to write an academic paper that is auto-generated but is not valid. Harmful Effects It is unethical and misleads other researchers and has a negative effect on the Body of Knowledge. It increases the number of false positives leading to wrong decisions being made based on the results It could lead to the retraction of previously published articles. It increases the bias in the study and decreases the range of probability It could lead to sub-optimal utilization/wastage of resources such as funding and researchers. How to prevent it? Dispel the belief among academicians that not statistically significant results are not important. Publish or perish. The practice of publish or perish which puts researchers under pressure to regularly publish research articles in order to continue in their position needs to be reviewed by the academic body. Take strict disciplinary action against researchers who engage in data dredging and other such practices Institutional Review Board (Approval). Making it mandatory for IRB approval, prior to the researcher engaging in research. Making it mandatory for researchers to do courses such as “Responsible conduct of research” prior to engaging in research Peer Review Journals Vs Predatory Journals. Discouraging researchers to publish in predatory journals. References https://simplicable.com/new/data-dredging https://s4be.cochrane.org/blog/2021/06/25/what-is-data-dredging/ https://en.wikipedia.org/wiki/Data_dredging
-
Johanan Collins replied to Vishwadeep Khatri's topic in We ask and you answer! The best answer wins!Single Factor Experiments - Unbalanced Data. This is when the number of observations taken within each treatment is different. Advantages of using a Balanced Design / Disadvantages of Unbalanced Design The test statistic is relatively insensitive to small departures from the assumption of equal variances for the treatments if the sample sizes are equal. (This is not the case with unequal size samples) The Power of the Test is maximized if the samples are of equal size In an Unbalanced Design ANOVA, a modification is made to the Sum of Squares formulas. Factorial Design – Unbalanced Data Reasons. Designed as a balanced design initially, however, due to unforeseen problems in running the experiment, may result in loss of some observations Designed as an unbalanced experiment intentionally. This may be the case when certain treatment combinations may be more expensive or more difficult to run, hence fewer observations may be taken in these treatment combination cells. This may be the case when some treatment combinations may be of greater interest to the experimenter as they may represent new or unexplored conditions, so the researcher may do more replication in these cells. Unbalanced Design Examples Proportional Data. Here the number of observations in any two rows or columns is proportional. In this case, normal ANOVA works with minor modifications for the sums of squares formula Approximate Methods When the unbalanced data is not far away from the balanced data, an approximation can be done to convert the unbalanced data to a balanced one. Some of the ways approximation are done is given below Estimating the mission Observations. If only a few observations are different, a reasonable procedure for estimating the missing values can be done. For a model with interaction, the estimated value should reduce the Error Sum of Squares. This can be done by taking the average of the observations in Cell (2,2) having 3 observations (1 observation missing). Setting Data Aside. In this case Cell (2,2) has one data point more than the other cells, we set aside one observation from Cell (2,2) in order to obtain a balanced design Method for Unweighted Means. This method was introduced by Yates (1934) in which the cell averages are treated as data and subjected to standard balanced data analysis to obtain the Sum of Squares for rows, columns and interactions. This is an approximate procedure because the sums of squares of the rows, columns and interactions are not distributed as chi-square random variables. Weighed Squares of Means Method. Also proposed by Yates (1934). In this method, the terms of the sums of squares are weighted in inverse proportions to their variance. Exact Method This is done when empty cells occur (nij = 0) or when nij are very different. Here we develop the sums of squares for testing the main effects and interactions by representing the ANOVA model as a regression model. References Design and Analysis of Experiments by Douglas C Montgomery, International Students Edition, Eight Edition


-
Johanan Collins replied to Vishwadeep Khatri's topic in We ask and you answer! The best answer wins!John Wilder Tukey an American statistician and mathematician developed the Rootogram. He is also known for the Fast Fourier Transform algorithm, the Tukey Lambda distribution, Tukey test of additivity, Tukey range test and the Teichmeller-Tukey lemma. Oxford Reference Definition Oxford Reference defines a rootogram as “a diagram suggested by Tukey in 1971, for comparing an observed bar chart or histogram (with equal-width categories) with a theoretical probability distribution. The comparison is made easier by ‘hanging’ the observed results from the theoretical curve so that the discrepancies are seen by comparison with the horizontal axis rather than a sloping curve. As in the rootogram, the vertical axis is scaled to the square root of the frequencies so as to draw attention to discrepancies in the tails of the distribution.” R Package Documentation Definition The R Package documentation describes the rootogram function to “graphically compare (square roots) of empirical frequencies with fitted frequencies from a probability model.” “Rootograms graphically compare frequencies of empirical distributions and fitted probability models. For the observed distribution, the histogram is drawn on a square root scale (hence the name) and superimposed with a line for the fitted frequencies. The histogram can be “standing” on the x-axis (as usual), or “hanging” from the fitted curve, or a “suspended” histogram of deviations can be drawn. “ Paper of Use of Rootogram for Count Data A rootogram is a visual tool that was initially used by Tukey to assess the goodness of fit of univariate distributions. Christian Kleiber of the Universitat Basel and Achim Zeileis of the Universitat Innsbruck in their paper “Visualizing Count Data Regressions Using Rootograms” have used rootograms to look at issues such as overdispersion, excess zeros in regression models for count data. Count data regression plots are done in the form of bar plots of the expected and observed frequencies. Rootograms are used to see the fit of both continuous data and count data. Rootograms compare the observed frequencies using bars (histograms) and the expected frequencies using a curve on a square root scale. Taking the square root scale transforms the date to adjust to the scale differences across the intervals. This makes the deviations across the interval for smaller observed/expected frequencies to be more visible in the plot. For example, the deviations of 9 as comped to 3600 would only be 1:400, however, the square of the numbers 3 and 60 is 1:20. This is a visual magnification of 20 times. There are three types of rootograms. The standing rootograms show the bars and a curve. In this, the deviations are not aligned. The standing rootogram is the least used as it just plots the bars and the curve representing the model, however, the fit is not shown. The hanging rootograms align all the deviations along the horizontal axis. The bars are hanging from the curve representing the expected frequencies whereas the suspended rootogram shows mainly the deviations as against the observed frequencies. The hanging and suspended use the horizontal reference line which shows the deviations between the observed and expected frequencies. Example of Rootogram for Poisson Distribution and Negative Binomial Distribution Analysis of above Rootograms Rootograms are used to detect patterns such as runs of positive or negative deviations. The top row of the figure above shows only small deviation when fitting a Poisson model to Poisson data. The expected frequencies and observed frequencies show minimum deviation. In the bottom row of the figure above shows large deviations when fitting a negative binomial distribution. The expected frequencies do not track the observed frequencies. References Kleiber, C, Zeileis, A. (2016). Visualizing Count Data Regressions Using Rootograms. American Statistician, Volume 70, Issue 3, Pages 296 to 303 Oxford Reference (https://www.oxfordreference.com/view/10.1093/oi/authority.20110803095919378 R Package Documentation https://rdrr.io/rforge/topmodels/man/rootogram.html

-
Johanan Collins replied to Vishwadeep Khatri's topic in We ask and you answer! The best answer wins!Parametric tests to compare variances for more than two populations are given below One Independent Variable – 1-Way ANOVA (Completely Randomized Design). Subjects are assigned randomly to treatments. This design contains only one independent variable with one or more classifications or treatment levels. In this design, the Total Sum of Squares (the variation in the data - SST) is divided into the variance from the treatment (Between Group Variation i.e the columns - SSC) and the error variance (unexplained by the treatment, i.e. within-group variation. SSE). ANOVA compares the relative size of these two variances using the F Statistic which is the ratio between the two variances. SST = SSC + SSE Assumptions for ANOVA. Data is randomly drawn from a normally distributed population and the variance of the populations is equal. Use of Confidence Intervals. In the event of the results being significant (p-value<Alpha) the researcher needs to do a post hoc or posteriori test to determine which group is statistically significant from the rest. In order to determine this the Confidence Intervals are plotted and significance is determined by examining the overlap between the confidence intervals. In addition, Tukey’s Honestly Significant Difference (HSD) test for Equal Sample Sizes, or the Tukey-Kramer Procedure for Unequal Sample Sizes. Example. The sample consist of the pipe diameter of 4 operators. The p-value < 0.05 indicates that one or more one operator is statistically significantly different from the other operators. Examining the 95% Confidence Interval of the Operators, it can be observed that the Confidence Interval of Operator 3 does not Overlap with other Operators. This is also evident from the Fisher Individual 95% Cis and Tukey Simultaneous 95% CIs and the Box Plot. Thus, we can conclude that Operator 3 is significantly different from the other 3 Operators. Further, the Fisher Individual 95% Cis and Tukey Simultaneous 95% CIs have also bet the Operator 3 is a separate group from the remaining 3 Operators. One Independent Variable + 1 Block Variable – Randomized Block Design. The Randomized Block Design is similar to the Completely Randomized Design; however, it has a second variable, referred to as the Blocking Variable that is used to control for confounded or concomitant variables. These variables are not controlled by the researcher but affect the outcome and hence need to be blocked. The SSE (Error Sum of Squares) is segregated into SSR (Sum of Squares Blocks) and SSE (New Error Sum of Squares) SST = SSC + SSR + SSE Repeated Measure Design is a randomized block design in which each block level is an individual item/person and that person/item is measured across all treatments. It helps researchers to determine if the means of three or more measures from the same person are similar or different. The repeated measure ANOVA controls the between-subjects variance by removing it from the error term and measuring it separately. ANOVA for Latin Square Design The Latin Square Design utilizes the Blocking principle. It is used to remove two nuisance sources of variability which are in the rows and columns of the square. The rows, and columns are the two restrictions on randomization. The model is totally additive, in that there is no interaction between the treatment, rows and columns. The Analysis of Variance divides the total sum of squares into the sum of squares for the rows, columns, treatment, and error. The F test ratio of MS(Treatment)/MS(Errors) is used to determine if there is no difference in the treatment means. (MS – Mean Sum of Squares) Randomized Incomplete Block Design. When it is not possible to run all the treatment combinations in each block, the randomized incomplete block design is used. When all treatments comparisons are equally important, the Balanced Incomplete Block Design is used. This design ensures that each block is selected in a balanced manner so that any pair of treatments are selected the same number of times as any other pair. Two Independent Variables – Two-Way ANOVA In this design, two or more independent variables are explored at one time. These are also called factorial designs. In this design, each and every level is studied under the conditions of every level of all other treatments. The design can have 3,4, …, n independent variables being studied at one time. For example, the independent variables can be machines, operators, shifts, day of the week, suppliers, and raw materials. All of these independent variables can be done in one study. This will be a Six-Way ANOVA. The Completely Randomized Design, the Randomized Block Design, and the n-Way ANOVA all have one dependent variable. Chi-Square Goodness of Fit Test. This test is used to analyze the probabilities of multinomial distribution trials along a single direction. For example, to study Education with 4 possible outcomes, viz. illiterate, Primary School, Secondary School, Bachelors's and above, the single dimension is Education and the possible outcomes are the levels of education. Also, it is imperative that on one trial only one outcome can occur. The Chi-Square Goodness of Fit test measures the difference between the observed frequencies and expected frequencies. The Chi-Square Distribution is used to measure the significance. It is a one-tailed test since Chi-Square of Zero means the perfect agreement between observed and expected values. Chi-Square – Test of Independence. The Goodness of Fit test cannot be used to measure the analyse two variables at one time. For this purpose, the Test of Independence is done. Test of independence can analyse the frequencies of 2 variables with multiple categories to determine if the two are independent. Use Case. To determine if the type of pizza topping is independent of the customer's age or the citizenship is independent of investment in bitcoin. Non-Parametric tests to compare variances for more than two populations are given below One Independent Variable – Kruskal Wallis Test. This test is the nonparametric equivalent to the one-way ANOVA. It is used to check if 3 or more samples come from the same/similar or different populations. It can be used for Ordinal Data and is not based on the shape of the population distribution. It assumes that the groups are independent of each other and random selection of items in the groups. The Kruskal Wallis Test for the above data shows a p-value of < 0.05 indicating that one of the operators is statistically significant from the others. Examination of the results shows that Operator 3 is significantly different from other operators. One Independent Variable – Mood’s Median Test. It is used instead of the Kruskal Wallis test when there are outliers present in the data. The results from the Mood’s Median Test indicate a p-value of 0.003 with is significant with an Alpha of 0.05. Confidence Interval Mood’s Median Test. On observing the 95% Midian Confidence Interval of the three operators, it can be seen that the CI of Operator 3 is distinct from the other operators. One Independent Variable + 1 Block Variable – Friedman Test This is the nonparametric equivalent to the randomized block design. If the normality of the data cannot be assumed or the data is ranked the Friedman test is used. It assumes independent blocks; no interaction is present between blocks and treatments, and the observations within each block can be ranked. In the Friedman Test below, the Day of the Week is Blocked. The p-value of 0.007 < Alpha of 0.05 indicates that one of the operators is statistically significantly different. On observation, it can be seen that Operator 3 is different from the rest of the Operators. Multivariate Analysis of Variance (MANOVA). This test is used when there are more than one continuous Dependent Variables. A one-way MANOVA would examine the effect of one independent variable on two dependent variables. For example, to study the effect of education on income and expenditure. A two-way MANOVA would examine the effect of two independent variables on two dependent variables. For example, to study the effect of education and citizenship on income and expenditure. Multivariate Analysis of Covariance (MANCOVA). This test includes covariates. It involves finding out the statistical significance between multiple dependent variables (continuous) and an independent (grouping) variable and controlling with additional variables called covariates. Covariates reduce the error term hence the effect of the covariate is removed from the relationship of the independent and dependent variables. References https://medium.com/nerd-for-tech/everything-about-manova-and-mancova-4c1c237af464

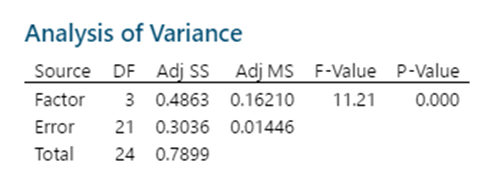
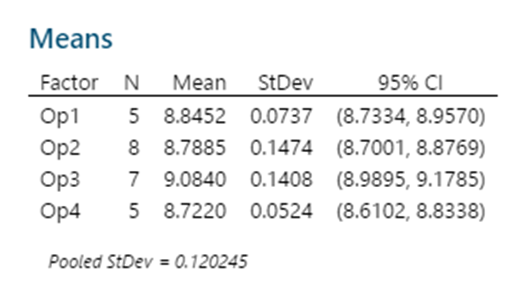
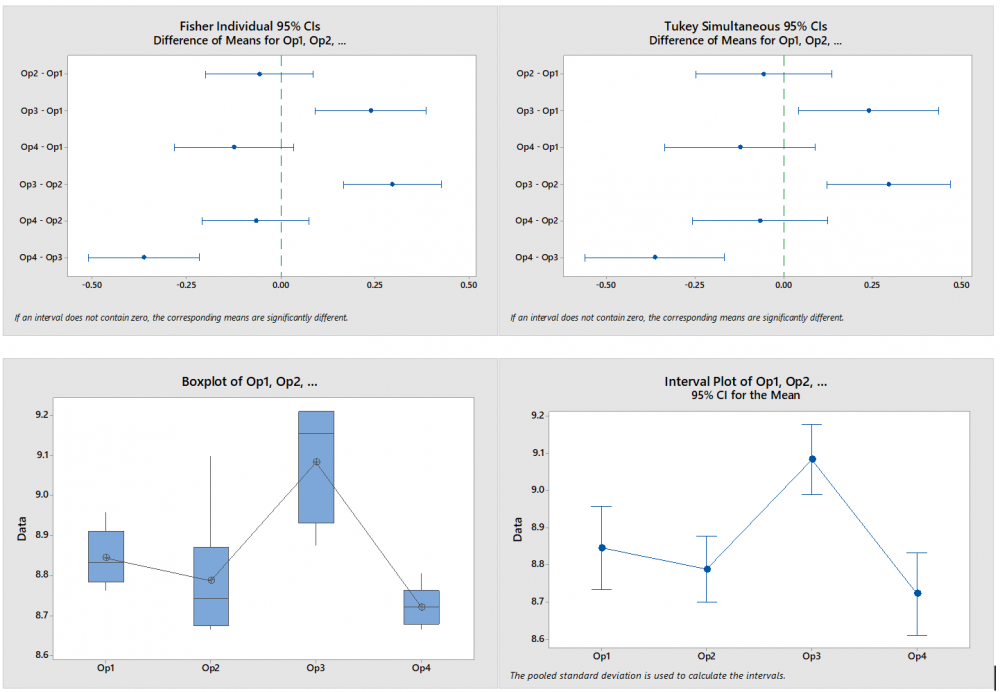
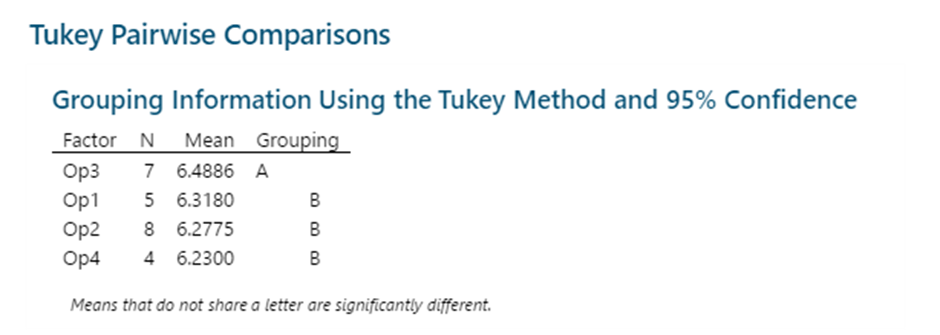
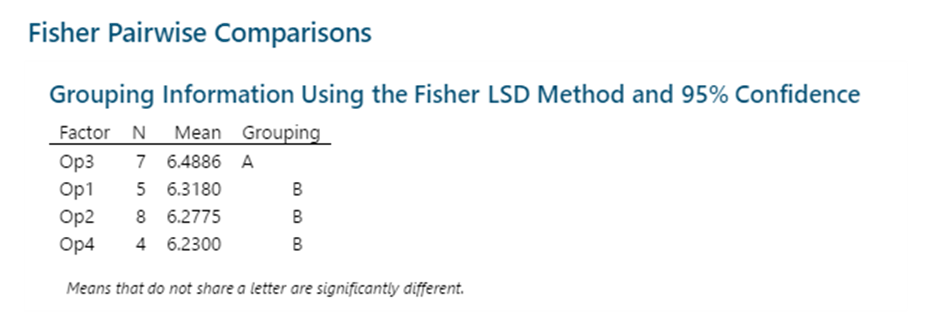
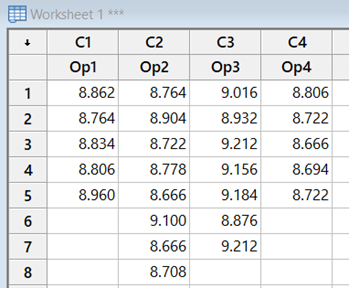

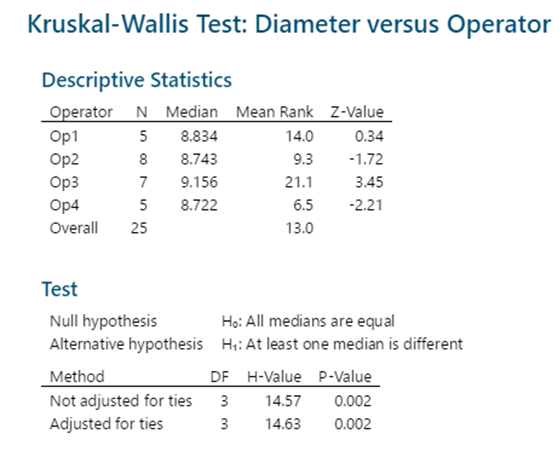
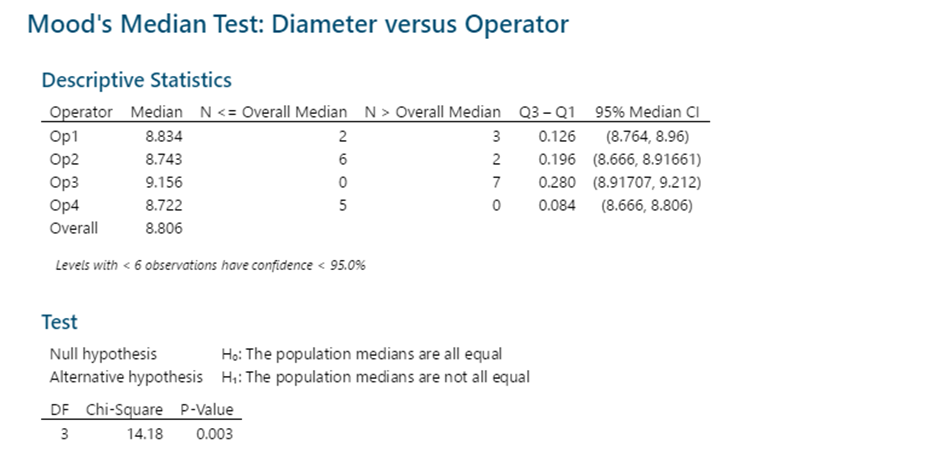

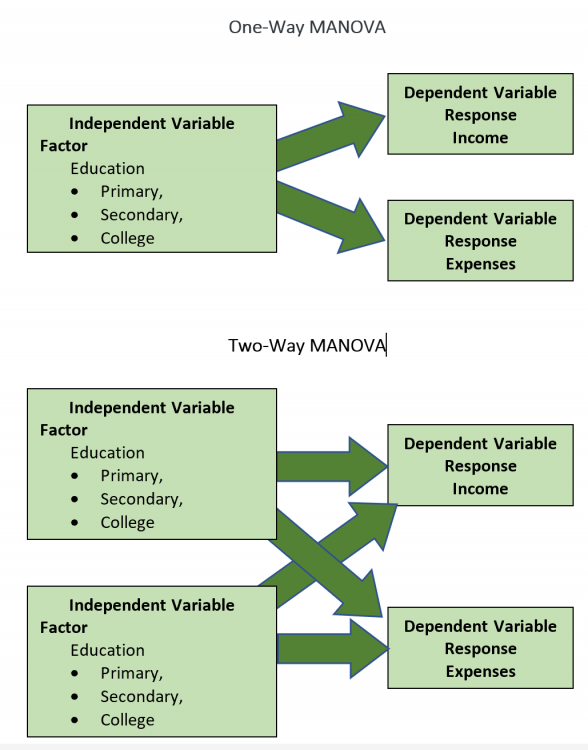
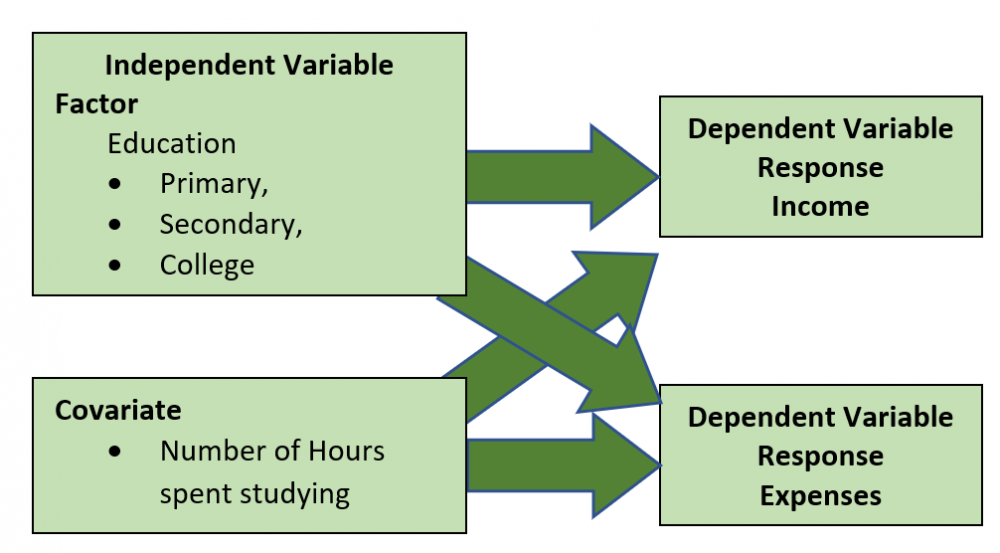
-
Johanan Collins replied to Vishwadeep Khatri's topic in We ask and you answer! The best answer wins!What is Yamazumi Chart? The Yamazumi (Japanese for to stack up) chart is a Lean tool that is used in Business Process Improvement. It displays the source of the cycle time of a process. It is a stacked bar chart. It helps in improving the process efficiency through the optimization of the process. Each process is plotted on the X-Axis. Each task of the process is either designated as Value Add or Non-Value Add or Non-Value Add Step that is necessary and is individually stacked up on a bar chart. The Y-Axis measures the mean cycle time. A Value-Added Step is any activity that changes the form, fit, or function of the material or to meet the customers’ requirements or an activity that the customer is willing to pay for. It is done right the first time. A Non-Value-Added step is a waste, adding no value to the customer but raises cost and increases the time. NVA steps include defects, errors, omissions, setup, inspection, and the 7 causes of waste. (TIMWOOD). Required NVA steps are a business, employee, or process necessity such as accounting, payroll, and inspection. A target cycle time which generally is the mean cycle time is plotted and the line balancing of the process is undertaken. Besides line balancing the Yamazumi chart can also be used for waste reduction. Line balancing can be done through rearranging, deleting, or combining tasks/processes. How Yamazumi Chart improve process efficiency? The Yamazumi chart is a tool that helps to quickly visually identify the cycle times, VA and NVA components of each process, and the potential areas of bottle-necks. An unbalanced line leads to bottle-necks at the processes with higher cycle time. The visual identification of the process helps in balancing the line and adjusting the cycle time of each process closer to the takt time. This would improve the throughput and hence process efficiency. Example After line balancing, the throughput has improved from 51.4 units per hour to 64.3 units/hour References: http://www.leanlab.name/what-is-the-yamazumi-chart