

MaheshKumar
Members
-
Joined
-
Last visited
-
EMO Index :- is a tool used to measure feelings of a customer or stakeholders or a group of customers for a company, product or service. It is an alternative to traditional customer satisfaction research. EMO Index is one of the indicator which measures the emotional state of customers and stakeholders. EMO Index is a registered trademark of EMO Insights International. In 2012 Company introduced the indicator in Emotional Management study in the Spanish Retail Banking Market . This study was conducted on Spain residents based on 1,968 interviews of retail banking customers, including male and female having age 18 and over. Neuroscience techniques were used to analyze the customers' past and current experiences with the banks and the emotions these experiences generated in order to calculate their impact on the customers' behavior. How It Works:- EMO Index is an aggregate or individual indicator which determines the general feelings of each customer or stakeholder or group of customers towards a product, service or company. It is a combination of the Net Intensity Balance (intensity with which they are felt)and Net Emotional State (balance of emotions felt) and, therefore, have measuring values from -100% to +100%. Since it is calculated at an individual level, so it can also classify customers into seven broad, basic emotional states which are called EMO Clusters: • Fans.. (+100 to +80) • Believers.. (+80 to +55) • Followers.. (+55 to +30) • Stand By.. (+30 to +15) • Lost Souls.. (+15 to -5) • Burned Out.. (-5 to -30) • Opponents.. (-100 to -30) Customers with Opponents till Standby states are not in favor of your Product/Service/Company. While followers should be converted into Believers and believers into Fans by taking appropriate actions.

-
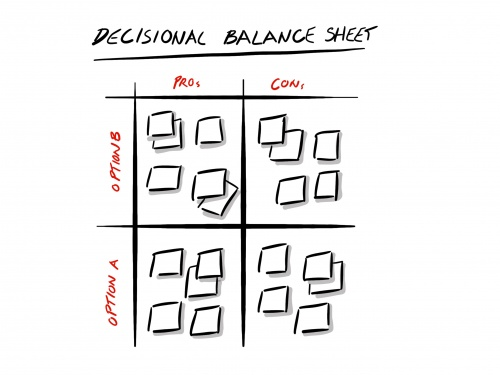
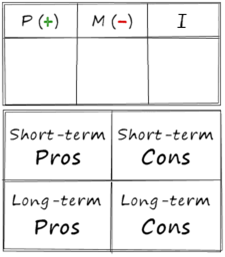
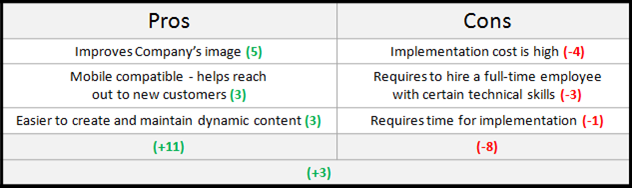
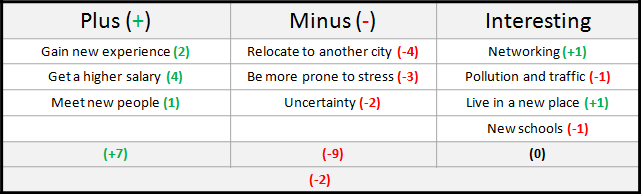
Decision Balance Sheet:- Benjamin Franklin was the first person who introduce decision balance Sheet. Franklin described this process to Joseph Priestley In a 1772 letter ,which is now often called the Ben Franklin method. Sometimes when we are faced with an important decision, we spend a lot of time looking for a solution hoping to avoid making the wrong choice. One of the popular tool to decide what to do is using the Decision Balance Sheet. This method enables the team to make more confident and balanced decisions. A table is used to record and represents the advantages and disadvantages of an idea or situation for the purpose of reaching to a decision quickly. This situation might be a problem that needs to be solved or a condition that needs to be changed or evaluation of solutions/ideas proposed for implementation. A decision balance sheet is basically a table of two columns labeled as Pros and Cons. This table is used to capture all the pros and cons for the proposed/suggested idea or situation. A scoring system can be used by giving numerical weights to the different pros and cons which will help to take decision easily. The result will help team to decide whether to go ahead with the decision or not. PMI is one of the version of this tool, which stands for Plus, Minus and Interesting. one Interesting column is also used when the elements of the proposed solution/idea are not particularly of positive or negative effect. It can also be used to record what team consider interesting and the future implications of the idea. Decision balance sheet can be used in a four-cell matrix consisting of the pros and cons in the short and long term. This is very useful when the decision is of strategic nature. Method to Use the Decision Balance Sheet:- Below steps explain the use of decision balance sheet: Clearly write down the solution / idea/decision at the top of a flip chart or whiteboard. Make a table of two columns, Name/Heading one “Pros” and the other “Cons”. Write Down all possible benefits in the pros column and all possible negative effects in the cons column. Assign numerical weights to the pros and cons by giving a score from one to five. Be objective while scoring. Sum the scores in each column then subtract the total cons from the total pros. Use the overall score to decide whether to go ahead with the decision or not. Team needs to identify other factors that they may have missed. Use your common sense when team suspect that the reached result is not appropriate. Example: As an example, let’s say that one cross functional team wants to decide whether to go for a new website for the organization or keep the existing one. The final score suggests that team should go for a new website. Another Example:- Decision balance sheet may also be used in personal decision-making. let's take one example of a personal decision balance sheet where the challenge is to decide whether to accept a new job offer in another city. Let's take one more Example of decisional balance sheet for someone experiencing alcohol problems Plusses Minuses Continue drinking as I am It's what my friends do It makes me less anxious It's fun being drunk I like the taste I get into fights Health problems Divorce threat Debts I can't remember things the next day Cut down I can still meet my friends It will help my health Will my partner believe me? Can I stick to it? Stop drinking I won't get into fights any more It will please my partner It will save money Good for my health I might have to avoid my friends How will I cope with anxiety? What will I do for fun? Any evaluation may change and often the cells are inter-connected. For example, looking at the table above, if something were to happen in the individual's marital life (an argument or the partner leaves or becomes pregnant or has an accident), the event can either increase or decrease how much weight the person gives to the elements in the balance sheet that refer to the relationship.

-
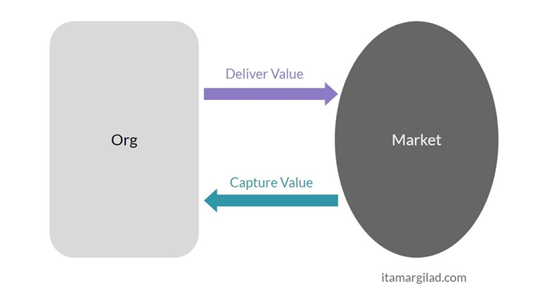
What is a North Star Metric? A True North Star metric is one of the measurement that’s tells about company’s long-term success. A good "North Star," metric include three things: revenue growth, customer value and measure the progress. If a metric include those three points, and each department contributes to improving it, the company is on the right path. Why is a North Star metric important? Main aim for defining true North Metric is to align teams around the singular goal of growth. The name North Star metric taken from the common name for Polaris, the star that lies directly above the Earth’s Northern pole. Companies can have multiple North Stars, and any given North Star metric is composed of sub-metrics anyway. Companies should review their North Star metrics at an suitable intervals to make sure they still point the right direction, and align them when they feel appropriate. How a North Star metric works? For better monitoring a North Star metric is divided into smaller metrics that drive accountability and ownership at the functional/team level. It is for batter alignment between individual and departmental metric. For example e commerce company with the North Star metric “the number of new customers purchasing each week.” A sales employee at that company could contribute to that main goal by improving sales in his/her category. How to find your North Star metric? To find relevant North Star metric, companies must focus what is truly important to their business. Companies are succeed and fail for lots of reasons, But pillars to the business that are load-bearing should be identified? If they failed, would destroy the company? A metric like revenue without satisfying customers will fail in the long run, as will a company that satisfies customers without being profitable. There is no use of such metric that doesn’t measure progress in a way that allows teams to act on its insights and change their behaviors isn’t useful. A North Star metric must reflect all three factors, considering business nature. To find your North Star metric: 1. Ask, what is essential to the business’ functioning? Prioritize a list. 2. Ask, which KPIs and metrics measure the top few, key factors? 3. Ask, which metric captures all of the above? 4. Build a metric hierarchy, with the North Star metric at company level target How 'North Star Metric' can help generate long term value for customers? Main force behind the North Star Metric is that if your company provides more value to your customers, then the growth of your company has to go positive. The logic is that if your customers receive a lot of value, they will stay longer, buy more and refer more friends to your company. Company will focus more on customer to deliver value, In turn will have more finetuned relations with customers. Company will have KPI which are impacting customers directly for Eg. Order delivery time, Customer satisfaction index , Customer surveys, Product and Service feedback and communication back to customers after improvements. All these healthy activities will improve customer experience. Customers will have long term relation ship with suppliers. The main mission of every org is to deliver value, ideally to a big market, and to capture value back. The more value organization deliver to their customers, the more they will able to collect back. The more value you capture the more revenue you generate, data and other resources you have to invest in delivering yet more value to the market. To build a healthy value loops around your product you have to define what value you deliver and what value you want to capture. Then you have to measure both.
-
Product portfolio Matrix is a strategic tool to analyze business with Growth potential and Market reach. It has four quadrants:- Dog, Question Mark, Stars and Cash cow. Let's have a look on them. Dog products: Dog products are with low Market share and Low cash generation so ideally they are eating the resources but return is less. Low ROI Question Mark: These are the products which are having low market share but high growth opportunity. They may be converted into stars depending upon the investments and focus Stars: These are the products which generates high ROI . These products are having high Market share as well as high Growth Potential. Cash Cow: These products are in low growth category but high market share. These are making cash for the company. Ideally Dogs should be removed from portfolio and Cash cow needs Low focus. Lean projects i.e. DMAIC or DMADV should be taken for stars and Question mark.
-
Standardized work is one of the popular tools being used by lean professionals. In this tool current practice is being documented, which acts as the as is status and can be compared after kaizens or any improvements. after improvement new process will became base line and going on. Basically, standardized work consists of three elements: Takt time, which is the rate at which products must be made in a process to meet customer demand. The exact work sequence in which operator completes tasks within takt time. The WIP inventory, including units in machines, required to keep the process operating smoothly Let's take an example.. There is a part called A, Customer required 800 Parts per day, there are 400 min/day available for production. TAKT;- 800/400= 2 Parts/Min. Sequence of Assembly:- lets assume there are four steps which needs to complete in defined sequence. Step 1;- Bearing loading and heating Step 2:- Bearing unloading and fitting on shaft Step 3:- Seal Fitment on shaft After these three steps product A is complete. WIP:- We have defined inventory between these three steps to avoid line stoppage.. Inventory of Bearings for Heating;- 3 Bearing and shaft fitted assembly:- 3 Sea fitted Shafts:-0-1
-
Defect free production should be the primary focus of any company as it reduces product cost avoid company resources to fix them later. Once defected parts moved out of factory/Facility there will be lot of resources including money needs to spent to correct it. More cost will be spent to fix as it passes more stages of production. If the customer will get right product first time than there will be long term customer relation and will improve customer base.
-
Uncontrollable factors that induce variation under normal operating conditions are referred to as "Noise Factors". These factors, such as multiple machines, multiple shifts, raw materials, humidity, etc., can be built into the experiment so that their variation doesn't get lumped into the unexplained, or experiment error. A key strength of Designed Experiments is the ability to determine factors and settings that minimize the effects of the uncontrollable factors. Effects of Noise factors can be overcome by using Few techniques like Blocking and/or Randomizations in the experiments.