

Dipankar Acharya
Members
-
Joined
-
Last visited
-
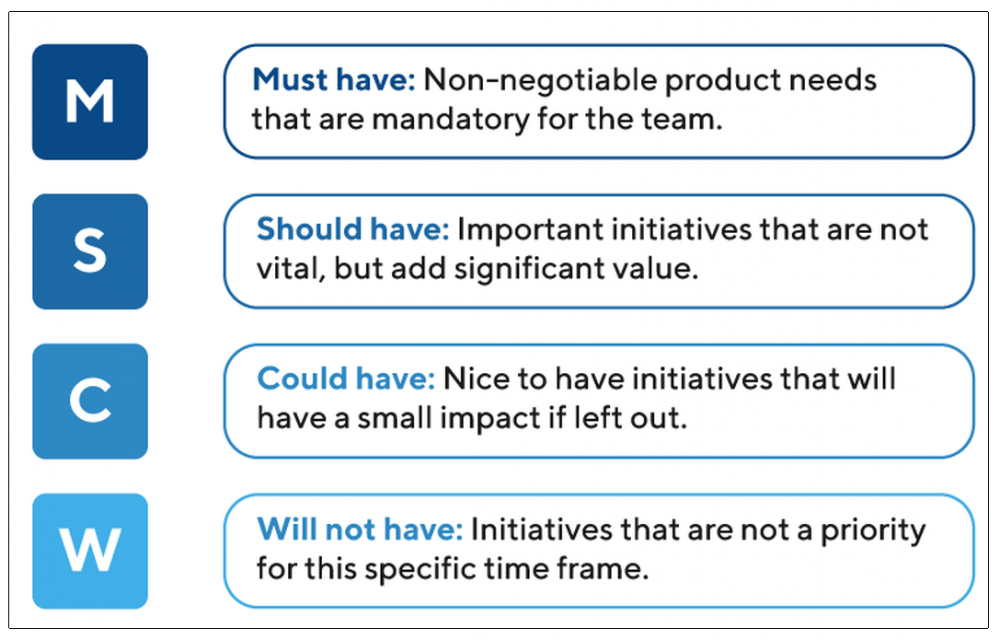
Dipankar Acharya replied to Vishwadeep Khatri's topic in We ask and you answer! The best answer wins!The MoSCoW method is an approach for prioritizing requirements of project. It allows people in a project to know what work needs to be completed first and how will it help increase revenue, decrease operational costs, improve productivity or boost customer satisfaction. Also, prioritizing requirements enables project teams to understand the effort and resource requirements MoSCoW method categories : MoSCoW stands for Must have, Should have, Could have and Will not have Must have : All the requirements that are necessary for the successful completion of the project. Non-negotiable and providing minimum usable subset of requirements. Should have : One level below Must have, these elements are important to project completion, but they are not necessary. If these requirements are not included in the final product, then the product will still function...however if these are included, then they will greatly increase the value of the product. Could have : Requirements that have a much smaller impact when left out of the project. These are relatively unimportant desrable factors and are often the first ones to be deprioritized Will not have : Final category of requirements that are not a priority for the project's timeframe. This helps strengthen the focus on requirements in the other three, and also sets realistic expectations for what will not be included in a final product. Also, this category is beneficial in preventing scope creep Pre-requisites Before implementing this, businesses must ensure that teams agree on the project objectives and the factors that will be used for prioritization. How to settle disagreements should also be established. Then, teams should finalize on what percentage of resources will be assigned to each category. Advantages of the MoSCoW method It is easy to use and understand. It helps in prioritization It can be used for dispute resolution among stakeholders This can ensure that a minimum viable product (MVP) is produced. It can be used to set priorities at different levels of the development pipeline. In addition, it enables users to assign specific percentages of resources to each of the four categories. Criticism for the MoSCoW method There is no clarity regarding the will-not-have requirements and whether they are left out of the release or the entire project. We cannot prioritize requirements within the same category. There's no logic and emprical reasoning for why one requirement is a must-have and the other is a should-have. If the decision-making process is biased, the prioritization may become subjective and inefficient
-
Dipankar Acharya replied to Vishwadeep Khatri's topic in We ask and you answer! The best answer wins!In 1989-90, Jack Welch, the CEO of GE realised that thet were entering an era of constant change, and adaption to change was critical to survival So, he formed a team of consultants to study the best practices in change management and form a methodology for GE. Thus they formed the Change Acceleration Process, referred to within GE simply as “CAP" which drives change in GE. For this, the team studied many projects and business initiatives., and gathered that in most cases Projects fail due to attention to cultural factors, and not technical strategy. Thus, the team created the Change Effectiveness Equation, QxA=E. This means that Effectiveness (E) of any initiative = Quality (Q) of the technical strategy * Acceptance (A) of that strategy. Therefore, the people aspects are equally important to change management as technical aspects How can a Project Manager develop this process and use this equation : Leading Change : Drive a committed and authentic leadership throughout the duration of the initiative Creating A Shared Need : Develop a compellinneed which breaks the inertia in all stakeholders Shaping a Vision : Articulate a clear vision of the To-be state which is widely understood. He must descrie the end state in measurable terms Mobilizing Commitment : Execute an influence strategy to build momentum. Leverage "early adopters,” to wear down resistance Making change last : Leverage early wins, transfer learning’s and replicate Monitoring process : Track progress of change initiativeand celebrate wins Changing Systems and Structures : Identify how existing business systems (the way work gets done in the organization) influences the behavior you are trying to change, and modify them appropriately.
-
Dipankar Acharya replied to Vishwadeep Khatri's topic in We ask and you answer! The best answer wins!Cost-benefit analysis refers to comparing the projected benefits versus the costs connected with a project/initiative decision to determine whether it makes sense from a business perspective. If the projected benefits outweigh the costs, then it could be ascertained that the decision is a good one to make. However, if the costs outweigh the benefits, the company may want to rethink the decision or project. Process : the following process is generally used in CBA : 1. Establish a Framework for Your Analysis : Identification of goals and objectives we are trying to address and the metric we shall be using to measure and compare the benefits and costs. 2. Identify Your Costs and Benefits : Compiling a comprehensive list of all the costs and benefits associated with the project or decision. The costs may include : Direct costs like labour, manufacturing expenses, inventory, raw materials etc Indirect costs like electricity, overhead costs, rent etc. Intangible costs like effect on customers, employees, delivery times or goodwill. Opportunity costs Cost of potential risks such as regulatory and environmental impacts. Benefits may include : Tangible benefits like Revenue and sales increases Intangible benefits like improved employee and customer satisfaction, safety. Market share gained (competitive advantage) 3. Assign a Dollar Amount or Value to Each Cost and Benefit : Easy for Direct costs/benefits...but more challenging for Intangible costs and benefits 4. Tally the Total Value of Benefits and Costs and take the decision Exceptions / Limitations of Cost-Benefit Analysis For projects which are very large and/or have a long-term time horizon, a cost-benefit analysis might not work as it is unable to consider financial concerns such as changing Cash Flows, Inflation and the present value of money. Other capital budgeting analysis methods, including net present value (NPV) and IRR, could be mores suitable. Present Value models state that an amount of money or cash in the present day is worth more than receiving the amount in the future since today's money could be invested and earn income.
-
Dipankar Acharya replied to Vishwadeep Khatri's topic in We ask and you answer! The best answer wins!Traditional Customer Satisfaction systems measure Satisfaction on a scale of 1 to 10 wherein Rating of 9 to 10 are deemed as Promoters and 1 to 6 are Detractors. Score of Promoters - Detractors is considered as Net Promoter Score. It has been found in some sectors that NPS Score is not entirely aligned with what customers feel or say they will do. Also it it does not seem to match the emotional state Thus EMO Insights International has come up with an EMO Index in 2012 based on their study of the Spanish Banking Market. They interviewed 1900+ retail banking customers of both genders and used neuroscience tools to understand emotions felt by these customers in their past experiences with banks Based on that, they arrived at the EMO Index which is a combination of the Net Emotional State (emotions felt) and the Net Intensity Balance (intensity of emotions), which take on values from -100% to +100% It classifies customers into seven broad, emotional states (called EMO Clusters) : Fans (+100 to +80) Believers (+80 to +55) Followers (+55 to +30) Stand By (+30 to +15) Lost Souls (+15 to -5) Burned Out (-5 to -30) Opponents (-100 to -30) The company argues that this index is more reliable indicator than NPS. A second wave of emotions study was done a year later to validate the methodology.
-
Dipankar Acharya replied to Vishwadeep Khatri's topic in We ask and you answer! The best answer wins!The North Star Metric has come from Silicon Valley companies and focusses towards generating long-term retained customer growth. It is the single metric that best captures the core value that an organization's product or service delivers to customers. The criteria for a metric to be North Star are : a) It must lead to revenue b) It must reflect customer value c) And it must measure progress Examples of North Star Metrics from familiar companies: Airbnb: Nights Booked Facebook: Daily Active Users Quora: Number of questions a user answers WhatsApp: Number of messages a user sends Correctly identifying the North Star Metric requires the organization to understand what exact value customers get from your product and how they get it. To do this, one must examine how loyal customers engage with and use the product/service. There may be more than one metric that works, but organization has to boil it down to a single NSM How does it help generate long term value for customers : It helps to have single focus of the organization by coordinating siloed teams to work together by providing a single metric that focuses them around a common goal. It gives the organization clarity and alignment on what the product team needs to be targetting for and what can be traded off. It communicates the organizations’ impact and progress to the rest of the company – resulting in more support and faster implementation of strategic product initiatives. It makes the company more concerned with adding value for the customer, leading to customer loyalty and retention And most importantly, it holds the organization accountable to an outcome.
-
Dipankar Acharya replied to Vishwadeep Khatri's topic in We ask and you answer! The best answer wins!Standardized work in LEAN is the description of the work being performed, its steps and sequences. It basically means defining who does the task, when they do it, and how they do it. It provides a method to document the process information in a written format and used for training new comers and workers on the job to do their work more efficiently It requires three elements: Takt time : It is the Rate at which products must be produced in order to meet customer demand. It is equal to Available production time / Customer Demand (units) Work Sequence : The steps and in order by which employees do the task. Standard inventory (or in-process stock) : Minimum quantity of parts and raw materials needed to run operations Standardized work helps organizations by : a) Reducing variation in output b) Helping employees to structure their work c) Minimises accidents and injuries d) Gives a standard basis for Continuous improvement Example of a Standardized Work : Work : Taking a Hotel Check-In I) Activities : 1) Receive and Greet the Guest using appropriate messages : 5 seconds 2) Ask for Booking Information (Letter, Message etc) : 10 seconds 3) Check Booking in Opera (Hotel Management) System : 15 seconds 4) If Booking exists : 4a) Take Identity Proof and do a Check-In : 1 min 5) If Booking does not exist : 5a) Check for available rooms : 15 seconds 5b) If room available, then do a Check-In as Walk-In : 2 mins 5c) If room not available, politely refer the guest to other Hotels in close proximity : 5 seconds 6) Give keys to Guest Relations for Rooming : 10 seconds II) Total Time : 3 mins III) Inventory : Reservation Cards, Rooms Keys IV) Process Document : Flow Chart, SOP, Brand Service Standards
-
Dipankar Acharya replied to Vishwadeep Khatri's topic in We ask and you answer! The best answer wins!The service recovery paradox is a situation where a customer likes an experience of an efficient and empathetic correction of a problem (Service Recovery), compared to how he or she would like the company if the product was defect free in the first case. It happens mostly in Customer Facing Service Industries (like Hospitality, Retail, Banks etc). This may give an impression that a company should change the focus on better after sales service than a defect free production. However this is not a full picture, because fundamentally, if the product is not Defect free, it leads to more efforts on the part of a Customer. Taking a personal experience, I order a lot from online (especially more so during this current lock-down period). Sometimes the items are poor or unsuitable, then I have to go back to the website and file for return, repack the item and handover to courier person when he comes for pickup. Post that I need to keep tracking that my money has been refunded....and then again go through the steps of ordering. So these are extra efforts and time wasted, and no amount of service recovery is going to alleviate these factors. Also, if a company keeps doing this, then however good they are at fixing defects, over time customers will realize that its products are not trustworthy at all and shun it. Further, if the issue is serious (e.g incorrect medicine given to patient in a hospital, technical glitch leading to missing a flight), then no amount of Service Recovery is going to pacify the person. Thus, I believe that while sometimes and in some cases, organization may get away with smart and efficient service recovery, these benefits are only TRANSIENT. In the long run, to ensure customer satisfaction and loyalty, all companies have to focus on Defect Free Production only. There is no alternative to : FIRST TIME RIGHT, EVERY TIME RIGHT !!
-
Dipankar Acharya replied to Vishwadeep Khatri's topic in We ask and you answer! The best answer wins!In Design of Experiments, we vary multiple Inputs (X's) at a time, in order to find the best combination of inputs to deliver the desired output (Y's). During the same, we may come across some parameters which are uncontrollable. These are called Noise factors. E.g. for an experiment on making the the right Dish, we can vary and control the quantities of constituents, temperature of cooking, time of cooking etc. But we cannot control factors like the mood of the Chef, the skills by which he mixes the dish etc. Mostly these human factors become noise and can affect the DOE results. Noise factors are of 2 types : Known and Unknown To address the same we can use 2 methods : a) Known Noise Factors : Use Blocking (A block is a group of homogenous experimental observations). b) Unknown Noise Factors : Use Randomization (make the Run order separate from Standard Order)
-
Dipankar Acharya replied to Vishwadeep Khatri's topic in We ask and you answer! The best answer wins!In Project management, after identification of activities, we analyze them if any relationships exist between those. If relationships exist, it is better to highlight them in Project Schedule Network Diagrams to maintain the project schedule better. There are four (4) types of dependency relationships. Taking an example of building a house on a piece of land : 1) Finish to Start : Predecessor must finish before Successor can start. (Example : Land must be purchased before house building can start) 2) Start to Start : Predecessor must start before Successor can start. (Example : Land digging must start before House foundation can be laid) 3) Finish to Finish : Predecessor must finish before Successor can finish. (Example : Laying Cement must be complete before final Painting can be completed) 4) Start to Finish : Predecessor must start before Successor can finish. (Example : Whitewashing must start before final painting can be completed)
-
Dipankar Acharya replied to Vishwadeep Khatri's topic in We ask and you answer! The best answer wins!The correlation coefficient merely shows the relationship (positive or negative) between two variables - and the extent of the same - via the value of the coefficient (-1 to +1). It does not express the relationships between the 2 variables or can't predict the value of the dependent value based on the changing value of the independent one. The Regression analysis expresses the same via an equation, analysis of R square (how much of the variation of the output is explained by the equation) and also can predict the "Y" based on changing values of the "X's". Further MLR or Logistic Regression can predict relationships between Multiple factors as well as multiple types of (Discreet and Continuous) variables. Thus Correlation coefficient does not give the complete picture and we need to do Regression as well.
