

Suresh Sekar
Members
-
Joined
-
Last visited
-
Suresh Sekar changed their profile photo
-
Decision Balance Sheet. It is a simple but constructive decision-making method that allow the team to make more confident and objective decisions. It uses a tabular track record to represents the advantages and disadvantages of a plan or situation for the reason of reaching to a conclusion quickly. This situation might be an issue that needs to be solved or a state that needs to be changed. The decision balance sheet helps determine whether to go for or against a stated problem or a proposed change, refine the understanding of the idea or state, helps avoid decision-making paralysis and pace up the decision-making process. It is extremely useful in a team working surroundings when you need to motivate team members to consider multiple view to reach a consensus. However, when you must collate different options or explore few options in more details, other decision-making techniques may be more appropriate. A decision balance sheet is directly a table of two columns mark as Pros and Cons. This table is used to document all the pros and cons for the given design or situation. You can use a scoring system by providing numerical weights to the different pros and cons. The result will help you to conclude whether to go ahead with the decision or not. How to Use the Decision Balance Sheet: The following steps narrate how to use the decision balance sheet: With your team, distinctly write the situation or design at the top of a flip chart or whiteboard. Draw a table of 2 columns, one “Pros” and the other “Cons”. Record all feasible benefits in the pros column and all feasible negative effects in the cons column. Give numerical weights to the pros and cons by allocate a score from one to five. Be unbiased while scoring. Add the scores in each column and then subtract the total from the total pros. Examine the overall score to determine whether to go ahead with the decision or not. Take time to pinpoint other factors that you may have missed. Recollect to use your common sense when you feel that the reached result is not appropriate. Below is the sample Decisional Balance worksheet for Joining a "weight loss group"

-
North Star Metric: A North Star Metric is necessary if you want to reach the maximum growth potential. To grow long term, the company will need to evolve a long-term growth strategy. Identifying the North Star Metric can be the difference between fetching a great company or one that is on its way out. Pinpoint it also helps to understand the customers and product better. A North Star Metric helps the company in several ways: Focus: Entire company should have the same focus. At the team level, still focus on a different number, but finally everyone has the same goal. Clarity: Everyone can look briefly how well the organization is doing. Customer focus: The organization is more concerned with adding value to the customer than dispossess value, so it automatically makes space to be busy with retention. The result will be that the business will grow much more systematic because it has more focus and that focus is also attentive on long-term growth. Few Checklist for a good North Star Metric A good North Star Metric meets these below criteria, otherwise it can go wrong quickly: Client’s ‘success’ moments - If you do it correct; your North Star Metric is close to the minute the customer gets its deliberate result from your product/service/software. Expresses value to the customer - A good North Star Metric guarantees that you also every time keep an eye on all your divergent metrics, such as retention and referral, and not just on your marketing KPIs. Metric is measurable - so ‘contentment or ‘degree of unburdening’ is not measurable, then what can be measured, for example, the number of times a definite action is carried out, the number of times a definite part is visible or the time you have rescue people. Metric is time-bound - You measure a good NSM based on a unquestionable period, such as hour, day, week or month. You want to perceive clearly that you increase in size over time Metric is within your control - Your NSM should be a number that is not really being determined by other external factors other than your customers, because it must only give back the bond between you and your customers. Direct reflection of your growth - However, you look at it, if your NSM grows, which means that your business grows as well. It should therefore not be a conceit metric or false figure. Mutual effect on the entire pirate funnel - A good NSM is a number that everyone in your company can control, no matter what stage of the Pirate Funnel they are working on. All must feel involved in this growth goal. On the other side, growth of the NSM should also have an effect on the separate components in order to be a good NSM. Growing with some frequency - to get immediate feedback. If your NSM consists of a promotion that each customer only executes once a year, it will take excessively long before you know whether you are on the correct track. Preferably, your NSM grows every day or week, so it should be an action that every customer should perform about four times a month
-
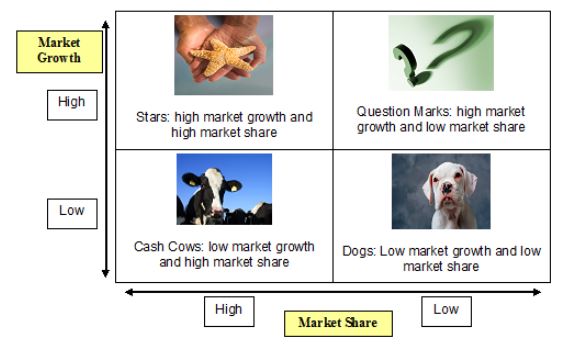
Product Portfolio Matrix: Product portfolio matrix is planned to help with long-term strategic planning, to assist a business consider growth opportunities by evaluating its portfolio of products to conclude where to invest, to discontinue or develop products. It is divided into four quadrants based on an analysis of merchandise growth and relative market share. 1. Dogs 2. Question marks 3. Stars 4. Cash cows 1. Dogs: These are outcome with low growth or market share. The normal marketing advice is to eliminate any dogs from your outcome portfolio as they are a demand on resources. Dogs are those product thread with low market share in markets with small to no growth potential. They are excessive cost product lines that are often seen as unload the company’s resources. 2. Question marks: Products in excessive growth markets with low market share. These products often require remarkable investment to drive them into the star quadrant. The challenge is that lot of investment may be needed to get a return. Question marks are products with low market share sold into high growth markets. While there is a potential for these product lines to enlarge, the company should invest heavily to increase brand awareness. While the company may have a rigid product offering, it should ultimately decide whether to continue to go after the market, or let the product offering die 3. Stars: Products is in high growth markets with high market share. It Can be the market leader though essential ongoing investment to support. They bring about more ROI than other product categories. When thinking of “stars” imagine of those product lines whose market share is high in a high growth market. These stars need a consistent rush of capital to continue their momentum. A star can be observing the company’s “flagship” product line. If it maintains its high market share, then it will no prolonged require as much capital and will eventually become a “cash cow”. 4. Cash cows: Product is in low growth markets with high market share. The simple rule here is to ‘Milk these outcome as much as feasible without killing the cow! frequently mature, well-established products. When thinking of cash cows, imagine of those product lines have high market shares but are in a market with small to no growth. These are often mentioned to the company’s mature product lines and ones that need minimal investment of capital.
-
Standardized work: It is one of the principles of lean manufacturing and is a mean of stablishing accurate procedures to make products in the secure, easiest, and most powerful way based on current technologies. Three elements of Standardized work are 1. Takt time, 2. Work Sequence 3. Standard Inventory. 1. Takt time: Rate at which parts or products need to complete in order to meet customer demand. Example: If we receive a new product order every 5 hours, we need to finish a product in 5 hours or less to meet customer demand. Takt time = Total Time Available for Production / Customer's Daily Demand 2. Work Sequence: The steps operators need to execute within Takt time, in the sequence in which they must be completed Example: Eat Dinner task cannot start until Cooking is complete 3. Standard Inventory: Minimum quantity of parts and raw materials needed to run operations. Example: The minimum level of inventory is a kind of a safety level of inventory which shows that the delivery of raw materials or stock may take more than the normal lead time. Lead time is expected time extract by the supplier to deliver goods
-
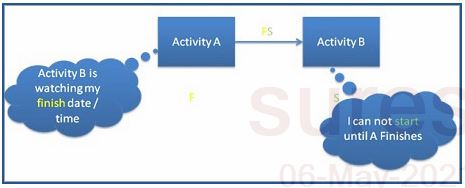
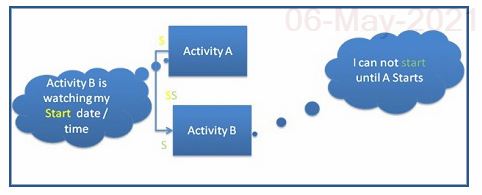
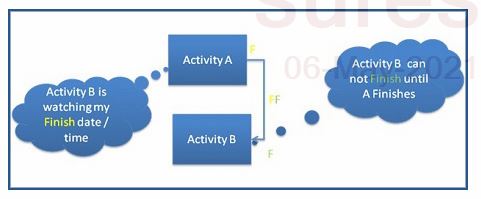
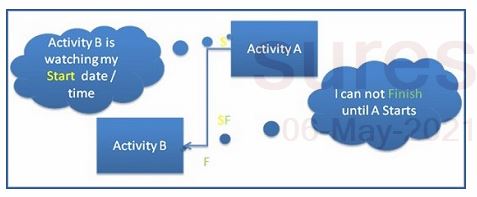
4 Types of logical relationships: 1. Finish to Start 2. Start to Start 3. Finish to Finish 4. Start to Finish Finish to Start: A logical connection in which a next-in-line cannot start until a forerunner activity has finished. This relation constraint doesn’t impact the independent activity. It affects only the dependent, so in the below case, it is activity B. The first character ‘F’ shows the finish state of activity A, at this state, activity B can started. The second character ‘S’ is the rule on the next step to make it dependent on the Finish state of the successor activity. Example: You cannot start next stage until you finish the design. In this case, development is the dependent activity on the design activity. Start to Start: A logical relationship in which a next-in-line activity cannot start until a forerunner activity has started. So if activity B is leap to this relation, which means it cannot start till the forerunner (independent) activity A is started. The forerunner activity B start is dependent on the start state of next-in-line activity A. The start of activity A operate the start of activity B. Example: The activity of marketing booklet preparation cannot start until user manual documentation has begun. In this way, after the opening of activity A, both A and B will can go in parallel. Finish to Finish: A logical relationship in which a next-in-line activity cannot finish until a forerunner activity has finished.” So if activity B is leap with this relation, which means it cannot finish till the forerunner (independent) activity A is finished. So, B needs to finish the deliverable and parallelly keep working with A till the time A is not completed. Example: Like, the telecast of a cricket match cannot finish until the match is finished. So the match is not depended in telecast, but the telecast is. If the match will take longer than the initially planned time the telecast will also continue till that time.. Start to Finish: “A logical connection in which a next-in-line activity cannot finish until a forerunner activity has started.” So if activity B is leap to this relation, which it cannot finish till the independent activity A starts. It looks bit confusing because in some cases, forerunner activity gets performed before the next-in-line activity. But, in this case, the next-in-line is happening first. But even if the next-in-line is happening first, the forerunner is not at all restricted by next-in-line activity.
-
Neural Network: Neural network from the base of deep learning and the sub-field of machine learning, where the algorithm is inspired by the structure of the human brain. Neural Network taken data trained themselves to recognize the pattern in the data and then predict the output for new set of similar data. The structure of Neural Network is known as a multilayered perceptron, that is, a network of many neurons. In each layer, all the artificial neuron has its own weighted inputs, transfer function, and output. Once the Neural Network is trained and tested with the right weights decided, it can be given to predict the output. It gives high value during the decision making.
-
Practical significance: Practical significance relates to whether the result from a statistical hypothesis test is useful or not. Hypothesis testing tests for statistical significance. It means the effect observed in the sample was unlikely to occurred due to chance alone. In other words, it would be very unlikely to see what was observed in the sample if the null hypothesis is true. Example: If a Call Centre claims their average wait time is 30 seconds. We decide to test: Ho: mean=30 Ha: mean>30 We find X (sample mean) = 30.6, and a p-value of 0.002 We decided to test that the population mean is 30 and the alternate hypothesis is greater than 30. We find a sample mean of 30.6 sec and get the resulting p-value is 0.002. p-value size shows very strong evidence against the null hypothesis, in this case population mean is greater than 30sec, but in the sample we observed in the sample mean is 30.6, a difference of only .6 sec from the null hypothesis. In this situation most people would feel the difference of 0.6 sec doesn’t really have any practical meaning. But perhaps the company feel differently, the company want to make sure the wait time is no more than 30sec on average and so they feel 0.6 difference is important, we simply don’t know. We can’t say in statistics that this p-value is very small, giving strong evidence against the null hypothesis. We leave up to others to decide that is practical importance. How could be such a strong evidence against the null hypothesis if the difference from the hypothesized is so small. Statistical significance is strongly related to sample size. If the sample size is large enough, even tiny differences from the hypothesized value will be found statistically significant. If the sample size is small, then it can be difficult to find the statistically significant difference. In statistics we determine if there is Statistical significance and let experts in the field of interest determine whether the results have any practical importance. In addition to the results of hypothesis test, it is best to also report an appropriate confidence interval. The interval illustrates the size of the effect and can help to determine if the effect has any practical significance.
-
VRIO: The VRIO framework is an analytical tool designed to help the organizations to uncover and protect their workforce and capabilities that gives a long-term competitive advantage. V – Value R – Rarity I - Inimitability O - Organizations Value: First and fore-most resources have to be valuable, as a matter of fact in order for firm attributes to be labelled to determine resources they must be valuable in the first place, so technically the resources are always valuable to be consider resources. when they enable the firm to implement strategies that improve firm’s efficiency and effectiveness by exploring opportunities or by mitigating threats that will increase in revenue or decrease in cost. Its even possible to quantifying this with the Net present value. For example: If you come across a more efficient production machine for your product, to purchase a machine you have to invest of 1M dollars, however machine can save up to 200k every year, during the life time of 10 yrs, the NPV will help to calculate the value of the investment by this counting the value of the future cost savings of 200k, back to the present time using the discount rate. In this example if you see the discount rate of 5% to future cashflow are worth about 1.5M today which makes the NPV about 0.5M has to adjusting the initial investment of 1M dollar, any investment wouldn’t NPV outcome there is higher than 0 is supposed to add value to the firm and therefore can be consider a valuable resource. Rarity: Are the resources you are using rare? resources that can only be acquire by one or few companies are consider to be rare. if a certain valuable resource is possessed by a large amount of players in the industry, each of the players has the ability to explore the resources in the same way, thereby implementing a common strategy that gives none of the players a comparative advantage. Going back to our previous example, more efficient product machine. If all the compactors are using the same machine, you can gain the same advantage, but nobody can gain the comparative advantage. Rareness is therefore important. Inimitability: Valuable and Rare resources may help companies to engage in strategy that auto firms cannot pursue, since auto firms are elect relevant resources and it is no guarantee for long term comparative advantage. It may give the company first mover advantage but comparators will probably try to imitate the resources to duplication or substitution, for example they might try to build their own most efficiency production machine or look to purchase somewhat similar product machine from a different supplier and another quality, the resources should therefore have is that they are hard and costly to imitate or substitute, this quality is the combination of inimitability and Non-substitutability. While there are many reasons why resources are can be hard and costly to imitate. Organization: Even if a company possess a resources did a valuable, rare and inimitability it will not automatically lead to a straight comparative advantage, to fully realize this potential the company must also be organized to explode his resources in such a way the true value is being captured from the resources. For example, if you have highly skilled workforce, that is more valuable, rare, and hard to inimitable but not the appropriate division of labor and fair compensation policy this workers might not work to their full potential and true value is not being captured. Organizational factors such as formal reporting structure, compensation policies and management control systems surrounding the resources are therefore crucial as well
-
ICUKU [Impact, Controllable, Known, Unknown, Uncontrollable]. We cannot solve all the issues, so it is important to prioritize our issues before launching into solving problems. ICUKU has basically a nine block matrix, and its broken into 3 major categories which is Impact, controllable and uncontrollable. Impact has three separate components High, Medium and Low. We need to categorize the impact based on the priority. Controllable has two components Known and unknown. If it’s not known to be a controllable then it should be marked under unknown category, if its known one then we can mark it in the known category. Which variable we go first after for the vital few x’s? First we go with High, Medium and Known, then we go with unknown. We do not start with Un-controllable because it should not be a right scope. The objective of ICUKU is to go after the things that we can know how to control the High or Medium impact. Key objective of ICUKU: · It helps to identify the vital few x’s · Focus on what is important · It helps avoid chasing/solving x’s that are not going to improve (reduce) your defect rate · It helps to identify the controllable and uncontrollable variables


