

subodh tripathi
Members
-
Joined
-
Last visited
-
subodh tripathi replied to Vishwadeep Khatri's topic in We ask and you answer! The best answer wins!Definition: A digital twin is a representation of a physical entity, operation, or service in digital form. A digital twin is a digital image of a physical entity, such as a jet engine or wind turbines, or even larger objects, such as houses or entire cities. The digital twin technology can be used to simulate processes in order to gather data and anticipate how they will work, in addition to physical properties. A digital twin is a computer programme that generates simulations based on real-world data to predict how a product or process would work. These virtual models have become a staple of modern engineering to drive innovation and boost performance, thanks to advances in machine learning and factors such as big data. In short, getting one will help develop strategic technology patterns, avoid costly failures in physical artefacts, and evaluate processes and services using advanced analytical, tracking, and predictive capabilities. How does it work? The creation of a mathematical model that simulates the original starts with experts in applied mathematics or data science studying the physics and operational data of a physical object or device. The developers of digital twins make certain that the virtual computer model will obtain input from sensors that collect data from the real-world version. This allows the digital version to replicate and simulate what is happening with the original version in real time, allowing for the collection of data on results and possible issues. A digital twin can be as complicated or as straightforward as you need it to be, with the amount of data used deciding how closely the model mimics the physical version in the real world. The twin can be used in combination with a prototype to provide input on the product while it is being created, or it can be used as a prototype in and of itself to simulate what could happen when the physical version is built. How to Design Digital Twins? As previously described, digital twins may be used for a number of purposes, including testing a prototype or design, evaluating and tracking lifecycles, and assessing how a product or process can perform under various conditions. Data is gathered and computational models are developed to test the digital twin architecture. This may involve a connection between the digital model and a physical model. This may include a real-time interface between the digital model and a physical object for sending and receiving input and data. 1. Data: In order to construct a virtual model that can represent the actions or states of a real-world item or system, a digital twin requires data about the entity or operation. This information may be relevant to a product's lifecycle and include design requirements, manufacturing processes, or engineering details. It may also provide information about the manufacturing process, such as machinery, products, and parts. It may also provide information about the manufacturing process, such as machinery, products, components, procedures, and quality control. Real-time input, historical review, and maintenance reports are examples of data that can be applied to operations. Company data or end-of-life procedures are examples of other data that can be used in digital twin design. 2. Modelling: If the data has been obtained, it can be used to construct predictive analytical models to display operating results, predict states like exhaustion, and predict behaviours. Tech simulations, physics, chemistry, statistics, machine learning, artificial intelligence, business theory, and goals can all be used to recommend behaviour. To aid human understanding of the results, these models can be viewed using 3D projections and virtual reality simulation. 3. Linking: Digital twin findings can be related to establish a summary, such as taking equipment twin findings and bringing them into a production line twin, which can then notify a factory-scale digital twin. It is possible to allow smart industrial applications for real-world operational advancements and improvements by using connected digital twins in this way. Application in Industries 1. Manufacture: Digital twins will increase efficiency and streamline processes while reducing throughput times. 2. Automotive: In the automotive industry, digital twins are used to capture and evaluate operational data from vehicles in order to determine their status in real time and inform product improvements. 3. Retail: Aside from manufacturing and business, digital twin is used in retail to model and optimise the consumer experience, whether at the level of a shopping centre or for individual stores. 4. Healthcare: Organ donation, surgical preparation, and operation de-risking have all benefited from digital twin in the medical field. Systems have also been built to model the movement of patients through hospitals and monitor where pathogens may occur and who may be at risk due to contact. 5. Disaster Management: Global climate change has had an effect on people all over the world in recent years, so using a digital twin to build smarter infrastructures, emergency response plans, and climate change monitoring will help to tackle it. Smart Cities: Cities will also benefit from the use of digital twins to become more economically, environmentally, and socially sustainable. Digital models can help planners make better decisions and provide solutions to the many complex issues that modern cities face. Real-time responses to problems, for example, can be guided by real-time data from digital twins, enabling assets such as hospitals to respond to a crisis in real time.
-
subodh tripathi replied to Vishwadeep Khatri's topic in We ask and you answer! The best answer wins!Analysis of stakeholders is an extremely useful technique to define, consider and prioritise all stakeholders that can exercise control or authority over an organisation or project. Analyzing stakeholders, among other things, will demonstrate who they are, what their desires and aspirations might be, and what problems matter to them (and to what degree). This exercise will tell you, just as importantly, their true level of interest and/or control over your project. A detailed review would ensure that due consideration is extended to all involved parties. The effects of dispute resolution can be significantly enhanced with access to this information. It can also make the regular stakeholder involvement activities even more targeted. Not every stakeholder is made equal. Nor are any of them worth the same amount of publicity. This is why it is so advantageous to perform stakeholder research. It helps you to clearly recognise and categorize all stakeholders in order of priority as it relates to your attempts to secure social recognition and ensure the successful delivery of projects. More importantly, this study would tell you the priorities of all stakeholders, the characteristics of project proponents and opponents, as well as the interrelationships and interfaces that exist between them that will impact or be influenced by the project. In a variety of ways, stakeholders can be identified: I. Brainstorming for teams: The idea here is to come up with the longest possible list of potential. It will not keep all recommendations, but reserve judgement for the end. Better to root it out than to neglect it. II. Experience of team members: Over time, chances are your team has built up valuable information, so be sure to tap into it. III. Historical data: piles of data from past initiatives may have been collected by your company. It actually makes sense to use this data to inform your stakeholder research, as it encourages productivity and builds on experience. IV. Comparable: You will often be working in a new location or on a particular project type. Look for similar projects wherever possible and find stakeholders that might have been involved. Chances are that the same kinds of stakeholders would influence the current project (or be affected by it). The more methods that you use, the less likely you are to neglect key stakeholders. There are a variety of different models that can be used to identify stakeholders based on their control over the results of a project or involvement in them. Some models take into consideration other requirements, such as the urgency and credibility of the stakeholder. The essence of your project, the resources available, and the timeline may determine which model is most suitable. Following Methods help you categorize stakeholders: 1. Power-Interest Matrix: This matrix shows how strong stakeholders are on one axis, and how much these stakeholders influence or are influenced by the company on the other. I. Key Stakeholders: Key stakeholders are those who have the greatest impact, the greatest strength, or who are commonly considered to be the most important to your project's success. Such stakeholders need to be closely managed because they not only have a vested interest in the project's outcome, but also have the ability to seriously undermine or strengthen its delivery. In the power-interest matrix above, main stakeholders are easily defined. Typically, they live in the quadrant of high power and high interest. It is also worth keeping close tabs on low-powered, highly involved stakeholders, as these stakeholders may ally with high-power, low-interest groups, thereby becoming key stakeholders. II. Primary Stakeholders: As they are the most impacted by your project, primary stakeholders are usually the easiest to find. Examples may include people who will have to be moved, who will be employed by the project, or who will benefit directly from new infrastructure growth. III. Secondary Stakeholders: Usually, secondary stakeholders are more difficult to classify because they are more indirectly influenced. Their motives may be more mysterious as well. Customers of the organisation, minority shareholders or members of a pressure group can be examples. 2. Salient Model: This model allows you to categorize stakeholders according to eight groups, typically visually displayed as a Venn diagram. In accordance with the salience model, as seen in the Venn diagram above, all stakeholders will fall within one of three overlapping circles. The ones that fall inside the overlapping parts (in the diagram above, 4, 5, 6, and 7) merit the most consideration. Non-stakeholders are represented by Section 8, which lies beyond the three circles. I. Power: This is basically the same as that mentioned above in the power-interest matrix (high power, low interest; high power, high interest; low power, high interest; and low power, low interest). II. Legitimacy: How acceptable is the participation of the stakeholder in the project? III. Urgency: How quickly can the needs of the stakeholder be addressed? 3. Stakeholder attitude and knowledge map: This can be achieved in a variety of ways, such as with a 4-quadrant matrix labelled as follows: I. Quadrant 1: Stakeholders who are aware of, and support, your project. There are stakeholders of your "champion". Usually, they do not need much care, but they should not be taken for granted. II. Quadrant 2: Stakeholders who are aware of, but opposed to, the initiative. Such stakeholders may never be supportive and contingency steps may be appropriate for your project to handle the risks that these negative stakeholders may pose. III. Quadrant 3: Stakeholders who, while they are generally unaware of what it entails, oppose your project. These stakeholders should be a key focus because, with the relevant details, their attitude can also be changed. IV. Quadrant 4: Stakeholders who support your venture but are largely unaware of what it means. There is a need to cultivate these stakeholders so they are not lost. Generally, stakeholders fell below 5 levels of support: a) Unaware: Certain stakeholders are ignorant of the project and its possible effects on them. b) Resistant: Certain stakeholders are conscious of but opposed to the project. c) Neutral: Neither for nor against the project are these stakeholders. d) Supportive: Certain stakeholders are in favour of and want to succeed in the project. e) Leading: These stakeholders are actively interested in assuring the progress of the project. Questions that will assist you in understanding stakeholders include: I. What economic or emotional interest do they have in your job's outcome? Is it negative or positive? II. Most of all, what motivates them? III. What data do they want from you and what is the best way to communicate with them? IV. What is their impression of your job at present? Is it based on knowledge that's good? V. Who generally influences their views, and who influences their opinion of you? In their own right, do any of these influencers then become significant stakeholders? VI. What would win them over to help your project if they aren't likely to be positive? VII. If you don't think you're going to be able to win them out, how are you going to handle their opposition? Who else could be impacted by their views? In their own right, do these individuals become stakeholders?
-
subodh tripathi replied to Vishwadeep Khatri's topic in We ask and you answer! The best answer wins!Trystorming: This approach consists of "Rapid cycles of real-time experimentation, used to test and adjust ideas for improvement before establishing standard work or broadly implementing procedures." This means, try it out in plain language! Try Storming involves physical acts that can include other senses to offer a better understanding to testers of whether or not a concept is viable. Trystorming differs from brainstorming in that, rather than only dreaming about potential ideas, it promotes the rapid creation and testing of a concept. It enables individuals on an initial concept to imagine, contact and further enhance. Rather than speaking, it also models action. We sometimes forget that the best way to create a process that works is through the iterative process of trying, adjusting/correcting, and trying again in our desire to design the ideal future state. The framework is based on three fundamental principles: Creating perfect solutions is not necessary. Be action-focused. Keep it easy with solutions. To build practical solutions, these concepts work hand-in-hand. Try-Storming can be used to consistently optimize any business process when applied correctly. One of the main reasons for using trystorming as part of any operation in process design is that it models action rather than speaking. Your team can soon recognize that the activity is more than just a meeting or a theoretical exercise by leaving the conference room and actually carrying out ideas during the course of the job. Furthermore, taking action usually increases exponentially the degree of idea generation and team interaction. The team will be able to imagine their proposals and turn strategies into concrete improvements easily by mocking and trying concepts. While trystorming takes much more energy than the conventional approach to design, the use of this technique can greatly reduce the total time taken to achieve a workable solution.
-
subodh tripathi replied to Vishwadeep Khatri's topic in We ask and you answer! The best answer wins!Diffusion of Innovation (DOI) is a theory popularized in 1962 by Everett Rogers, the American communication theorist and sociologist, which seeks to understand how, why, and the pace at which a product, service, or process spreads through a population or social structure. The diffusion of innovation, in other words, describes the pace at which new ideas and technologies spread. Marketers extensively use the diffusion of innovation theory to consider the pace at which customers are likely to embrace a new product or service. The introduction of a new product, service or concept is not an instantaneous phenomenon; in a social environment, it does not occur equally among all individuals. Consumers who accept an innovation earlier exhibit different characteristics than those who embrace an innovation later, according to studies. Therefore, recognizing the features of each segment that will either assist or impede the acceptance of an innovation is critical for marketers. There are five adopter groups in the diffusion of innovation theory: 1. Innovators: Characterized by those who want creativity to be the first to try it. 2. Early Adopters: Characterized by those that are comfortable with change and new concepts that are embraced. 3. Early Majority: Distinguished before the average citizen by those who embrace fresh technologies. However, there is a need for proof that innovation works before innovation is implemented in this category. 4. Late Majority: Characterized by those who are wary of change and would only embrace an idea after the majority of the population has generally embraced it and adopted it. 5. Laggards: Characterized by those who are very traditional and conservative – they are the last to make the changeover to new technologies. This category is the hardest to appeal to. The distribution of the five adopter groups is given by Rogers as follows: innovators account for the first 2.5 percent of the group to embrace an invention, followed by 13.5 percent as early adopters, 34 percent as early majorities, 34 percent as late majorities, and eventually 16 percent as laggards. Notice that the size of the category of laggards is much greater than that of the category of innovators at the opposite end of the continuum. Let's look at each type and how they vary from one another: 1. Innovators: Those who want to be the first to acquire a new product or service are innovators. They are risk-takers, price-insensitive, and have a high degree of volatility to deal with. For the success of every new product or service, innovators are crucial as they enable it to gain consumer acceptance. For example, innovators are considered to be people who stay overnight outside a movie theatre to be the first to buy the first show for a movie. 2. Early Adopters: Early adopters are those that are not quite as risk-taking as innovators and usually wait before making a purchase for the product or service to receive some feedback. Early adopters are referred to as "influencers" or "leaders of opinion" and are also considered within their social structure as role models. They are important in helping to reach "critical mass" in the spread of a product or service. Consequently, if early adopters of a product or service are limited, it is possible that the total number of people who accept the product or service will also be small. Early adopters are known to be individuals who wait a few days and spend some time reading reviews before going to see a movie. 3. Early Majority: The rest of the market reflects the early majority, 34 percent. The early majority are not risk-taking and usually wait until a trusted peer checks or uses a product or service. These people are cautious and want to buy stuff that is known to work. Early majorities are people who go to a movie after it's been out for weeks and received positive reviews and made money at the box office. 4. Late Majority: A large proportion of the market, 34 percent, also reflects the late majority. The last big group of customers to enter the market is the late majority. When making a purchase, they are considered conservative and are often technologically shy, very cost-sensitive, cynical, and cautious. Furthermore, the late majority is often forced by peers to buy the product or service. People who are waiting to make a movie available online or on Netflix are known to be the late majority. 5. Laggards: The last to accept a new product or service are Laggards. They resent change and may, until they are no longer available, continue to rely on conventional goods or services. In other words, when practically compelled to do so, they usually only accept the latest technology. Laggards may eventually catch a hit movie on network TV when it's shown. The diffusion of the theory of innovation describes the pace at which a new product or service will be accepted by customers. The theory therefore helps advertisers understand how patterns arise, and helps businesses determine the probability of a new introduction's success or failure. Companies can anticipate which categories of customers will buy their product/service and build successful marketing campaigns to drive acceptance into each category by using the propagation of innovation theory.
-
subodh tripathi replied to Vishwadeep Khatri's topic in We ask and you answer! The best answer wins!Inverted Theory: The Inverted-U Theory explains the relation between performance and pressure. It describes how to find the optimal degree of positive pressure at which people perform at their highest, also known as the Yerkes-Dodson Law. Too much or too little pressure can result in reduced efficiency. The left side of the graph, above, indicates the condition where individuals are not challenged. They see no need to work hard on a task here, or they are at risk of approaching their job in a careless, unmotivated manner. The center of the graph illustrates where individuals work at peak productivity. They are driven enough to work hard, but they are not so overloaded that they are beginning to fail. This is where individuals can feel the "flow," the fun and incredibly efficient state in which they can do their best job. The right hand side of the graph indicates that, under pressure, they begin to fall apart. The intensity and size of competing demands on their attention and a significant lack of control over their situation overwhelm them. They can display signs of hasty illness, anxiety, or out-and-out panic. Note: The exact shape of the curve, in fact, will depend on both the person and their situation. It is also important to note that obviously minor adjustments can lead to rapid repositioning on the curve in professional or personal life. Difference between pressure and stress: The Inverted-U Theory shows that, up to a degree, pressure can be positive. Stress, however, is never optimistic, and it's important not to confuse the two thoughts. We are activated in a beneficial way when the levels of pressure we feel are right for the work we do: inspired, committed, and enthusiastic about doing our best. But when individuals feel out of control, tension happens, and it's a totally negative thing. The Inverted-U Principle is about wisely using pressure, always mindful of where the advantages end and tension starts. Four influencers of the inverted u theory: 1. Skill level: The level of skill of someone with a specific task can directly affect their performance, both in terms of their attitude and their outcomes. A new job is likely to be difficult enough for a while. Later, if it begins to feel too convenient, it will require some sort of extra pressure to help the person re-engage with their role. 2. Personality: The personality of a person also determines how well they perform. Some psychologists, for example, assume that people who are extroverts are likely to do well in conditions of high pressure. On the other hand, individuals with an introverted personality may perform better with less pressure. The Inverted-U Theory prompts us to adapt our own personalities to suitable roles, and those of our people. When we assign roles and responsibilities, observation, thorough knowledge of individuals, and open communication are all necessary. 3. Trait Anxiety: Think of trait anxiety as the level of "self-talk" of a person. People who are positive of themselves are more likely to perform better under pressure. This is because they are under control of their self-talk, which ensures that they can remain "in flow," and can focus entirely on the situation at hand. By comparison, individuals who criticize or challenge themselves are likely to be overwhelmed by their self-talk, which in more difficult circumstances can cause them to lose concentration. The more individuals are able to reduce their anxiety about a task (for example, with practice or with positive thinking), the more they can perform. 4. Task Complexity: The difficulty of the task defines the amount of commitment and effort that individuals have to put into a task in order to effectively accomplish it. Under very high levels of pressure, people may perform simple activities, whereas complex activities are best done in a relaxed, low-pressure environment. But even though someone's ability levels are high, they can still benefit from a relaxed atmosphere in which their most complex work can be carried out. Conversely, in order to feel motivated and fulfill their potential, people carrying out low-complexity tasks will need extra stimulation. The Inverted-U Theory allows these four variables to be observed and controlled, striving for a balance that encourages dedication, well-being, and peak performance. Through controlling these four influencers, and by being mindful of how they can positively or negatively affect the success of your people, you can use the model. How to use this theory? When you assign tasks and assignments to individuals in your squad, and when you organize your own workload, the best way to use the Inverted-U Principle is to be conscious of it. Start by focusing on current pressures. If you're worried that someone may be at risk of being overwhelmed, see if they can take away any of the burden. This is an easy step to help them improve their job quality. By comparison, if anyone is underworked, shortening those deadlines, increasing key priorities, or adding additional responsibilities could be in everyone's interest, but only with clear communication and agreement. From there, reconcile the variables that lead to strain, so that your people can work at their best. Don't forget, too little pressure can be as overwhelming as too much! Try to provide tasks and projects of an acceptable degree of complexity to team members, and strive to create trust in the people who need them. Also, in your team, handle any negativity and prepare your people so that they have the abilities they need to do the jobs they are given. Nevertheless, keep in mind that the "influencers." will not always be able to balance you. Inspire and encourage the people so they can make effective decisions for themselves.

-
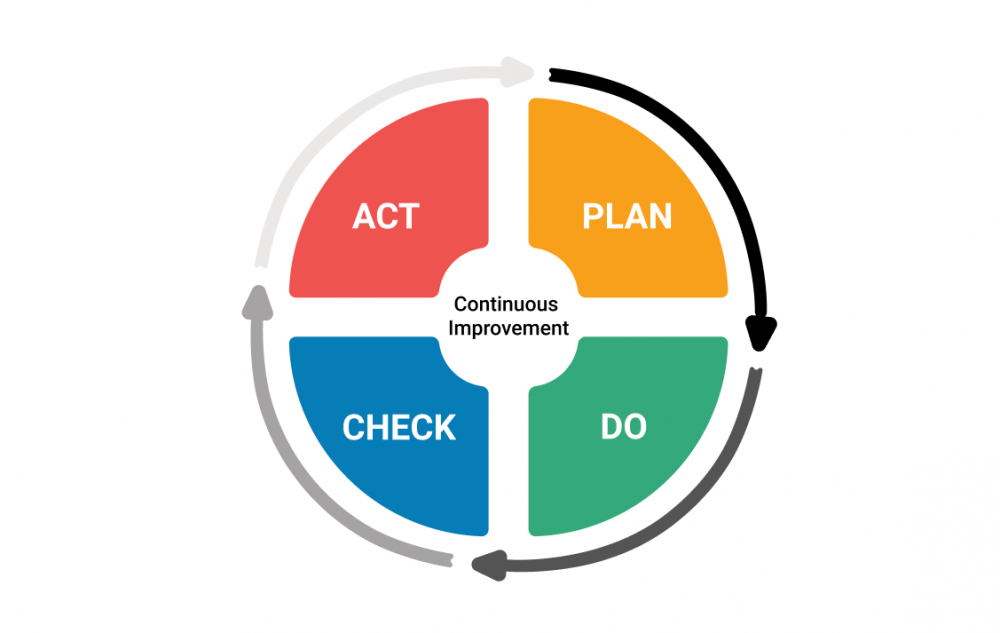
subodh tripathi replied to Vishwadeep Khatri's topic in We ask and you answer! The best answer wins!The PDCA cycle or loop is mainly an empirical technique that can be used in a fully internal way with great success where there is largely a full data set. To make the PDCA loop work, one does not have to consult the external environment or adapt to unfolding circumstances. With the knowledge that is available, PDCA can be used with great success on the factory or laboratory floor. Analysis in PDCA requires the use of a more or less comprehensive collection of data to draw efficient conclusions. To confirm or deny the hypothesis that our research has led us to, we use the data to make a decision about how to proceed, then we verify and act. This supports Continuous Improvement's structure and criteria. You can solve problems and execute solutions in a systematic, methodical way using the PDCA loop. Let's look in turn at each of the four stages: 1. Plan: Identify the problem or opportunity first. Perhaps the quality of a finished product is not high enough, or better outcomes should be an aspect of the marketing process. Explore in detail the available information. Generate ideas and screen them and establish a detailed implementation plan. Be sure to mention and make the success criteria as observable as possible. Later in the Check Point, you can return to them. 2. Do: Test it safely with a small-scale pilot project until you've found a possible solution. This will illustrate whether your planned changes produce the desired result, or they did not, with minimal disruption to the rest of your service. For instance, within a department, in a small geographical region, or with a specific population, you might arrange a trial. Gather details as you run the pilot project to demonstrate whether or not the change succeeded. In the next step, you'll use this… 3. Check: Next, review the outcomes of your pilot project against the goals you established in Phase 1, to determine whether your concept was a success. If not, go back to Stage 1. If so, move on to Step 4. You may decide to try more changes and repeat the phases of Do and Check. But if your original idea obviously does not succeed, you're going to need to go back to Phase 1. 4. Act: This is where you get your solution applied. But note that PDCA/PDSA is a loop, not a beginning-and-end process. The new baseline becomes your improved method or product, but you continue to search for ways to make it even better. OODA loop is more concerned with synthesizing an action from a data set that is incomplete. Since we are required to deal with all the variables in any environment such as COVID-19 that cannot be recognized, we must therefore be able to make a decision that we think will give us the highest likelihood of success and therefore reduce and eliminate any possible operational risk. The following are the steps of OODA loop: 1. Observe: The first step is to recognize the issue or threat and to develop an overall awareness of the internal and external environment. This can be equated with data collection in the business sector, where all the information is gathered about the existing organizational state, any rivals and the market. Recognizing that the world is dynamic is the main point in the observation process. In time, all information is a snapshot and must be viewed as such. Therefore, in order to be prepared to make decisions based on it, organizations must obtain whatever information is available as soon as possible. 2. Orient: The orientation stage includes reflecting on what was observed during observations and taking into account what should be done next. In order to make a conscious decision, it needs a substantial degree of situational consciousness and awareness. Since some decisions are unconscious or instinctual, prior to choosing a course of action, this step includes understanding what and why decisions are made. The orientation phase can be accomplished when applied to an individual level by developing mental models or mental rehearsal drills to put knowledge into narratives that influence judgment. With machine learning (ML) software, situational models can be generated in organizational applications to classify possible effects while eliminating any bias. 3. Decide: The decision process makes recommendations for an action or response plan, taking all possible consequences into account. This can be done by meetings or conversations that concentrate on developing a roadmap for the company as a whole. 4. Act: The action relates to the implementation of the decision and the associated improvements which need to be made in response to the decision. This phase may also involve any checks, such as compatibility or A/B testing, that are required before an action is officially carried out. Comparison and Contrast: People sometimes fall into the trap of seeing the OODA loop as a part of, or vice versa, the PDCA loop. The PDCA is primarily involved in analyzing, perhaps using some synthesis, while OODA is primarily involved in synthesizing using all possible empirical data points, but realizing that the data set would still be mostly incomplete. The unpredictable environment in which we find ourselves these days. is increasingly demanding greater tenacity and dynamism in terms of how we behave proactively and also the growing importance of being able to fluidly alter plans and responses based on the emerging changes we see around us (which are frequently outside of our control).

-
subodh tripathi replied to Vishwadeep Khatri's topic in We ask and you answer! The best answer wins!Cellular Manufacturing: When we divide the entire manufacturing system into smaller groups or cells of machines, then it is called Cellular Manufacturing. It is an effective grouping of all the resources needed to produce a product. In order to improve coordination and allow everyone to see what is going on at all times, these tools, which typically include people, materials, devices, instruments and other production equipment, are organized in close proximity. The structure is much like that of a flow device, but it is more flexible. Normally, cells are laid out in a U-shape so that staff can move, load and unload parts from machine to machine. The Cellular Manufacturing also enhances team work within employees of different departments. Workers become multi-skilled and more adaptable to the business needs. Cellular processing is a tried and tested method that, while improving lead times, quality and efficiency, has lowered product costs. They work in almost every form of production environment. One explanation why cells are efficient is that a lot of the waste inherent in a standard production process is always removed. Let's have a look at some of the waste: 1. Over Production: It means producing more than what can immediately be used by the next operation. By making it easier to manufacture just what is required, a production cell helps eliminate the waste of overproduction. Both activities are in close proximity, and it is simplified to balance the steps in the production process. One operator can complete several operations in a cellular arrangement, which can increase the balance of work and simplify product flow. 2. Excess Inventory: Excess inventory is a consequence of the waste of overproduction. It is also one of the most expensive wastes of all production. The problem of inventory waste is tackled by manufacturing cells in a variety of ways. Next, the work-in-process inventory is minimized by balancing the work and instructing operators not to surpass what the next individual can manage. Excess inventory can not be accepted by the design of the cell layout, because there is no place to put it. The vacant space paradox, which says the amount of vacant space is inversely proportional to the amount of time it is vacant, is resolved by manufacturing cells. 3. Over Processing: Another type of waste is to process a component more than is needed to make it work properly. Via near proximity of all processes and the technique of only producing what can be used, cells fix the waste of over-processing. As handling is reduced, unnecessary processes such as packing and unpacking are avoided and that which remains poses little risk of harm. Sections of the cells are processed sooner, so it is possible to remove some of the other product safety processes as well. The near proximity of all activities enables the detection of processes that do not add value to the product. 4. Motion: In a traditional manufacturing process, there is substantial wasted motion. This also results from a work area that is poorly structured. By bringing everything together in a production cell, it is possible to minimize, if not completely remove, wasteful motion. An obvious change is the removal of travel to other places to get pieces, but what can not be overlooked is the reduction of motion within an individual process. Motion shifts from non-value added to value added with a well planned cellular activity. Much wasteful movement is avoided as focus is placed on easily finding all operators need to do their work. 5. Defects: Defects are mostly the result of all the previously described waste, but they may also be the result of poor process management, poor product designs, poorly chosen equipment, and poor demand communication. Cells will not remove defects entirely, but they will allow for quicker detection of those that do exist, thus allowing for expedited corrective action. With close proximity to resources, defects are immediately communicated to all parties concerned, so no more than one defect at a time should be made. 6. Waiting Time: An unbalanced workload is one of the most frequent triggers of waiting. By promoting more coordinated flow, manufacturing cells will decrease waiting. Synchronized product flow is simpler with all the necessary resources clustered closely together. Worker versatility within the cell can also help minimize waiting time and when they are not busy, operators will assist others. 7. Order Tracking: While not widely accepted as a waste, order monitoring is very time-consuming and not a value-added process in production operations. Simplified scheduling is given by a production cell. As all tasks are grouped together, on a first-in-first-out basis, the order can be fed to the cell, and monitoring the status of orders becomes a visual search. In order to schedule the cell, complex computer systems are usually not needed. Many organizations use simple scheduling boards that can be used by the whole team.

-
subodh tripathi changed their profile photo
-
subodh tripathi replied to Vishwadeep Khatri's topic in We ask and you answer! The best answer wins!Grounded Theory (GT) is a form of qualitative research that studies peoples experience for some kind of process and then generates a theory or explanation of how that process works. Its important to note here that the theory that’s created in grounded theory is generated only from data that’s collected in the study. The theory does not come from other sources like other theories or textbooks or the researchers own opinions or so on. That's why it is called Grounded Theory. 1. The first step of conducting grounded theory is to Determine if grounded theory will answer your research question. Grounded theory is good to use when there are no existing theories regarding the process that’s of interest to the researcher or the theories which were created from assert for a certain group of people that the researcher is interested in. For example, there is no theory that exists in terms of the process of becoming a regular smoker while attending high school college. 2. The second step is Recruitment of Participants who have gone through or are going through the process of interest. This is known as theoretical sampling. Finding a sample of participants who have experienced the process and can help develop a well rounded theory. For our example, we can recruit smokers/former smokers from high school, colleges and recruit people from a wide range of racist ethnicity or social economic backgrounds. 3. The third step is Data Collection. The main type of data collected in grounded theory is interview data although other forms of data can also be used for a triangulation. The main data that comes from interviews and interviews are conducted until saturation is reached. Interview questions are open ended like a) What was the process you went through to become a smoker? Such questions address the core phenomena. b) What influenced that process to occur? These are known as casual conditions. c) What actions were taken by the person in response to the process of becoming a regular smoker? These are known as strategies. d) What were the outcomes or effects of those actions? This known as consequences. These questions help in creating a good solid theory. 4. The fourth step is Data Analysis. There are three stages of analysis: i. Open Coding: This is when researcher reads the transcripts and determines different kinds of categories or themes that are found in data. Think of open coding as having an open mind, being open to what the participants are saying and open to different kinds of categories that you are seeing in the data. Coding is when you circle a chunk of text and write down the name of the category you have come up with next to that chunk of text. There you just coded that data. During open coding, researchers are also conducting constant comparative analysis which is when researchers constantly compare the data to the category to see if you are being consistent in how you are coding the data in each category. If a new chunk of data does not fit into a particular category, maybe you need to create a new category. During open coding, researchers also conduct memoing which is when researchers make memos to themselves throughout open coding regarding how the categories are beginning to explain the process and how those categories can be formed into a theoretical model. Open coding is finished when you have compared the data and categories to each other over and over that you feel like there are no new categories coming from the data. ii. Axial Coding: This is when the researchers uses the codes and memos and thinks about how each of the categories relate to each other. This is the part of analysis that actually develops the theory. The researchers looks for categories that may be the core phenomena, casual conditions, strategies and consequences. Then he/she thinks how these categories connect to each other. They show these connections through a coding paradigm or a logic diagram which is visual model that shows the categories with lines and arrows to show an explanation of how the process works. iii. Selective Coding: Here the researchers write a storyline about how the theory explains the core process, how all of the categories are related. It’s overall explanation of the theory. 5. The final step is Discriminant sampling. In this, the researchers recruit whole new group of participants who are similar to the original participants and same research is conducted. The point of this is to determine if the new participants experiences with the process of interest will be similar to the theory that was already created. This helps to test and verify if the theory is accurate or not. Limitations: 1. It can be hard to recruit participants depending upon the process of interest. 2. It can take a lot of time to gather data, analyze data and then come up with a model and so on. 3. Analysis can be difficult to categorize and code all of that data. 4. There may be researchers who are biased in terms of the study and what the categories are and so on. 5. Small samples of participants makes it difficult to say that their experience with that process is what’s been felt by others, although discriminant analysis helps to verify the model if only we are given with a small number of participants of a particular area. Hypothesis Testing on the other hand is when statistics of a sample are analyzed to determine if a hypothesis (which is explanation of something) is null hypothesis or alternative hypothesis. We use a small sample of data to verify our hypothesis rather than testing as much as data as possible. If the hypothesis turns out to be not verified then we call it a null hypothesis. In response, we create a small new hypothesis which is less relevant as compared to Grounded Theory.
-
subodh tripathi replied to Vishwadeep Khatri's topic in We ask and you answer! The best answer wins!Process Decision Program Chart (PDPC) is a Management Planning tool for recognizing and writing down the steps required to complete a project. In this way, one can prepare a contingency plan by drawing out every possible solution. This allows you to systematically pinpoint what might go wrong with a plan, so that you make a contingency plan to limit risk. It provides a structural and systematic means of finding errors with a plan while it is being created. This tool identifies panned activities and ask WHAT IF questions to uncover potential problem areas. Then, countermeasures are developed against those potential problems. When to use: When project should be completed within a deadline. When project is large and complex. When the price of failure is too high. How to create a Process Decision Program Chart? Devise a tree-diagram for the proposed plan starting with objective. For each task on third level, brainstorm what could go wrong. Review all potential problems and eliminate any that are unlikely to happen or whose consequence could be insignificant. For each potential problem, devise countermeasures. Decide how practical each countermeasure is by using criteria like cost associated with it, amount of time required, feasibility of the action and it's effectiveness. Use symbol 'X' for IMPRACTICAL COUNTERMEASURE and 'O' for PRACTICAL COUNTERMEASURE. Questions that might help you identify problems: What was your previous experience in these situations? Are your assumptions correct or there is a margin of error? Are these actions/events/conditions controllable? Following is an example of using PDPC:


