

Sreyash Sangam
Lean Six Sigma Green Belt
-
Joined
-
Last visited
Everything posted by Sreyash Sangam
-
Bullwhip effect (Brief Concept) : Bullwhip effect is a phenomenon, particularly in supply chain management, in which the more processes or steps we go away from the Voice of main customer, the accuracy of forecasting gets depleted. That means if we see in terms of graphical representation of the peak of graph, it is very low at the initial point and keeps getting enlarged as it moves away from the initial position. Why It Happens : It happens because of following key factors: Communication Ineffective Inventory Management Process Management system Lack of clarity on End to End Value chain Poor Data based decision making Lack of focus on internal customers What is the Impact : Generally, In order to avoid the stock out situation, every company tries to build excess stock so that end customer demand can be met without any deviation. This results in piling up of inventories at various intermediate level through out the supply chain. This blocks the cash flow and hence impact the overall profitability. How can we Improve : In order to improve the Bullwhip effect, we need to consider improving the above critical factors. Management system shows the reflection of attitude of the Leadership team to grasp the actual Voice of customer and transfer it to last leg of the supply chain without hampering its sanctity. End to End Value stream mapping is an effective Lean tool to understand the current status of business scenario and what are the underlying values of customers/expectation from their voices. These voices we need to capture on regular basis and led the team to devise the fundamental of internal customers. Having a continuous feedback loop with two way communication system with proper data driven decision making mechanism will help in establishing the culture of proper decision making without emotion and prejudices. The actual expectation of the customer can be transferred to the end producer by deploying various Lean tools like data based forecasting, VSM, Kanban, Digital dashboard, Pull system, Takt time concept, Frequent deliveries, Muda elimination, Continuous flow processing etc. But whats most essential is Management commitment to continually meet the customer's real voice on regular basis. Thank You!!!
-
Quality Assurance and Quality Control are both important component for the robust 'Quality Management System'. Quality Control (QC) in general is a reactive concept which deals with the intermediate quality parameters of products and process once the activity is performed. e.g, The assembly line in an auto industry have passed certain number of vehicles and than QC Team, based on the agreed and standard set of parameters, does the inspection of the same to check where there are any deviations. In,fact there is a concept in industrial world of TEST - MAKE - INSPECT . So inspection part only comes post the make or manufacturing activity is completed. Another example we can consider is of Pharma industry, Here we have big team of Quality control division, who are responsible at each stages for checking the conformance to standard of Raw material, Intermediate goods as well as the finished goods. All theses processes involve set of equipment, people and parameters based on standard requirement. Hence the major role of QC function is in ensuring that the standards are adhered to in line with the agreed set of parameters. It is always performed as second check or as the validation of completed process, hence it is reactive. QA or Quality Assurance on the other hand is a larger umbrella or broader concept which is process oriented and take utmost care on minute details at each step, corrects when the process starts deviating. The Quality assurance does derive the Voice of customer and translate those voices into meaningful, relevant and appropriate set of standard parameters & principles customized to organisation internal set of framework. e.g., If the process has been defined and qualified by the operation steam in any organisation, it requires to be validated by Quality assurance team so that once the process becomes full fledged, it does produce the goods or services with intended quality parameters as expected from the customer. Of course, in order to do that, QA continuously need feedback from QC on the quality of product, category & type of deviations. This helps the QA to formulate policies, rules, stringent protocol, so that instead of waiting for the final quality of product or services, the process can be made more robust and continuous monitoring can be done for its effectiveness. In conclusion, both the QC and QA works on continuous feedback loop, wherein based on the reactive approach QC highlights the standard of products/services, eventually gives the feedback to QA, which build a proactive mechanism to ensure process effectiveness.
-
Median is a statistical tool for data representation which is a measure for central tendency. In cases where, Mean which is the average of all the data, are not able to represent the correct picture of data requires Median as an indicator which is the central value in the entire data sets and make a clear distinction between first half and second half of the data sets. EXAMPLE 01 : The sales performance for 9 units of an apparel industry showed above average performance for last 3 quarters. So If Team goes by Mean as an indicator for statistical performance monitoring, management would assume that, the KPI is performing well. However if the team distributes the data for all 9 units using Median as an indicator, it was observed that 4 of the 5 units are performing very low in the sale performance, and the other 4 are performing exceedingly well. That kind of statistical representation gives a clear picture to the management that, those 4 units which are not performing well need to be prioritized and given special attention for improvement. But this kind of analysis would not have been possible, if merely we could have used Mean as an indicator. EXAMPLE 02 : One of the pharmaceutical manufacturing organisation has got 17 assembly lines. The management is worried about the Overall Equipment Effectiveness (OEE) performance of the Assembly line as a whole. Against the target OEE of 60%, consider if the average,i.e., Mean OEE of assembly lines come out for past one year comes out to be 63%, than obviously anyone can make out that, we are performing well in terms of average OEE performance of the site. However, if we would like to go into detail into details for bringing continuous improvement in the system, we will be extrapolating the data in terms of median representation. That will give us the clear picture in terms of Which assembly lines among 9 lines are giving poor performance in OEE against the central value and which of them are performing well. This will be a significant input for the management to focus on the assembly lines which are constraints/ poor performer. Hence, Median can be a good tool for ANALYZE phase of Problem solving. EXAMPLE 03 : Lets take another case from a service industry. Suppose there are 121 delivery boys for the Food delivery startup. Operational excellence team started to monitor the data for delivery time accuracy for each of the delivery boys in its dashboard. Even in this case, like above examples, Median can be a good tool to understand the best performers and least performer against the central value. Thus, being the med point in the entire data sets, Median helps in structural distribution of data, which brings more clarity to the problem solving team, on which area to be focused for improvement as a priority.
-
1. All the machines, processes and instruments are connected wirelessly with clear communication in an integrated manner. 2. Works towards clear exchange of data and inter-dependency in the processes, products and systems. 3. Cyber physical system create a kind of simulated environment of real world like situation. 4.It works in sync with DDA i.e., Digital and Data analysis. 5.More decentralized decision making and business strategy making. 6. Complete data based decision making rather than experiential decision making. 7.Based on the clear visualization of tasks, data, inter system connectivity, 4.0 helps sustainable business development.
-
Net promoter score or NPS, as we call shortly, is one of the analytical tool to measure the customer satisfaction index or loyalty of the customer to a particular manufacturer or service provider. It is an important metric to gauge the performance of producers against their stated brand or value product. The Metric uses scale from -X to +X and places some questions to the customers. List of questions varies widely from basic features of the product/services , customers likelihood of using the same product/services again, their probability to refer the similar brand/product/services to other potential customers. Based on the score, all customers and buyers are categorized into Detractors, neutrals and promoters. Former being negative or poor response and the later being positive or worthy response. The purpose of converting ordinal data (-X to +X) to discrete data (Categorical) are : a) To have a holistic view point on the categories of customers being detractors, Neutral or promoter at the larger level in the organisation which can help the organisation for data based decision making in expedited manner. b) Categorization of data helps to have a focused attention of a particular type of customers based on the questionnaire type and response. This helps the management team and staff to brainstorm on proposed mitigation plan against those challenges. c)Logical interpretation of data can be better executed through categorical data than ordinal data which can be helpful in complex problem solving and decision making. This is because the ordinal data are spread in unorganized and unsystematic manner. Categorical data takes into cognizance various independent variables to make a distinction between different zones for further analysis. One example can be taken from service industry : Let us assume, company XYZ has implemented a process to reward first 50 customers with exciting gift pack in order to promote the newly launched brand. In order to determine the NPS, list of questions are asked from existing customers in sample (n) basis. once the survey results are out, the categories are made for the customers to distinguish them based on questions whether they are detractors, promoters or neutrals. For an example, if one of the Question has got 70 % of the sample population are detractors, than it is evident for the management team to focus on the ways to mitigate the challenges pertaining to that particular question. In case of categorical data, if this would have been a ordinal data, it would bring ambiguity to identify areas for continuous improvement and make critical business decisions. Net promoter score or NPS, as we call shortly, is one of the analytical tool to measure the customer satisfaction index or loyalty of the customer to a particular manufacturer or service provider. It is an important metric to gauge the performance of producers against their stated brand or value product. The Metric uses scale from -X to +X and places some questions to the customers. List of questions varies widely from basic features of the product/services , customers likelihood of using the same product/services again, their probability to refer the similar brand/product/services to other potential customers. Based on the score, all customers and buyers are categorized into Detractors, neutrals and promoters. Former being negative or poor response and the later being positive or worthy response. The purpose of converting ordinal data (-X to +X) to discrete data (Categorical) are : a) To have a holistic view point on the categories of customers being detractors, Neutral or promoter at the larger level in the organisation which can help the organisation for data based decision making in expedited manner. b) Categorization of data helps to have a focused attention of a particular type of customers based on the questionnaire type and response. This helps the management team and staff to brainstorm on proposed mitigation plan against those challenges. c)Logical interpretation of data can be better executed through categorical data than ordinal data which can be helpful in complex problem solving and decision making. This is because the ordinal data are spread in unorganized and unsystematic manner. Categorical data takes into cognizance various independent variables to make a distinction between different zones for further analysis. One example can be taken from service industry : Let us assume, company XYZ has implemented a process to reward first 50 customers with exciting gift pack in order to promote the newly launched brand. In order to determine the NPS, list of questions are asked from existing customers in sample (n) basis. once the survey results are out, the categories are made for the customers to distinguish them based on questions whether they are detractors, promoters or neutrals. For an example, if one of the Question has got 70 % of the sample population are detractors, than it is evident for the management team to focus on the ways to mitigate the challenges pertaining to that particular question. In case of categorical data, if this would have been a ordinal data, it would bring ambiguity to identify areas for continuous improvement and make critical business decisions.
-
Below are certain examples of scenarios wherein the organisations have deployed various AI and digital algorithms to improve the business performance. example 01 :One of the Financial transaction company called Paypall had collaborated with Rapid Miner to gauge the intentions of Top customers and monitor their complaints. The digital analytics team of Rapidminer helped Paypall to manage and analyze the huge amount of data. AI and data science engineers of Rapid Miner used SENTIMENT ANALYSIS in different languages based on the various social media posts and messages. Rapidminer also find most iterative word or repetitive word to identify the common area for concern by the customers. After various such analysis Paypal was able to categorize the customers into Top Promoters and Top detractors. This helped in improving the customer satisfaction as well as the Total Turnaround Time(TAT). Example 02: Dataiku is a Newyork headquartered company that offers Dataiku DSS (Digi science studio). It helps the customers of vivid range involving transportation, logistics, using raw data to predict which component is going to fail and at what interval. Using the vehicle sensor data, it can be used to give the predictive solution of what and how frequently the parts are going to fail the frequency for Preventive maintenance. This digital tool and predictive analysis helps reducing the downtime. Example 03: The bank of America, one of the customer of a digital technology company DataRobot. BoA might lend money to customers in the form credit, loans, assets etc. Growing their business means giving more credits to the clients. The Data Robot enabled AI and data analytics is used to predict which particular clients or customers can get defaulted based on the raw data and historical performance. This is done by assessing the Loan repayment data and social media platforms. Also this digital tool can help in identifying the default rates of new customers identifying the rate of default by existing customers. Example 04 : One of the AI and diigital platform led company, Apixo can use HCC Profiler to predict the risk of risk plans they list on health insurance exchanges. The software could potentially analyze data from patient records and medical billing statement to provide health insurers listing certain plans with an overall risk score of such plans. One of the main source for these case studies: https://emerj.com
-
Drum, Buffer, Rope is a supply chain technique to define the flow of processes based in pull system of production. Drum is synonymous with the first link of the supply chain which defines the pace of flow or pace of manufacturing which in order is followed by rest of the processes. This is in line with the concept of Theory of constraints which states the business performance or supply chain effectiveness is controlled by one or few critical factors which are actually bottleneck in the entire pipeline.By identifying that area of constraint, effort is made to improve that so that Throughput and effectiveness of the line can be improved. In Drum, Buffer, Rope system, Just like Theory of constraint, pace is set by the bottleneck operation i.e., the process or operation with least cycle time or efficiency is placed in the front and other processes / operations follows the front line. This helps to make sure that the preceding operations work in tandem with the first operation and hence maintains the optimum inventory in result. The speed of preceding operations is increased based on the improvement in the effectiveness of the front bottleneck process. Thus Drum refers to the process operation which sets the pace and stage for assembly line or supply chain pipeline. Buffer refers to the number of amount if inventories in between the operations. These intermediate inventories are nothing but the business cash entrapped in between the processes. Rope is an imaginary line which connects the entire set of operation in the pipeline. Toyota introduced the functioning of Kanban which resembles the Drum, Rope and Buffer. Kanban set the pace of the pull system. It acts as the tool to develop the pace for manufacturing and regulates.
-
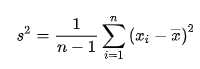
Bessel's correction: When we intend to perform the statistical analysis of data and get valuable inferences from it, there are various statistical calculations we perform which includes, Mean, Standard Deviation, Variance etc. While carrying out these statistical analysis, we have either sample of the data from a large population or the population itself. For answering the above question lets consider the standard deviation as an example for better clarity. If the consideration in point is the population, then the chances of data we obtain is normally accurate. This is because entire set of data from the large population is considered and hence all kind of variability is accommodated and the analysis which we obtain is expected to be accurate, considering given conditions to be true. However the difficulty arises when the sample size, n is small which is extracted from the BIG population. In this case, the probability of getting the exact & accurate result reduces in proportion to the reduction in sample size. In this case, the accuracy and exactness of result from the statistical data reduces. Therefore, in order provide some degree of freedom and make the calculation more accurate, one of the correction factor is incorporated which is called as Bessel's correction. In normal scenario, we consider, n as the sample size and accordingly, mean, standard deviation and variance is calculated. But in case of the Bessel's correction, n is replaced by n-1, i.e., the sample size is reduced by 1. This is turn widens the degree of freedom and increases the probability for giving more accurate/exact analysis, though not in consonance with the case when we use Population Size in overall calculation. However, it is to be noted that, there is no standard procedure or threshold criteria when Bessel's correction has to be used. However the project leader or six sigma experts need to make decision based on the sample size of the population. When the sample size is small it is always significant to apply Bessel's correction. However if the sample size is large, than it should only be used in case of criticality of the decision making. The unbiased method of calculating the sample variance can be calculated as below (n is being replaced with n-1):
-
Bayes theorem is highly applicable in business scenarios wherever we want to find the probability of occurrence of any event when we have certain clues and guides regarding the processes impacting the outcome of happening of any event. Bayes theorem is closely associated with the Prior and Posterior probability in which the all the evidence and data associated with the occurrence of an event is well known in advance and that is primarily used to calculate the probability of occurrence of an event. One of the example associated with the manufacturing of textile machinery wherein the Bayes theorem applicability can be tested is: the consumption or procurement of the textile machinery are dependent on several factors. Lets say the most important factors among all those is the tax exemption announced by the Ministry of textiles for textile promotion. This is one of the probability with which the Original Equipment manufacturer can determine the probability of selling of the textile machinery. Thus Bayes theorem is associated with the degree of belief of a certain process to achieve certain specification. It can be accounted in two scenarios : Pre and Post gathering the evidence. once the probability is calculated before gathering the evidence it is called is Prior probability calculation and in case, probability is calculated after gathering the evidence, it is called posterior probability calculation.
-
Heuristic methods are Non conventional method of conducting the problem solving exercise, wherein we get to know the best optimized solution of the problem, for which the solution through statistical approach is either not possible or not feasible. This is very useful in cased where in the general problem solving technique is unable to get to the root cause and validated countermeasures. Heuristic methods employ various tools and techniques, processes and procedures to come to the best agreed optimized solution. Some of the Heuristic tools include Trial and error, Best among many, Experience level, Satisfactory level, Prioritization, Behavioral aspects etc. These tools can be applied when the circumstances where we are not able to get the commonly agreed solution to the problem through logical approach. some of the examples may include" 1. Financial Investment : To decide on the scope and direction of equity and non equity investments in particular financial domain 2. To finalize the location of land among few option for starting of a new industrial venture 3. To identify the area of hot spot customers which requires to be focused when the statistical data is misleading. To conclude, Statistical and systematic approach to problem solving is praiseworthy and must be employed but an organisation must deploy the heuristic methods based on need and applicability. For this to happen there should definitely be the reserve of knowledge, skills, expert panels, experiential data etc.
-
Box Plot is one of the most effective and efficient ways of representing the data. It is one of the standardized ways of representing the data in the form of different Quartiles. The box plot helps distinctly in following important ways: 1. Helps in understanding the outliers in the group. 2. Clear visual representation and standardization of the data, hence facilitating the decision making process. 3.Helps the leaders to understand the pattern and behaviour of data. 4.Minimum, Maximum and Median can be understood clearly unambiguously. 5.Spread of the data can be understood in simple and clear manner. For example, the performance of the different sets of vendors in the process of service deliver, classification of students in a class to score marks, performance of machine at varying indefinite variable parameters, etc. Moreover, the BOX PLOT also helps to determine the Interquartile range i.e., Q1-Q3, This helps to compare the distribution of data into different segments. Box plot is more of a analytical and decision making statistical tool that represents the data in more striuctured, standardized manner.
-
Basically data can be categorized into quantitative and qualitative. Qualitative data can be further classified into Nominal, Ordinal and and Binary. Each data has its own ways to get the inference of the data. Since the Kendall's coefficient is designed to identify any number of distinct outcome from the list of Ordinal attribute data, it become highly ineffective for the Kappa value to do so once it is used to make the inference from the set of Ordinal attribute data. Ordinal data is one which has got some scale range in its preparation. For example: 1 being least, 2 for some other category,3,4,so on and 10 being the Most. The inference from these data sets can be made properly by Kendall's coefficient. Kappa value is useful in case of nominal attribute data sets wherein, where in the data has some names, symbols like Black, white; strong, weak etc. Here the data sets are organised into categorical form and different observers provides some kind of ranking to the data in terms of his/her understanding. Later on the hypothesis and actual observed data from various category is used to calculate the Kappa value. But the Kendall's coefficient is useful in cases where the data are not categorical but having some kind of grades or sequences. Like, the taste choice of food in a restaurant can fall into this category like 1,2,3,4...n. This become more specific and quantified in terms of calculating the customer taste. Thus Kappa value is only useful when we have to get inference from the data which are having category not the grades, to ensure : Good statistical reliability inference from the data Effectiveness of the accuracy between hypothesis and actual value Helps in effective utilization of statistical software tools like Mini tab, Sigma XL etc.
-
Simpson paradox is a situation in the world of statistics in which a particular pattern or trend is witnessed from the sets & subsets of data from two or more groups. But as soon as we combine all the sub groups or sub groups , the trend reverses dramatically. This is essential in order to have a logical and rational causal relationship the cause and effect. Simpson paradox can be understood well with few of following few examples: a. In Pharmaceutical company the turnaround time of product A,B,C......n will give a particular type of trend once these are combined in a common group the trend gives a different picture altogether. This might happen because of various intrinsic features or parameters which are generic to the product range and type. b. Another example can be understood from the example of data to deliver the product from the warehouse of an e commerce company to the house of customers. Simpson paradox should actually be considered as a check point to validate whether our approach for drawing the causal relationship is rationale and logical or not. This will help to make sure we follow structured and analytical methodology towards identifying the root cause and make develop the pattern or trend more meaningful. Many Thanks
-
Process cycle efficiency is the proportion of time a process or activity is involved in carrying out value added activities. Therefore, this is also sometimes referred to as VA/NVA ratio. All the activities involved within a process or throughout the process can be categorized into value added and Non value added activities. In Lean terms the value added activities are those in which customer is willing to pay. Non value added activities, hence are considered to be the "WASTE" for the process and the organisation. These wastes can be summarized in terms of TIMWOODS i.e., Transportation, Inventory, Motion, Waiting, Overproduction, Over processing, Defect and underutilized skills. Process cycle efficiency once calculated gives a clear understanding on how much waste exists in the process. Average value added proportion with respect to the Non value added is around 5-10% : 90-95%. Thus the Process cycle efficiency helps significantly a tool or enabler for improving the overall process performance. However, it is not considered as the best metric for process efficiency because of following reasons: a. Process cycle efficiency does not include the dynamic performance related to the quality parameters associated with the process. Lets say, in the welding process of sheet metal components , we have done the value added- Non value added ratio mapping and separated the VA and NVA activities. But it does not involve the rejection associated with the process during the welding activity. Process cycle efficiency might not be the appropriate metric. b. Uncertain breakdowns : Process cycle efficiency does not involve the hidden issues lying with the process. During the normal operation, various issues can erupt which certainly impacts the overall efficiency of the process. c. Performance of the process is a dynamic concept, in the sense that, it keeps on varying in commensurate to various internal and external factors. Process cycle efficiency will be an inaccurate metric to measure and manage the same. e.g, The performance of the Tablet coating machine has many dependent X's like spray rate, inlet pressure, air flow rate etc. and there are also certain independent variables which are unknown factors. VA-NVA analysis also Process cycle efficiency does in incorporate these transient factors and hence does not qualify to be the best metric. In totality, Process cycle efficiency contributes to build a strong process efficiency, however it cannot be considered as the best metric for measuring the process efficiency. We have several Lean metric available which helps to measure and improve the process, for example : Overall Equipment effectiveness, Yield , Turnaround time etc.
-
-
Net Present value refers to the difference between the amount of cash flow achieved and the quantum of cash invested in a project / activity. In most of the situation, the organisational leaders are required to deliberate on the decision making in terms of projects profitability based on the cost - benefit analysis. Net present value (NPV) helps in order to process that decision making. After the NPV calculation, if it comes out to be POSITIVE, than the project or activity is said to be PROFITABLE or if the NPV comes out to be NEGATIVE, activity/Project is said to be NOT PROFITABLE. EXAMPLE : A Pharma company is required to make a strategy for one of the underutilized packaging line. When the Team calculates the investment required to bring product A and Product which are the two available option, they find the the investment required for product A for till Break even point i.e., next "n" years is "X" times more than the investment required to roll out product B in the proportionate time value. However the cash return or cash flow for Product A is found to be lower than the product B. This helps the team to do a comparative analysis between the investment and the return and hence estimate the Return of Investment on a particular project. Another example can be in terms of determining the best decision for industrial expansion. Suppose the management needs to chose among options A,B...N which represents the geographical locations for business expansion. What makes sense is to estimate the profitability through comparative analysis. This can be done by determining HOW MUCH CASH THE PARTICULAR INVESTMENT can generate. Like this it finds its usage in various sectors, like choice of consumer goods for the consumer, decision to launch an entirely new automobile model, business diversification, New Technology Implementation etc. In general, Money we have in hand at the present moment is worth more than money we can collect later on. That's because we can invest it or earn interest on it. Future money is less valuable because of inflation. NPV allows us to translate the amount of money we expect to make from an investment into today's dollars. To calculate it, we will need to know the upfront cost of the investment and the projected revenues for each year. We'll also need a discount rate, which is a company-specific number set by our finance department. NPV is therefore a strategic and concise comparative analysis tool which helps vociferously in terms of decision making and stands a chance for best possible estimation in terms of Returns on Investment.
-
DPMO and DPU are both used to calculate and measure the results by analyzing from the available data sets. DPMO - Defect per million opportunities are used in scenarios when the process contains uncountable errors or defects. Defects per unit (DPU) means the data is attribute data when the classification is in terms of binary i.e, yes/no, good/bad etc. Former is used in cases of measurement data wherein the classification is binary like satisfied . not satisfied. These include the examples like conducting surveys of employee satisfaction, saying the quality attribute of an item in terms of good/bad, high/low etc. These can also be used in deciding the binary classification of an object like pass/fail etc. However in the continuous attribute data which can not be counted like temperature, pressure, height, measurements, etc.In such scenarios we use DPO or Defects per unit is legitimate and most rationale in calculating the performance in such cases. These can be applicable in pharmaceutical, aeronautical, automobile and other industries wherein we are dealing with the continuous data. In general, continuous data is preferred over the discrete data because they are most efficient as have to deal with fewer data points. Therefore the usage and applicability of DPU or DPMO method depends on the pattern of data we are dealing with and the end point applicability.
-
Process FMEA and DMAIC are complementary to each other as both of them serve the purpose to meet the end goal of process improvement. Even though the FMEA was initiated by industries much before the advent of DMAIC methodology came into picture, however currently these are widely used in most of the DMAIC elements, particularly Measure, Analyze, Improve and Control. Primarily, Process FMEA is used to identify the critical X's by calculating the Risk Priority Number against each X's. This helps the six sigma professionals to identify and focus on those critical few factors, which are contributing majorly in the process. Process FMEA helps us to look where the root cause is existing. This is done by creating a detailed process map and than carrying out the Failure mode and effective analysis using brainstorming. Therefore, in Measure, Analyze and Improve phase, FMEA is majorly the result of brainstorming because there is no availability of quantitative data as such, however it is helpful in achieving the purpose of M,A & I phase. Similarly in the control phase, FMEA is essential for continuous and ongoing improvement in the processes. FMEA helps to develop the Standard Operating Procedure (SOP) which will help to control and manage the process on continuous basis. Lets understand this with an example. Suppose we are doing a DMAIC project on spot welding defect variation in one of our factory. Once we have defined the problem and brought all stakeholders in agreement, next is the Measure phase. In the measure phase as we know, we need to set the baseline performance and carry out the measurement system analysis, FMEA helps to assist in those activities. There are variety of metrics which can be used to baseline these Y's. FMEA can be helpful in identifying those critical X's which have high contribution towards Y, based on Y = f (X) + C. Lets say, in our example, by carrying out the FMEA, key X's which come out are current, voltage and welding pressure. Now, Analyze phase is used to identify the root cause of the problem. FMEA can again be helpful to identify the root cause by calculating the Risk Priority Number (RPN) of each X's and understanding which of the X's has more impact or contribution to the Y. i.e., spot welding defect. Lets say the RPN number of welding current is the root cause of the problem. Since we already identify the CTQ or little Y's in the define phase and X's in the Measure phase, Analyse phase is used to identify the root cause using the FMEA. On similar lines, Improve and Analyze phase can also be used for continuous improvement and monitoring of those critical X's which have an impact on the Welding current or Y. Thus, the overall approach of the FMEA does not change with respect to the DMAIC phase, though the focus of its use does. In totality, DMAIC is a standard Six sigma methodology which gets benefited by incorporating the FMEA as a complementary and supportive tool to facilitate the same.
-
As a Problem solver, when we are making an attempt to investigate and understand the root cause of the problem, There are several tried and tested method that are experienced across industries. One of the best technique is Fish-bone or Ishikawa analysis where we brainstorm and map various probable causes from different dimensions, experiences, horizons, facts and perspectives. While identifying the root cause, we validate each and every probable causes through several validation techniques, most successful of which is GENCHI GENBUTSU. This involves making the Gemba round for each of the probable causes, authenticate the probable causes by obtaining facts, correlating parameters, performing challenge test etc. While performing the validations, what is considered to be paramount is the fact that , the parameters (CAUSES) which we are validating should have a correlation with the problem (IMPACT), we are dealing with. Continuing this process helps us to narrow down to one or few potential cause(s). This gives us the confidence to carry out further deep down analysis through techniques such as 5 WHY etc. to narrow down to the Root cause of the problem. This process renders the confidence to have attained the root cause, as the probability of all other probable causes gets null and void based on validation with facts, data and challenge test. One of the interesting example I often refer in the training newbies is the columbia spacecraft disaster in 2003. WHY DID THIS HAPPEN ? N number of probable causes were at stake which might have resulted into one of the worst spacecraft disaster. When all the probable causes after listing down were validated and ruled out based on facts and challenge test, what was most promising and obvious in nature was related to Material, specifically the shuttle's external tank, from which a large piece of foam fell and damaged the spacecraft wing. Therefore we can say it was the ROOT CAUSE, considering the thorough analysis of remaining potential causes. Lets take another hypothetical example from the service industry. Say on a particular day, the XYZ Courier company delivered the material with 25 Minutes delay. As a team, we need to fix this problem and understand the root cause before submitting the solution. We can list multiple factors with respect to the processing time, logistics, transaction, weather condition, vehicle condition of transporter, personal mood, Service level agreement etc, etc, etc,... However to reach the root cause of the problem that is ''25 minutes delay in delivery time'', we need to validate each and every such probable cause(s) with the factual scenario which was prevalent on that particular day. Once we do that we will find, most of the causes will get eliminated based on the evident data. What we will be able to attain at the end of this exercise is very limited (No ideal number) Cause(s){Though in most cases,we get only one root cause}. Whats paramount in this entire process is to sustain the perseverance and structured approach while we are determining the root cause. We need to remember once we get the root cause, that means we have identified the demon & we need to kill it with relevant CAPA. It shouldn't and wouldn't reoccur ever in the future. Thanks!!!
-
Statistical significance between X and Y are important from data analysis point of view. However the correlation between X and Y is crucial significantly from Business consideration, we commonly refer that as Practical significance. One of the best example for this misnomer is Water purification system which are an important factor for many industries including Pharma. Chemical dosing is one of the X which impacts the Y i.e., hardness of water. However at certain level X can not be altered because of other considerations. Hence at a certain point the Changing X does not warrant a change in the Y. Above example shows that, through Hypothesis testing, even though we can conclude that changing X impacts the Y statistically , however it does not matter in lieu of the practical significance.
-
Activity based costing is extremely helpful and essential costing technique for effectuating the Top down decision making in Strategic and Operational cases. By offering an opportunities to allocate costs in direct proportion to the activities being performed it helps to develop powerful cost centers in an organisation in layered format ,,say Facilities sustaining activities,Product sustaining activities, Batch level activities and unit level activities. With above advantages these techniques are highly beneficial in industries where higher transactions are happening at different levels in direct and indirect cost components. industries like Pharma, consumer goods and automobiles are the sectors where there are huge burden on overheads reduction ,if not the elimination for cost cutting.Using ABC Techniques help to channelize and prioritize the cost centers for focus and carrying out cost related maidens. However in sectors like sales and marketing ,after sales service,it might seem complicated coz of lack if organized and structured costing modules. It becomes slightly difficult to have an organised cost centers in these sectors and hence ABC techniques might not be practical.