

Sudheer Chauhan
Lean Six Sigma Green Belt
-
Joined
-
Last visited
Everything posted by Sudheer Chauhan
-
Sudheer Chauhan replied to Vishwadeep Khatri's topic in We ask and you answer! The best answer wins!FMEA (Risk priority Number) RPN number is a numerical assessment to evaluate the risk priority level in FMEA analysis. RPN number to help in the prioritize the risk and make a corrective action to mitigation the same. How to calculate the RPN? RPN is calculated by multiplying Severity (S), Occurrence (O) and Detection (D). Score of Severity, Occurrence & Detection is given as per FMEA Index. Severity: - The severity of the failure mode is scored on a scale from 1 to 10 based on risk severity. Occurrence: -The potential of failure occurrence is scored on a scale from 1 to10. High occurrence reflects high failure occurrence potential. Detection: - The capability of failure detection is ranked on a scale from 1 to10. High detection score reflects low detection capability. How to evaluate RPN? RPN is used to prioritize high risk issues and determine the requirement of corrective action. Most of company prioritize risk from highest to the lowest RPN. Team is used RPN to reduce the key risk in two following method. FMEA RPN Threshold Many companies use an RPN limit to determine which failure mode required corrective action and which risks are acceptable. The RPN threshold is easy to use. However, using RPN threshold method may cause a team member to spend excessive time trying to reduce the Detection severity & occurrence for getting the low RPN no. This situation some time put the organization in danger. TOP RPN No. Some organizations work on top RPN risk and try to mitigate them with corrective actions. After team reset the FMEA and get other high RPN risk, It promotes the continual improvement culture. RPN disadvantage Failure Mode Severity Occurrence Detection RPN Failure Mode -1 7 4 4 112 Failure Mode -2 4 4 7 112 In above example of failure mode -1 should be provided a higher priority than failure mode-2 although they have same RPN value because of high severity Because they have same RPN value, an inappropriate action plan for critical failure may be selected for this reason RPN should not be only index used to evaluate the risk of each failure .it is big disadvantage of RPN no. How to evaluate the RPN Number effectively Along with the RPN number team should be consider the S, O & R ranking for prioritizing the risk during the team discussion. Team may combine the criteria for the RPN, Severity, Occurrence & detection ranking by using the a matrix as per below example of risk matrix a combination of severity and occurrence


-
Sudheer Chauhan replied to Vishwadeep Khatri's topic in We ask and you answer! The best answer wins!2 Sample T test 2 sample t test method is a method used to compare the means of two population. We use 2 sample t test when the data of two samples are independent and it is also called independent samples t test. Paired Sample T-Test Paired sample t test is also called dependent sample t test and it is used to determine whether the mean difference between two sets is zero. In a paired sample t test, each entity is measured twice, causing in pair of observation. Commonly uses of paired t test in case control studies or repeated -measured design for example if you want to check the effectiveness of company training program then you have to measure the performance of sample of employee before and after the program calculate the difference using a paired test. Example: - In clinical research , we usually compare the two group such as experimental and control and selection of statistical method is depend on type of data ,if data is continuous such as blood group and researcher may want to know the significant difference in mean value of two groups and if data is normally distributed then Two sample t test and paired t test are most commonly used method . When comparing the two population. It is important to analysing that data samples from the population are two independent sample or one sample relate to pair (paired samples). Independent sample can be easily identified during the data generation. If one sample does not influence the selection of other individuals in any way in this case t sample 2 test should be applied .in other hand if one sample are coupled with some other particular observation in the other sample then called a paired .it is very common in before and after comparisons and in this situation we should use paired sample t test.
-
Sudheer Chauhan replied to Vishwadeep Khatri's topic in We ask and you answer! The best answer wins!The Process Door and Data Door In DMAIC process, analysis phase is very important phase to analysis the data and there are many tools & techniques which are used for analysing data however some challenges to use right tool & techniques in right situation. Process door and data door are useful to divide the analysis phase into two section which is useful to get the actual analysis. Process Door Process door apply to a section of tools & technique that help to understand and get a clue from process directly. below tools generally use in process door 1. Process mapping technique 2. Seven wastes 3. Measles charts 4. Root cause analysis tool (brainstorming, Fishbone diagram ,5 whys) 5. FMEA Data Door Data door apply to a section of tools & technique that help to understand process from the data itself and below tools generally use in Data door 1. Graphical Analysis tool (Histograms, run chart, Box chart, Scatter Plots, Dot plots) 2. Statistical Analysis tool (Confidence interval, hypothesis testing, corelation & recreation, Normality testing)
-
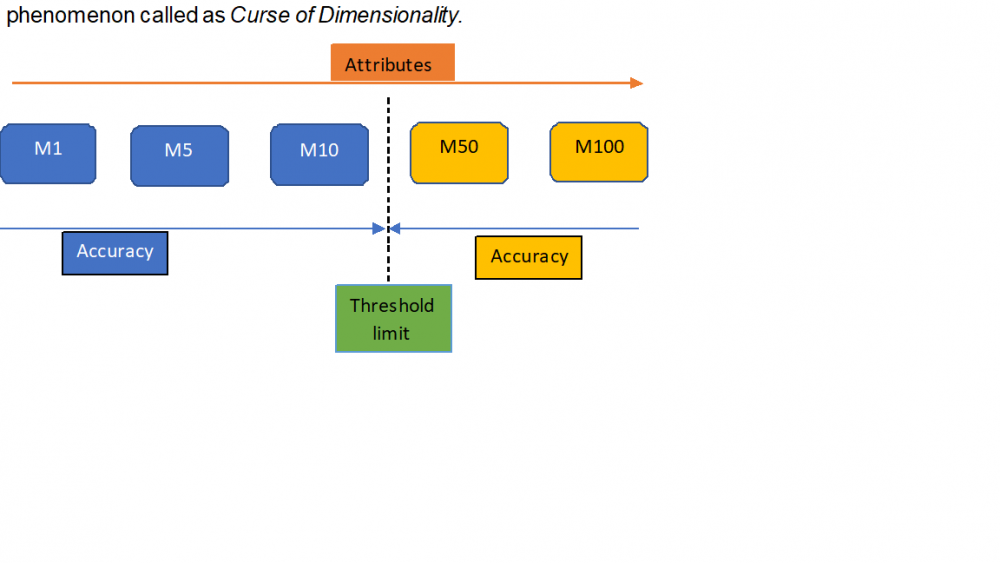
Sudheer Chauhan replied to Vishwadeep Khatri's topic in We ask and you answer! The best answer wins!Curse of Dimensionality: - The term “Curse of dimensionality” used by famous mathematician R. Bellmen in his book Dynamic Programming in 1957. Curse of dimensionality is a problem occur due to adding extra dimensions or attribute in a model. Meaning of Curse of dimensionality is that error increases with increasing the number of features or attributes. Generally, accuracy of any algorithm increases with increase in the number of features or attributes however it is true till threshold limit, after threshold limit algorithm accuracy decreases with increasing the extra number of features or attributes. Fact behind that algorithms are difficult to design in high dimensions and have a running time exponential in the dimensional .A high number of dimensions or features allow more information to be store but practically it does not help and give more noise and redundancy in real. Collection of huge data may give dimensionality issue such as high noise. Some features do not give a significant information only create the confusion in the system and increases data. Blow difficulties found during analysing of high dimension data results · High -dimensional space have a geometrical property which are different the properties of 2-3-dimensional space. · Data analysis tool design as per mind strength and these tools are best work in 2- 3 dimensional space Domains of curse of dimensionality § Anomaly Detection Anomaly is a high dimensional data which have significant attributes irrelevant to nature given large search space. § Combinatorics Curse of dimensionality occurs when the complexity increases fast. It is caused to increase the combinations of inputs. § Machine Learnings Enough data is important to success development of learning algorithms. As increase the dimensionality in the data result in the more sparser of the data. This effect is called the COD. Prevent the COD § Dimensionality reduction use for changing the high dimensional variable to lower dimensional variable without changing the information. It is often use to reduce the COD effect. § Regulation: - the problem comes throughout the estimate of unstable parameters hence we can regulate these estimates will protect COD. § PCA (Principal Component Analysis) is traditional tool used for converting high dimension to low dimension reduction. It changes the date into additional informative space so that use of low dimension and prevent the Curse of dimensionality. Example: - If 5 algorithm generated as M1, M5, M10, M50 & M100 having the attribute of 1,5,10,50 & 100 and if the accuracy threshold limit is up to10 attribute then accuracy increases when increase the attributes from 1 to 10 however when attribute increases from 11 or more then accuracy will decrease because more attributes increase more confusion and lead to inaccuracy this phenomenon called as Curse of Dimensionality.
-
Sudheer Chauhan replied to Vishwadeep Khatri's topic in We ask and you answer! The best answer wins!Block Diagram: Block diagram use to represent process flow diagram, electronic Design, Software design and hardware design, in block diagram main function of process or part are represented with blocks and connected with lines. It uses to make customer or high-level audience understand about the process or drawing with less detail.it is give a quick view of a system to identify the interest or trouble spots. Block diagram give a broad idea of process and not give a minor detail like each pipeline & pumps

-
Sudheer Chauhan replied to Vishwadeep Khatri's topic in We ask and you answer! The best answer wins!Holy Trinity of Project Management Basically, Holy trinity is a ratio of Time, Cost (budget) and Scope of project. In business literature it is called triple constrains. This ratio is important to deliver the successful project – “what is required, within the budget and on time” Project manager can take a decision based on this ratio that project is viable as per customer requirement within the given condition or not. As geometric representation of trinity if we change length of any one then it will impact at least one of other side of tringle

- 7 replies
-
- time
- scope
- holytrinity
- projectmanagement
-
Tagged with:
-
Sudheer Chauhan replied to Vishwadeep Khatri's topic in We ask and you answer! The best answer wins!Overall equipment efficiency OEE is the best tool to measuring manufacturing productivity. In simple words it represents the percentage of manufacturing time that is actual productive. Measuring OEE is good practice in industries. We get important insight on how to improve our manufacturing process. OEE is a best matrix for identifying losses benchmarking progress and improving the productivity of manufacturing equipment. Main part of OEE calculation are availability of equipment, Performance of equipment quality of product. OEE = Availability Score × Performance Score × Quality Score 6 Big Losses in OEE: - 6 Big Losses in OEE Overall Equipment Efficiency Recommended Six Big Loses Traditional Six Big Losses Availability Loss 1 Unplanned Stops Equipment Failure 2 Planned Stops Setup and Adjustments Performance Loss 3 Small Stops Idling and Minor stops 4 Slow Cycles Reduced speed Quality loss 5 Production Rejects Process Defects 6 Startup Rejects Reduced Yield The six big losses are directly linked to discrete manufacturing and provided an equipment loss in more detail. Six big loses are derived from TPM. Unplanned Stops: Unplanned stops are a time period in which equipment is scheduled for production, but it is not running due to unplanned activity. Examples -Equipment breakdown, unplanned maintenance, tool failure, lack of operator or materials. Planned Stops: Planned stops are a time period in which equipment is scheduled for production but not running due to planned activity for example -cleaning, Planned maintenance, product changeover, quality inspection. Small Stops: When equipment stops for a small time such as 1 or 2 minutes with the stop resolved by the operator. Small stops are often long-lasting. Example include misfeed, material jam, incorrect setting, blocked sensor, periodic quick cleaning. Slow Cycle: Slow cycle time happen when machine run slower then rated cycle time for example dirty equipment, poor lubrication, poor environmental condition, operator experience, start up and shut down. Slow Production Defects: Production defects are defective products produced during the production (stable production). It includes all product which required reworked for example Include correct equipment setting, operator & equipment handling error, or lot expiration. 6. Start Up Defects: Startup defects are defects which produces at the time of startup of equipment. It can happen after any equipment startup. Generally, it can see after change over for example includes suboptimal change over , Warm up time of equipment
-
Sudheer Chauhan replied to Vishwadeep Khatri's topic in We ask and you answer! The best answer wins!Quantile Regression: - Linear regression evaluates the mean response of the dependent variable dependent on the independent variables. There are many cases where data is skewed and have outliers when mean do not show the complete pattern of data. Quantile Regression is good alternative of linear regression in the case of skewed data. We can study of distributional relations of variables, heteroscedasticity, dealing with censored variables. We can use Quantile regression to analyze to Major League Base ball salary data at 10%,25%,50%,75% and 90% quantiles. In (Salary) = β°+ β1AtBats+ β2Hits+ β3HmRun+ β4 Walk+ β5Year+ β6Putout Example of using the Quantile regression 1. Health care services during the expenditure analysis 2. Ranking Exam Performance 3. Financial Risk management 4. Prediction close rates of retail store Summary: - 1. Approach of Quantile Regression modeling is multipurpose. It uses linear model to conditional quantiles of the response without considering of parametric distribution. 2. Quantile process regression evaluates the complete conditional distribution of the response allows the shape of the distribution to depend on the predictor. 3. Quantile Regression can predict the quantile levels of observations with adjusting for the effect of the covariates.
-
Sudheer Chauhan replied to Vishwadeep Khatri's topic in We ask and you answer! The best answer wins!Bullwhip Effect Every supply chain has a distribution chain from retailer to manufacture. Goods move from raw materials suppliers to retailer for meeting the customer demand in the distribution chain. Continuous flow of product is important and play a vital role in growing the business in competitive era where many alternative products are available in the market and customer has many choices. Bullwhip effect in supply chain occurs when order of more goods or product than actual demand. The Bullwhip effect follows up in the supply chain its start from retailer, wholesaler, distributer, Manufacture and raw material supplier. It is found those company in which demands of product depends on forecasting rather than actual consumer demand. Examples: A retailer store 70 pack of one soap brand in stock. If it is normally sells 20 packs per day, it would order to distributer for this quantity. But one day retailer sells 50 packs and assume increase the customer demand of product and order for 70pack to distributer to meet the higher forecasted customer demand In same pattern distributer also assume that product demand will increase in future and distributer order 140 packs of same soap brand to the manufacture and manufacture produce 240 packs to be safe side, at the product demand increased from 50 pack at the customer level to 240 pack at the manufacture. This phenomenon called the bullwhip effect. Customer demand (Unit) Retailer demand (Unit) Distributer demand (Unit) Manufacturer manufacturing (unit) Raw material inventory increased for (unit) 50 70 140 240 300 Impact of Bullwhip effect on supply chain Bullwhip impact is always costly for business. It is very difficult and costly to maintain excessive inventory. It increases a waste in the system. Excessive or lack of inventory both situations can generate due to bullwhip impact and both situations are not favorable to the company. Over inventory is costly if customer demand decrease .it may be results to waste resources & raw material, in other hand low inventory lead to not fulfillment the customer demand and sale loss. These mistakes impacted the reputation & profit of organization. Some time Quality of product affected in manufacturing a large volume with limited resources Cause of Bullwhip effect: - Some main causes of the Bullwhip effect are below Order Batching Some time retailer or distributer round off the demand numbers in increasing pattern as per production or transportation feasibility. It is one of the causes for bullwhip effects Price fluctuations Cost changing, or some special discount may affect the buying pattern some time, all customers want to take the advantage of discounts which results irregular production Demand information It is necessary to trust on past demand to estimate the current or future demand. We should not take a sudden fluctuation in the account to estimate the future demand. Lack of Communication Lack of the communication between each link of supply chain is one of the reason of bullwhip effect for example if manger take the product demand differently with different sources and supply different quantity Free Return Policy Free return policy some time become a cause of Bullwhip effect because customer give the extra demand and cancel it later without and penalty and for fulfill the customer demand retailer give the extra demand and cancel it later resulting it excess materials. Apart above caused we can also divide the on major two part 1. Behavioral cause and 2. Operational Cause Behavioral cause 1. Misuse of stock policy 2. Misperception of feedback 3. Panic for ordering Operational Cause Error in forecasting Lead time variability Lot sizing Forward buying Anticipation of shortage Minimize the Bullwhip effect a. Improve communication and better forecasting We can minimize the bullwhip effect through better information and better forecasting. Improved communication accurse the distribution chain can reduce the effect. b. Eliminate Delays Eliminate delay is another way to reduce the Bullwhip effect, if we can cut the time of delivery from manufacturer to customer then it will give the confidence to customer or retailer and they would not increase the order due to fear of shortfall. As per one study if we can cut the order to delivery time by half then we can cut the supply chain fluctuation by 80%. Lean manufacturing plays a very important role in reducing of manufacturing time of product. we can use below tools and techniques to reduce the lead time or cycle time in all distribution chain 1. SMED (Single Minutes exchange of Die)- Reducing the change over time in the manufacturing. 2. Optimize the number of raw materials- If we optimize the number of raw materials in the series of product then it will make the process flexible and reduce the change over time and inventory 3. Switch the continuous manufacturing from batch manufacturing: - Supply as per demand is a new concept of supply chain .in continuous manufacturing factories are free to make any quantity as per order and not bound with batch size. 4. Use Just in time: - Implement JIT in the manufacturing and distribution chain too 5. Make VMP of end to end distribution chain: - We should make a VMP of the process to find out at where we should work for reducing the total lead time and should take a project on those problems
-
Sudheer Chauhan replied to Vishwadeep Khatri's topic in We ask and you answer! The best answer wins!Fast tracking and Crashing techniques are used in the project management and both techniques have equal importance in the managing of project schedule as per applicability and situations. Fast Tracking: - In this technique project manger perform the project activities parallel instead of series and try to achieve the project timeline. Some risks are involved in the fast-tracking technique because parallel activities might be increased the reworking some time and increase the time. Extra precautions are required when use this technique by the project manager. It is very important to perform the critical path exercise before use this technique. We should use this technique for all activities which are on critical path. Example – A project of installation the new production line. we can do some electrical & carpentry work parallel Crashing: - Crashing is also a technique which use for meeting the deadline of project. This technique is based on increase the resources to complete the work earlier or on time. Project cost increases in this technique due to more resources. we should evaluate the end to end project cost before use this technique. All activities which are shortlisted for doing earlier by extra resources must be on critical path. So detailed analysis of project critical path is required before implementation. Some time project manager needs to take an approval of senior authorities. We also need to evaluate the project cost with extra cost Vs project benefits. Example: - we are installing a producing line and 20 workers can complete the work in 30 days, if we want complete this work in 15 work then we have to increase the worker for same work. We should use Fast Tracking technique first to meet the deadline of project, crashing technique is less preferable until it is a very high profitable project or other significant impact more than cost on business like – Regulatory, brand image, company reputation etc. Conclusion Fast Tracking Crashing Always try first Try when Fast tracking is not able to give results Perform parallel activities to meet the project time line More resources use to complete the activities at time Risk of reworking involve Increases cost due to extra resources Use when parallel activities give the benefit in respect of reduce the time Use when extra resources give the benefit in respect of reduce the time Always apply on critical path activities Always apply on critical path activities
-
Sudheer Chauhan replied to Vishwadeep Khatri's topic in We ask and you answer! The best answer wins!Six Strategies for Fraud Prevention in Your Business Fraud is significantly problem faced by all type of organization. All organization would like to believe that employees are loyal and working for the benefit of the organization (most of them do) Although there are many reasons why employee do fraud. Research shows that the typical organization loses 5% of its annual revenue each year due to fraud. Prevention and detection are important to reducing the loss. Every organization should have a plan in place as preventing fraud is much easier than recovering your losses after fraud has been committed Type of business fraud There are many types of frauds. Majorly we can categorize it into three categories 1. Asset misappropriation, corruption and financial statement fraud. Asset misappropriation is comment and found in 90% cases as per studies. In this scheme employee steals or exploits its organization resources, Example – misappropriation is stealing before and after it has been recorded, making false expense reimbursements, taking non-case assets of the organization Financial statement fraud is less than 5% of case in total fraud. In which involve omitting misstating information in company financial report .it may be fictitious revenue, hidden liabilities. Corruption is in the middle and it is happened in one third of cases, Corruption is happened when employee use this influence in business, transition of there benefits by violation the rules and duties, corruptions are bribery, extortion and conflict of interest Fraud prevention Every organization must have fraud prevention plan in place .it is no matter it is a large or small organization. A study of fraud cases in the ACFE 2014, report says that the fraudulent activities studied lasted an average of 18 month before being detected. There are ways by which we can we can control or detected the frauds in the business 1. Know Your employee: - Frauds committers often display by behavior traits. Observing and listening to employee helps to identify the potential fraud risk. Organization must involve with their employees and take time to know them for this we can change the attitude the employees. We should talk with the employee and resolve the internal issue like – if they feel lack of appreciation. It may no only reduce the fraud but make the organization better. 2. Make Employee aware and setup Reporting system:- Organization must make aware to their employee. every employee must aware about the organizational Fraud risk policy including type of frauds and consequences associated with them. 3. Implement Internal Control: - Organization must implement the internal controls to safeguard the company assists and ensure the integrity of financial record and prevent the frauds. separation the duties is one type of internal control .it may be reducing the risk of fraud. for example -A retail store has on cash register employee. The cash and check register receipts should be checked by one employee while other prepare the deposit slips and third should deposit inti the bank. 4. Monitor Vacation balances: - Manager might be impressed with the employee who have not missed a day and have 100%attendence. This thing may like a loyal employee however it may be a sign that this person has something to hide and he worried that someone will detect their fraud if he was out of office for some time it is good idea to rotate the employees to many jobs with in the company. we can allow to second person to review the activities of first. 5.Hire Expert: - Certified Fraud Examiners (CFE), who are Certified in Financial Forensics (CFF) can help organization in establishing antifraud policies and procedures. They can provide a wide range of services from complete internal control audits and forensic analysis to general and basic consultations 6. Live the corporate culture: - Organization must build a positive work environment it can help to prevent to the fraud and theft. There should be a clear organization structure, written procedure & policies. Open door polices do also prevention of fraud. Fraud Detection In addition to prevention strategy. organization must have the detection mechanism in place and it should be visual to employee. It is important to continuously monitor and update your fraud detection strategy and ensure they are effective. These plans take external information and consider linking with internal data. The results of your fraud detection plans improve your prevention controls. It is imperative to document one's fraud detection strategies including the individuals and/or teams responsible for each task. Once the final fraud detection plan finalized, It should be communicate to all employees how it will be implemented.
-
Sudheer Chauhan replied to Vishwadeep Khatri's topic in We ask and you answer! The best answer wins!Stop The line Philosophy: - Toyota motor corporation’s vehicle production system discovered the thing which are referred in Lean Manufacturing system or “Just In Time” system. Currently these principals are being studying in worldwide. Toyota production system was established based on the many years experience of continuous improvement with the objective of making the vehicles ordered by the customers in fast and efficient ways. This system (TPS) was based on the two concepts 1. Jidoka (Automation with a human touch): - When problem come or identify, the equipment or line stops immediately to prevent the defects.it is pillar of TPS and lean manufacturing .it is one of the most important principles of lean that can help to achieve an excellence. It is also related to product or service quality.no company can survive without excellent quality and Jidoka is the root by which we can achieved. 2. Just in Time: - In this concept each process produces only what is required for the next process. It is a production model in which product are manufactured to meet the demand not created in surplus or in advance of need. The purpose of JIT production is to avoid the waste associated with overproducing Based on two above philosophy, TPS is manufacturing the efficiently & quickly produce vehicle of sound quality, On the time and complies with customer requirements. TPS and its approach helps to reduce the cost and provide the competitive strength of Toyota. Stop line and correct immediately concept: - As per TPS, Machine or line must stop safe whenever an abnormality occurs or identify. Generally, two types of system present in the company one is manual and second is automated Operator can stop the machine or line if he observed the abnormal in machine in manual process and safety programing and logarithm stops machine if found any abnormality in machine in automated system. It follows the theory that to have the best quality for product and opportunity to continuous improvement. We must stop production line when issue occurs and fix the issue before resuming work Benefits of Stop line concept: - Significant benefits we can achieved by stop line and correct immediately concept are reduce the wastages. Along with reduction the waste it can also give the benefit in reduction of consumer complaints due to poor quality, increase the Brand Value, increase sale and help in customer delight. Waste Benefit from Stop Line Defects or reworking No reworking -defects will not generate Waiting time Reduce the waiting time between the two steps of process (reduce the defect, no waiting time due to no defective WIP) Inventory No inventory of defective product or WIP, we can optimize our RM Inventory basis of Zero defective product 100% conversion from RM to FG Over Processing No extra Processing because no defective product produce (some time we need to produce more product to meet the market requirement if we produce the defective product) Motion No people motion because of No extra documentation and approval for reworking and dispose of defective product- Transportation No extra transportation in the factory to arrange the defective product from production line to warehouse and segregation from good product How we can reduce the incidents of Line Stop: - It is defiantly a production loss to stop the line and correct very frequently, one side it gives a several benefit to reduce the wastages and improve product quality, when manufacturing process stops unplanned it accumulates breakdown, so we should also work in reduction of frequent line stoppage also Total Productive Maintenance (TPM) is a best system to reduce the frequently line stoppage The below eight pillars of TPM. It is focused on proactive and preventive techniques for improving equipment reliability: Automation Maintenance Focused Improvement Planned Maintenance Quality Management Early/equipment Management Education and training Administrative & Office TPM Safety Health Environment condition With the help of these pillars, we can increase productivity and reduce the number of line stoppage
-
Sudheer Chauhan replied to Vishwadeep Khatri's topic in We ask and you answer! The best answer wins!Brainstorming: - Brainstorming is technique for generating the idea to solve a problem. Generally, group involves in this technique and thinks under the facilitator, in other word we can say it is group creativity technique. The strength of this technique is that people can think more freely and suggest many spontaneously new ideas. All ideas are noted downed and evaluated post brainstorming session. We must follow below steps during the brainstorming Set a time Focus on problem statements Do not criticism Encourage weird and wacky idea Aim for quantity – sorting of idea will do later Build on other idea Stay Visual Allow one conversation at a one time We can also follow below listed steps to get more ideas from individuals Circulate the topic at least one day before from meeting for preparation Mandate to write ideas before joining the meeting Do individual round before making a group or start group thinking Change group members if we have more than one topic
-
Sudheer Chauhan replied to Vishwadeep Khatri's topic in We ask and you answer! The best answer wins!Nash Equilibrium: - Nash equilibrium was invented by John Nash an American mathematician. It is a very important concept of game theory. Nash Equilibrium is a decision-making theorem in game theory by which a player can achieve the desired outcome without not disturbing or change in their initial strategy. In Nash equilibrium, each player wins because each player gets their desired outcome. Nash Equilibrium provides a solution concept in a noncooperative game. This theory is used in economics and other disciplines. John Nash got Nobel prize for this work.
-
Sudheer Chauhan replied to Vishwadeep Khatri's topic in We ask and you answer! The best answer wins!Median: - Median is a measure of central tendency. We need to arrange the data in order from smallest to largest value for calculating the median, if it is odd number of data then middle value of data would be a median and if there is an even number of data then median is the average of the two middle values. We use the median for measuring the central tendency if data have outliers. For example – if we have data set of (3,13,2,34,11,26,47) and we need to calculate the median then we arrange the data sent from smallest to largest value –(2,3,11,13,26,34,47) . it is an odd number of data set hence middle value of data 13 is a median of this data set. If we have even number of data set like – (2,3,11,13,17,26,34,47) then median is average of two middle of 2 value (13+17)/2= 15 Uses of Median as a central tendency: Type of data Best measure of center tendency Ordinal data Median Interval /ratio data (skewed) Median We use median as a central tendency in service sector like customer feedback (ordinal data), NPS (ordinal data), customer age group visited in malls, height of visitor in water park. we use median where data is ordinal or skewed
-
Sudheer Chauhan replied to Vishwadeep Khatri's topic in We ask and you answer! The best answer wins!Gage R&R (Gage Repeatability and Reproducibility):- Measurement System Analysis (MSA) is an important part of Measure Phase in DMAIC. We must confirm Resolution, Accuracy, Precision and stability of measuring devises before use them in measurement for generating data. Basically, we can classify the error of measurement system in three main categories 1. Accuracy, 2. Precision and 3. Stability Resolution - help use in selection the gage as per our process requirements (Part size , specification, standard deviation) 1. Accuracy: - Accuracy is difference between measured value and actual value of Part that measured. Main component of accuracy measurement is a. Bias: It is difference between true value and measured value of part. some time we do not have actual true value of part then we can take the average of several measurements with the most accurate measuring equipment. b. Linearity: - It is about how part size affects in the bias of measurement system. We should calculate the bias value of all expected range of part size according over process. some time it is proportional or inverse proportional to part size. 2. Precision: - It is about the variation in the measurement. When we measure the same part many times with same devices then the below listed variation occur. c. Repeatability: When same operator measures the same part many times with same measuring device then it is called the repeatability. It is a variation due to measuring device. d. Reproducibility: - It is about the variation between the operators. If same part measures by more then one operator with same measuring device called reproducibility. 3.Stability: - Stability is about how accuracy and precision of the system perform over a time. Right order of 5 things during performing Gage R&R as below 1. Resolution 2. Bias 3. Linearity 4. Precision 5. Stability We can calculate them with the help of minitab
-
Sudheer Chauhan replied to Vishwadeep Khatri's topic in We ask and you answer! The best answer wins!Will Rogers Phenomenon In 1930, Okies left Oklahoma and moved to California during the economic crises in America and raised the average intelligence level in both states. Alvan Feinstein gave it the name “Will Roger Phenomenon” in 1985. Will Roger Phenomenon is related to stage migration. It is found when an element moves from one set to another set and increase the average value of both sets The effect will happen when both below conditions are met Below average element should move from current set. as definition, it will improve the average of remaining elements. If set is (5,6,7,8,9) and average of this set is 7 now if we moved 5 from this set then new set will be (6,7,8,9) and new average would be 7.5 i.e. improved average of set. Entering element should be above the current average, it will improve the over all average of remaining elements. ex. if another set is (1,2,3,4) and average of this set is 2.5. 5 is above the current average of group and if 5 will enter in this group then new set will be (1,2,3,4,5,) and new average of this set is 3 i.e improved average of set. It is commonly used in the Hospitals (Radiology and Diagnostic etc), Banking and Life insurance business. It is more related to classification or categorization of patient and customer. In hospitals if we have to categories 1. List of healthy people and other 2. List of sick people and due to advancement of medical science of early diagnosis we should move the patient from list -1 to list 2 post early diagnosed. It will improve the average life span due to disease in both (lists) sets.
-
Sudheer Chauhan replied to Vishwadeep Khatri's topic in We ask and you answer! The best answer wins!Net present Value (NPV):- NPV is a difference between the present value of cash inflow and the present value of cash outflow after a period. To calculate the NPV we should know time period of project and discount rate (required rate of return).it is very useful to check profitability of particular project. Some time we use NPV to compare more then one project and find out best among them. It helps us to take a decision either we should do the investment or not. NPV is positive Investment will give benefit to company We should do the project NPV is negative Investment will give negative impact/loss to company We should not do the project NPV = 0 Nether gain nor lose No Profit – We should not do the Project or consider other factors Limitation of NVP: - NPV depends on discount rate. NPV method is difficult to apply when comparing a project that have different investment and different time period. Formula for NPV :- NPV = CF0 + CF1/(1+r)1 + CF2/(1+r)2................ CFT/(1+r)T Where CFT=Cash flow at the time of T and r = discount rate or company required rate of return Internal Rate of Return (IRR):- Internal Rate of return (IRR) is equal to discount rate in which net present value (NPV) of project is zero.in other word we can say that IRR is compound rate of interest which can be made on investment. We use IRR to find out the right project or good investment. It is used when a company wants investment in new projects. IRR is also used in the comparison of many project and find out profitable project like NPV. IRR>company required rate of return Investment will give benefit to company We should do the project IRR<company required rate of return Investment will give negative impact/loss to company We should not do the project Formula for IRR IRR = lower discount rate + (NPV at lower % rate / distance between 2 NPV) × (Higher % rate - Lower % rate) Limitation of IRR – Disadvantage to use IRR instead of NPV .it is very significant risk in companies where the return on investment is greater than the weighted average Cost of capital(WACC) that company will not invest in projects expected to earn greater than WACC, But less than the return of existing cost IRR is true project’s annual return of investment only when project does not generate interim cash flows. Return of investment (ROI):- ROI is most common and popular technique to used for measuring the amount of return on an investment. To calculate the ROI, the Net profit is divided by cost of investment. The result is come in % and ratio. In other word we can say it s a ratio of net profit and costs of investament.it is a very simply financial matrix to evaluate the efficiency of investment. ROI is used for personal financial decision, compare company profitability, and compare the efficiency of different investment Limitation of ROI – Satisfactory definition of profit and investment are difficult to find Formula for ROI:- ROI%= (Net profit /Costs of investment) * 100
-
Sudheer Chauhan replied to Vishwadeep Khatri's topic in We ask and you answer! The best answer wins!Fourth Industrial Revolution (Industry 4.0) is related to digital revolution or digital transformation. Technology fusion has almost remove the bounders between physical, biological and digital fields. We are using artificial intelligence, robotic ,3D printing and connection of machine with internet in almost all areas .these are using in many field which are related to humane life and has made significant changes. Main components of Industry 4.0 are -mobile devices, smart sensor, Internet of things, big data analysts and advanced algorithm, location detection technologies etc.

