Ram Rajagopalan
Lean Six Sigma Black Belt
-
Joined
-
Last visited
-
Hi, To me a Business Transformation starts with a larger scope. Its origin could be a new line of business or service, or improving business metric (profit, throughput). It starts with creating a POV /Thought leadership on why it's needed, creating a sense of urgency and commitment. Post that various methodologies start including Design Thinking or DMADV or Process Mining etc. The outcome creates a roadmap, business case etc needing digital technologies, project management and value realization, change management, communication, organization design etc. I haven't seen Lean included, as it's usually larger, but I could be wrong.
-
Ram Rajagopalan replied to Vishwadeep Khatri's topic in We ask and you answer! The best answer wins!CONWIP is a hybrid push-pull system. CONWIP controls the WIP in the system. It extends the Kanban approach but simplieifes the execution, providing more flexibility Simpler than Kanban in the number of cards used Have been shown to have lower WIP than Kanban The picture below explains the comparison of Kanban and ConWIP In certain cases Kanban has proven better than ConWIP. Kanban has an additional advantage in that it automatically manages the production sequence. Based on the product mix kanbans, the system can figure out the next ones. However in ConWIP, human input is required to manage the sequence and priority, which may lead to excess/ shortage of inventory. This could lead to the Bull Whip effect. Another factor to be considered is the product type, whether it’s few product with large volumes or large number of special type of products (made to order). ConWIP has shown the handle this better. separate sorting of the backlog and matching the backlog with the CONWIP cards References: https://www.researchgate.net/figure/Simple-CONWIP-system_fig1_301741360 https://www.allaboutlean.com/conwip-comparison/
-
Ram Rajagopalan replied to Vishwadeep Khatri's topic in We ask and you answer! The best answer wins!TRIZ - short form for Theory of the Resolution of Invention- related tasks, was developed by Soviet inventors, by analyzing patterns in invention using global patent literature. The primary insights were There were repetition of problems and solutions across industries and sciences. There were evolution of patterns across industries and sciences And there was cross pollination of innovations from outside the field in which they were developed. What this led to is a suite of methodologies, tool sets , models etc for problem solving. TRIZ was evolved by mapping contradictions that were resolved by the invention and the way it was achieved. It was observed that in most cases improvement of one dimension leads to deterioration in another. Some examples include In India government looked at ramping up testing without huge costs due to imported swabs- by repurposing cotton bud capacity for polyester swabs. Reliance provided raw material from its petrochemical expertise and J&J provided scientific expertise from Personal Hygiene. An imported swab costs Rs 20-30 while local was around Rs1-2 Retailers are looking at allowing more shoppers in store but have to ensure social distancing norms - increasing usage of store videos to create analytics that help stores to know the number of shoppers, any congestions Similarly Manufacturing has used Optical images to significantly improve testing while reducing cost We have seen significant cross polination of "uberification" type of invention across industries - Uber for available cars from rentals, Airbnb on available homes for rentals, OYO on hotels etc- all scaling up without asset additions Intel has looked at constantly improving the speed of the chips while shrinking the size The patterns of cost vs speed, accuracy vs speed etc repeat across industries. Technology has played a major role in many of those situations. Several leading companies GE use this technique. TRIZ reduces the problem to a general one that has been faced before, provides alternatives that can be used . Usual steps involve Defining the contradiction -> Defining the dimension / metric for improvement & metric for potential deterioration -> Map to TRIZ matrix -> Evaluate proposed principles -> Filter those that are relevant -> Convert the best principle to specific solution References https://www.managementstudyguide.com/triz-matrix.htm https://en.wikipedia.org/wiki/TRIZ
-
Ram Rajagopalan replied to Vishwadeep Khatri's topic in We ask and you answer! The best answer wins!Reporting bias, is basically introducing bias in the way a subject is reported. This could be under reporting or selectively revealing things. Reporting bias occurs when the dissemination of research findings is influenced by the nature and direction of the results, for instance in systematic reviews. In daily life, a classic example is in News reporting. The same news event can be projected in either ways (positive or negative is also depending on the bias of the viewer) by channels that are typically branded right or left. Depending on the nature of the event, it becomes a glass half full or glass half empty. For example, in the current Covid situation, while one set might focus on controlled spread, the other set minimizes that coverage and focused more on economic fallout. Also there is a time bias. Almost always negative news are reported faster than positive news. Bias also seeps in language, location, skin color etc. Statistics is another key area. Classic one is "correlation doesn’t mean causality", yet a lot of reporting happens on correlating something to imply something. 4 out of 5 dentists recommend this product - could effectively mean only a sample of 5 and 4 reported positive. Selectively projecting numbers is a classic case that happens everywhere - financial reporting, operational reporting etc. One way to minimize reporting bias, is to pool results from similar but disparate sources. Its necessary to get pieces of corroboration from multiple sources. Some Reference sites The website https://catalogofbias.org/ provides a catalogue of bias in health services Media bias https://www.washingtontimes.com/news/2016/nov/8/mainstream-media-maligned-10-examples-blatant-bias/ Cognitive bias https://www.businessinsider.com/cognitive-biases-2015-10#the-affect-heuristic-describes-how-humans-sometimes-make-decisions-based-on-emotion-1
-
Ram Rajagopalan replied to Vishwadeep Khatri's topic in We ask and you answer! The best answer wins!Monte Carlo is a Decision Science approach that helps in improved decision making under uncertainty. It helps in seeing all possible scenarios, outcomes and helps in accessing the Risk. The technique was first used by scientists working on the atom bomb; it was named for Monte Carlo, the Monaco resort town renowned for its casinos. Since its introduction in World War II, Monte Carlo simulation has been used to model a variety of physical and conceptual systems. Risk is there in any and every part of our lives. There is always uncertainty, ambiguity and variability that makes it difficult to predict future, even with more information available today. For agriculture - every season the farmers have to make calculated risks on the crops they need to sow. And the risks they face are below, many that are not even remotely under his control There will be adequate monsoons for the water required for the crops Input prices for fertilizers don’t shoot up too much as they are dependent on global oil markets Pest attacks this season will be reasonable Overall crop harvests will be near demand, so that the prices will be under control Government doesn’t ban exports and block sales avenues Monte Carlo simulations provides the decision makers with a range of possible outcomes and probabilities they will occur for any choice of action. Monte Carlo is applicable in a wide range of industries and functions Project Management - Every task involved has a inherent risk of completion ahead or behind schedule. The duration for each task follows a probabilistic model, and hence a sequence of tasks will have cumulative effects Manufacturing - A flow manufacturing is a sequence of events/ activities for a job to be completed. Uncertainties include availability of raw materials, machine breakdowns etc. Stock Market - Probably one of the largest applications of Monte Carlo Simulations, the whole underlying aspect of stocks is that over a period of years it grows and its only due to the underlying uncertainties. Energy - Power consumption could be dependent on the weather conditions Insurance - Car premiums always factor in the risk components based on vehicle, the profile of the driver, the city of residence, type of use (commercial/ personal) etc. The underlying concept uses randomness to solve problems that look deterministic. The approach is State the target variable (Project Completion Time, Energy Consumption at a particular date etc) List the underlying input variables Model the input variables using probability distribution. This is done using historical data Model the Target variable as a function of the input variables Repeat multiple time Calculate the Target variable using Deterministic values of the inputs Aggregate multiple times The results are computed over repeated sampling and statistical analysis. Monte Carlo Simulations can take thousands and maybe ten thousands of iterations to produce results. Sawilowsky lists the characteristics of a high-quality Monte Carlo simulation the (pseudo-random) number generator has certain characteristics (e.g. a long "period" before the sequence repeats) the (pseudo-random) number generator produces values that pass tests for randomness there are enough samples to ensure accurate results the proper sampling technique is used the algorithm used is valid for what is being modeled it simulates the phenomenon in question. Advantages of Monte Carlo Simulation over traditional What If Analysis include Flexbile, considers wide range of parameters and outcomes, reduces uncertainty Ability to model outcome with its probabilities Scenario modeling, sensitivity analysis Visual descriptions Correlation of input variables The limitations of the model, are more due to the nature of the problem/ the domain its used Extending randomness - In real time many are time bound, like life expectancy etc, while probability models don’t have those Incorporating reality: Since the models are done using underlying distributions, it may predict numbers that are not realistic like interest rates in certain geos (like US which is almost 0). Brining reality into model is a tough task Use errors on the model, parameters and distributions Reference https://en.wikipedia.org/wiki/Monte_Carlo_method https://www.advisorperspectives.com/articles/2014/08/26/the-power-and-limitations-of-monte-carlo-simulations https://www.palisade.com/risk/monte_carlo_simulation.asp
-
Ram Rajagopalan replied to Vishwadeep Khatri's topic in We ask and you answer! The best answer wins!Elevator pitch is a short prepared speech that succinctly explains what you want to convey, when time is short. It is brief and persuasive to effectively generate interest in the target audience. It is often used to create interest on a project, idea, kind of foot into the door. It is most often associated with sales, with a salesman wanting to generate interest with a client - business or consumer. Often key executives are always short on time and inbetween meetings. Elevator pitches are key for making the best use of any opening you get with such executives. It is applicable in interviews, where as they say the first impression is the best impression. The first pitch should interest the interviewers to continue conversation that ultimately leads to the job offer. Elevator pitch needs to be prepared carefully and tested a few time with known people. First you need to be clear on the purpose and what you want to sell. Then you start articulating it with what you do, your usp and how. You always end it with a "Call to Action" (like ask for anything on how client's current activities are, or ask for a followup meeting etc). Be prepared to counter/ respond to any key questions from your clients. Elevator pitch is not just about the speech. It’s a package of how you are dressed up, body language, gauging the mood of the recepeint etc. It takes a lot of practice to make it perfect. But the key thing is that, as you move up, you find that a lot of times, you get to meet Senior Execs and need to make an immediate impact.
-
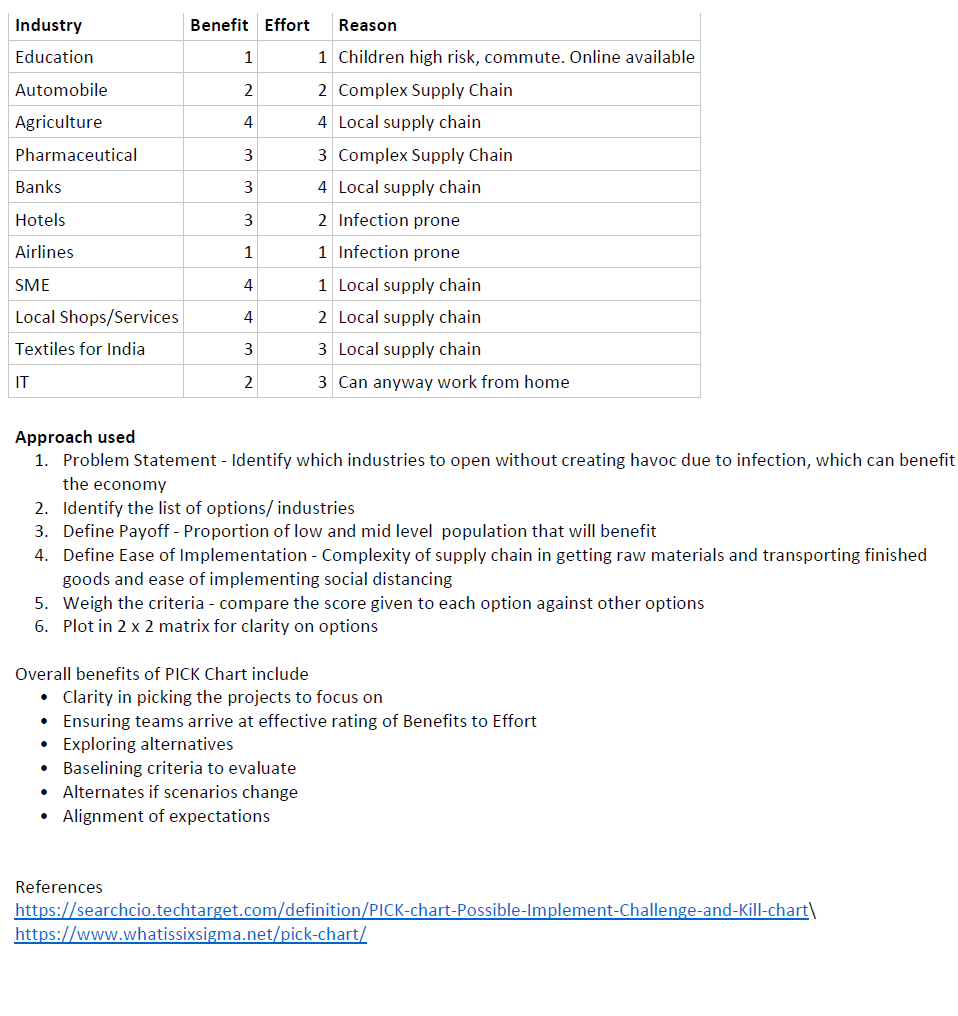
Ram Rajagopalan replied to Vishwadeep Khatri's topic in We ask and you answer! The best answer wins!PICK Chart.pdf


-
Ram Rajagopalan replied to Vishwadeep Khatri's topic in We ask and you answer! The best answer wins!The Ben Franklin effect is a proposed psychological phenomenon: a person who has already performed a favor for another is more likely to do another favor for the other than if they had received a favor from that person. The Benjamin Franklin effect is generally explained using cognitive dissonance theory, which suggests that holding two or more contradictory beliefs at the same time causes people to experience mental discomfort. Specifically, based on this framework, people experience the Ben Franklin effect because they try to reduce their cognitive dissonance, which in this context could occur if they performed a favor for someone that they don’t sufficiently like, as a result of the mismatch between their actions and their feelings toward the person that they’re helping. What this means is if you try to endear yourself to the colleague who just hasn't warmed up to you, forget bending over backwards to help him out. Instead, ask him for something. He might oblige. It has a lot of profound implications in business. A salesperson courting a business client, is better off asking the client on how client can provide valuable inputs, rather than proactively going and offering a solution at first go. And avoid doing things like Proof of Concepts etc for free. Customer loyalty is a tough area to crack. Requesting something like a small feedback to improve, might look like a small thing, but could end up improving perceived impression about the product better. Followup first favour with another reasonable one, because not helping will prove contradicting to the previous favour. This includes going back to client and asking say a reference to someone else in the organization who needs help. To avoid snowballing of favours, slowly start to introduce incentives to offset the increasing weight of the favors you’re asking. At this stage a free POC etc might make sense. Key things to know how to use the Ben Franklin effect include The scope of the favor generally doesn’t matter as much as the favor itself. Don’t be afraid to ask for help, since people often underestimate how likely others are to help them. Remember that even if your intentions feel obvious to you, they generally aren’t as obvious to the other person. You can take advantage of the effects of reciprocity, by performing a small favor for the other person, before asking them to perform a favor for you. After asking the other person for a favor, you can perform a small favor in return, in order to increase the likelihood of them helping you if you ask for a favor again. be realistic with regard to who you ask for favors, and with regard to the favors that you ask for how you ask for a favor is also important Knowing such key insights helps in our day to day business and personal lives. Reference Sites https://effectiviology.com/benjamin-franklin-effect/ https://en.wikipedia.org/wiki/Ben_Franklin_effect https://www.neurosciencemarketing.com/blog/articles/how-to-use-the-ben-franklin-effect-to-increase-loyalty.htm
-
Ram Rajagopalan replied to Vishwadeep Khatri's topic in We ask and you answer! The best answer wins!What we know with data Exponential growth once it reaches stage 3 with community spread. Repeated patterns on spread vs when curfew is imposed across countries. The more delay/ less strict curfew the higher the infected population Mortality rate by age segment - higher for older people. Infection seems much less for those aged < 20 Increased testing identifies patients earlier. Atleast they are quarantined earlier to prevent them from being carriers Most people seem to have only mild symptoms Genetic sequence of the virus The rough timelines the virus can survive on various surfaces and temperature What we don’t know If there is any impact due to weather - temperature, humidity etc. Typically flu spreads during winter season. The spread in tropical climates in Singapore, Australia (Southern Hemisphere has Summer) etc is increasing but lesser than in cold climates in US/Europe. Any drug that can mitigate the symptoms. Lot of names of anti malaria, HIV, Japanese drug etc drugs floated around but no statistical evidence of it Is there a possibility of repeat, that is once this subsides, will it come back later this year/ near future? Do humans build antibodies post recovering from infection? Is there a possibility of re-infection? Can it infect animals? Given this the only solution seems to be Break the chain - social distancing. Avoid unnecessary travels, people interactions Those older than 60 need to stay indoors Hygiene factors - wash your hands with sanitizer and avoid touching face On humanitarian front, lets ensure that all people who are dependent on daily wages are taken care of - housemaids, vegetable vendors etc Avoid hoarding excessively and creating panic. Not everyone can afford huge spikes in prices Check on your employees safety regularly Keep all emergency contact details ready Avoid forwards and rely only on official information How its going to impact future There is going to more adoption and comfort in work from home arrangement Airlines and travel related industries are going to see subdued demand for next 2-3 quarters Big impact on jobs, small and medium size industries and entrepreneurs Stricter border controls imposed by nations, aversion to outsiders Higher adoption of gig economy - more online purchases and delivered at home Higher adoption of digital currency More usage of hand sanitizer World needs a better sharing of information on epidemics and a stronger WHO On a lighter note - lots of people are going to stuck with years worth of toilet papers I am not posting any graphs/ numbers. There are plenty online. But recommend only to look at known news channels or WHO https://www.who.int/emergencies/diseases/novel-coronavirus-2019 There are lot more unsubstantiated data online.
-
Ram Rajagopalan replied to Vishwadeep Khatri's topic in We ask and you answer! The best answer wins!Visual control is broadly a practice of monitoring performance, predicting abnormality and alerting when required. Mistake proofing is in a way a subset of/ derives a lot from Visual management, with primary intention being to avoid any mistakes/ deviations. Visual management is widely used. In Operations this included cases incoming, completed, pending and potentially missing SLAs. A contact center dashboard has details on calls incoming, handled and metrics like abandoned, service level etc. Alerts are for managers to look into long calls. In Manufacturing, it provides a visibility into the production floor, in Retail its about sales & stock. Project management has also moved to more visual approach using Kanban cards. Business Intelligence technologies are widely used in Business to provide visibity into operations. Outside the business world, visual management include Road signs that provide directions, warnings etc. Mistake proofing is intended to avoid defect and subsequent financial, time and resource wastes. In airports you notice clearly demarcated lines for planes and other vehicles to ensure there are no personal injury or loss. Countries are laying out dedicated lanes for bicylces, buses etc. In warehouses, you tend to notice a lot of clearly demarcated zones. In Business operations, typically checklists are used to ensure compliance to processes. Visual management is more of standardization to observe and control process deviations, while mistake proofing is about eliminating deviations beyond threshold. Visual management is designed for self explaining, self controlling and self improving. Anyone should be able to tell whats happening based on the visual management. Each process should have error-proofing to ensure defects are not passed on to the next step and that each operation has mistake proofing in place to ensure only defect free parts are accepted in. Mistake Proofing The website https://www.six-sigma-material.com/Mistake-Proofing.html had good examples of Mistake proofing Spell check on work editor UPC codes and scanners (reduces data entry errors) Snooze Circuit breaker Operator training Low fuel alarm and visual indicator on vehicle Instructions on assembling furniture or light fixture Automatic save features on software Pull down menus for consistent data entry Inspection The hole in the upper portion of a sink to prevent overflow Pressure relief valve on hot water heater Coffee maker shut off feature when pot is removed Tinting of contact lenses to assist in locating them L or R on the contact lens case to indicate left or right eye Kill switch of jet-ski attached to life jacket Limit switches "Are you sure you want to DELETE?" reminder Sorting of suspect material Force or sound detection monitors on machines Fire and Carbon Monoxide alarms Infrared imaging surveys to detect hot spots Kill switch on a forklift seat Rubble strips on shoulders of roads Oven Timer Traffic lights Rubble strips on road shoulders Various lane stripes and colors on roadways GFCI outlets Double hand jog systems Almost any type of sensor or alarm is a poka-yoke device Wall stud finder Car beeping if lights are left on Automatic shut-off for car lights accidentally left on Visual Control Example from https://www.sixleansigma.com/index.php/wiki/lean/lean-visual-management-visual-control/ A. Seeing as a Group • Production status • Inventory levels • Machine availability B. Knowing as a Group • Delivery commitments • Goals and schedules Management rule C. Acting as a Group • Consensus on rules & objectives • Involvement in improvement activities
-
Ram Rajagopalan replied to Vishwadeep Khatri's topic in We ask and you answer! The best answer wins!I wasn’t able to get the survey report to analyze the details behind the survey. The optimistic way of looking at it is that 84% of Agile projects are successful in some forms, which is in many ways around twice the success rates of traditional waterfall approach. Reference (https://vitalitychicago.com/blog/agile-projects-are-more-successful-traditional-projects/) "Agile Software Development is a lightweight software engineering framework that promotes iterative development throughout the life-cycle of the project, close collaboration between the development team and business side, constant communication, and tightly-knit teams. " A key aspect of Agile projects is fail fast. Sometimes there is a blur on what is genuine continuous improvement vs genuine failure I feel it is also got to do with the type of organizations adopting this. We have the new age technology companies (Google, Facebook etc.) vs the traditional Enterprises adopting Agile. For New Age companies, speed is of utmost importance. They constantly are looking at bringing new products to market. The mindset is towards faster rollout, fail fast and improve faster, focus on end to end straight through processes with customer focus as paramount importance. The people who they employ are also tech geeks suited for agile. For Enterprise companies, they are saddled with ageing technologies, often a huge complex myraid set of technologies. They try to leverage existing IT ecosystem to bring in change needed to compete with nimble new competitors. They also train existing business and IT SMEs on Agile and expect them to adopt the new ways of working. The same is the case with many of the legacy IT Services companies, where the large portion of the employee base is used to the traditional Waterfall methodologies. The biggest reason for failure of Agile projects is due to Planning. Most companies don’t have two strong critical roles - Product Owners and Architects. A badly designed and thought through project is only going to iteratively fail. Product Owners need to have a strong handle on the roadmap for the applications and value it delivers. Agile also requires the business SMEs to work in a lot more collaborative manner than before. With myriad of new technologies available, and short durations of Sprints, its critical to have Architects who have a strong vision on the stack to take care of performance and security. The role of the Architect is also to keep it simple, that in turns reduces the chances of failure. Key aspect of Agile is strong collaboration and constant communication. A good collaboration tool is equally important to track the progress and have a strong control on the various aspects of the project. Teams also tend to be geographically distributed. Organizations need to invest in such collaboration tools, including video conference to make face to face interactions. Since Agile involves a small team, its equally important that there is good synergy within the team members. Cannot have a hierarchical approach, discouraging members to speak up. In traditional approach, it became very compartmentalized with specialists for design, documentation, development, testing, deployment etc., but in Agile there is expectation of each member to own end to end, and not looking at passing things to another team. Retrospect and Learning needs to be done in all earnest. More often teams tend to focus too much on process metrics like velocity, backlog, burn down charts etc. and tend to forget the goal - the business value that is to be delivered. This results in teams focusing on getting things done mechanically, being rigid on addressing changes required so as not to break the sprint. Ultimately working software is the key to successful projects. Agile itself is a very simple approach, having some 10-12 key principles. As the saying goes "The devil is in the detail", making Agile successful or not depends on the details behind the planning and execution.
-
Ram Rajagopalan replied to Vishwadeep Khatri's topic in We ask and you answer! The best answer wins!Pareto charts are used to identify the top causes for a particular effect (defects). Its often associated with 80-20 rule, 80% of variances are due to 20% of causes, though often not necessary to meet the guideline. Paynter Chart is a statistical graphical tool that drills down the Pareto chart. It enhances the Pareto Chart with a run chart, that indicate what items add up to the count for each reporting period. The chart displays a subset of key sub groups as a bar chart, with the total across subgroups on the top. Benefits - Helps to drill down the composition of each bar of the Pareto to spot trends and patterns. Paynter Chart was developed by Ford Motor Company Reference Sites https://www.yumpu.com/en/document/view/17279712/paynter-chart-analysis-guidelines-chrysler http://www.statit.com/support/faqs/gpaynter.shtml http://www.statit.com/support/quality_practice_tips/usingpareto_payntercharts.shtml


-
Ram Rajagopalan replied to Vishwadeep Khatri's topic in We ask and you answer! The best answer wins!Customer is always King!. But all organizations need to determine what type of Kings they want to deal with, which will help them in achieving a sustainable and profitable growth. In IT services sector, ideally you want to work with Customers who treat you as Transformation partner, to work in join partnership on solving their business requirements. This is in contrast to vendor partnership resulting in staff augmentation. But to get there takes a lot of effort to build the Brand, capability and delivery excellence etc. for customers to treat you that way. Working with larger Fortune 500 Corporations means a more structured approach for contracts, services and payments. But they also typically tend to mitigate risks by having more than one vendor for their requirements. Working with small to medium size organizations, may lead to challenges on size of contract, payment issues etc, with upside of becoming a strategic partner when the customer organization grows. Working with customers mean investments in Customer Relationships, Proposals, Proof of concepts etc, which are justifiable only if the relationship grows. Its better to trim the tail (where returns are meagre compared to investments) and refocus on profitable customers. Organizations need to decide on their customers based on the products and services they provide, their stage of growth, risk appetite and financial situation. Its better to turn down customers, when the requirement is not a skill the company has or wants to build, or there is insufficient capacity to meet the requirement, or requirements are not clear leading to potential scope creeps. There is an Explicit and Implicit way of selecting the customers to do business with. Implicit is indirectly stated or implied, while Explicit is directly stated and spelled out. In Explicit, companies usually spell out policies to meet to work with customers and vendors. There might be a minimum revenue size requirement, years of existence, credit worthiness, geographical location etc. This usually changes as the organization grows. In Implicit, Companies can segment the customers they want to work with and design appropriate strategies so that customers self select. For example, a high end luxury brand Retailer, will have stores located in Premium locations or malls, offer limited but exquisite products and pricing is in the higher range. They offer excellent customer service (Nordstorm, Coach, Burberry etc). Similarly Retailers, like Walmart offering Every day low price, target the general population, offer a wider catalogue at affordable price range. There is a dynamic of margin vs volume play, and based on which companies design their investments. This is visible in many sectors Hotel (2 or 3 star vs 5 star), Mobiles (Apple vs Android), Cars (BMW vs Hyundai) etc.
-
Ram Rajagopalan replied to Vishwadeep Khatri's topic in We ask and you answer! The best answer wins!Drum Buffer Rope is a concept popularized by Eliyahu Goldratt in his book Goal. It was used in analogy to a Boy Scout team, to ensure that the team doesn’t get dispersed wide due to the variations in speed of the fast movers vs the slower ones. A synchronized approach ensured that the team is in step. Once the rope is stretched to the max, the fast movers have to slow down or stop. The same concept can be applied to manufacturing, where speed is controlled by the drum, buffer adjustments by a rope with a goal of increasing throughput. The drum relays the information of the bottleneck to the group. The rope controls the speed of the set of processes ahead of the bottleneck from running away and creating excess WIP. Rope is like a signal to the front of the line to start producing at the front as consumption is happening in the bottleneck. The limitation of DBR approach is due to shifting bottlenecks. Kanban is a Lean Management technique to achieve Just In Time. Kanban controls the upper limit of inventory, thus avoiding over capacity. It is achieved by going from the consumer of the process, taking demand from the end consumer up thorough the chain, with the rate of demand controlling the rate of production. Conceptually, for DBR, this is like keeping the drum at the last person and making it to a demand driven process.
-
Bessel correction in statistics is used to correct the bias in the estimation of the population standard deviation. Variance calculated from sample is usually smaller, when used to estimate for population. Adjustment needs to be done to account for this. To give a context, we can calculate the mean and variance of all students in say class 10. Now if we randomly pick a small sample of 3-4 students and calculate their standard deviation, it may not capture extremes. It is more likely to get more of the same type of students. This standard deviation will likely be smaller than the population. Adjustment needs to be done for the bias Normally Variance is calculated as mean of the sum of squares of deviation of sample values from sample mean. Standard deviation is calculated as square root of the variance. When the population mean is unknown, to estimate the population variation, (n-1) is used instead of (n) in the denominator. This method is used when estimating population mean and variance from sample. The logic is that 1 degree of freedom is used in the sample mean and hence only (n-1) for the sample variance. When (n-1) is used, the variance will increase. References for more mathematical reasoning and formulas: https://www.statisticshowto.datasciencecentral.com/bessels-correction/ http://mathcenter.oxford.emory.edu/site/math117/besselCorrection/ https://proofwiki.org/wiki/Bessel%27s_Correction