

Raghavendra Rao Althar
Members
-
Joined
-
Last visited
Everything posted by Raghavendra Rao Althar
-
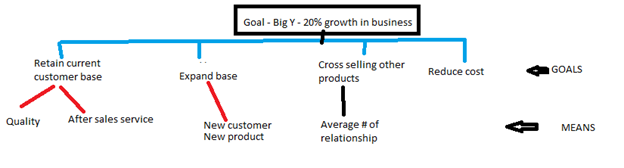
Raghavendra Rao Althar replied to Vishwadeep Khatri's topic in We ask and you answer! The best answer wins!Problem definition tree helps to drill down into top areas that are contributors for key business challenges and opportunities. At each level of drill down we need to look at the top contributing factors and further drill down into that area. Problem definition tree also depicts the breakdown of the prospective factors with the suitable explanation for choosing a particular factor at a particular level. Its important to identify all suitable factors contributing at each level of drill down. Each level needs to make sure that it covers the factors that are mutually exclusive to each other. Selection of a factor at a level will be based on the criticality of that factor for the business. Here is an example of problem definition tree. Analysis of the drill down should be stopped when the further drill down do not help to derive business level objectives and starts getting into operational level objectives.
-
Raghavendra Rao Althar replied to Vishwadeep Khatri's topic in We ask and you answer! The best answer wins!In the design of experiments main effects and interaction effects come into play. Sparsity of effects principle stands for higher order effects having more significance than the lower order effects. Main effects and some of the two-factor interactions among lower order effects will likely be statistically significant. This mean three-factor effects rarely having major influence on overall effect. This helps researcher to devise their experiments to find those few key statistically significant effects in design of experiments. Simple illustration of the sparsity effects in design of experiments are while we design our home interiors, overall effect at the end is influenced by colors of wall, placement for things in the home, structure of the object, type of flooring and many other factors. If researcher subject this to experiments, it can be focused down on to few main factors with two-way factors that will have significant influence on the overall final outcome. With this principle, expert knowledge can guide the confidence of these design of experiments.
-
Raghavendra Rao Althar replied to Vishwadeep Khatri's topic in We ask and you answer! The best answer wins!Levene’s test helps to assess to test the variance across the groups under study. This test helps to establish if the datasets that we are studying conforms to the assumption of homogenous variance, before conducting Analysis Of Variance tests. Levene’s test can be an alternate for Barlett’s test, if being sensitive to normality of the data is not a focus. If we have confidence in data coming from a normal distribution then Barlett’s test can give much better performance of the test. For example lets say we want to assess the across various students from different disciplines of engineering on their reading duration in a day. We are looking at population data sets that may not follow a normal distribution. In this case Levene’s test will help to validate the hypothesis. Null hypothesis will that variance across these groups of student will be same. Alternate hypothesis will be that the variance across these groups on reading hours per day will not be same.
-
Raghavendra Rao Althar replied to Vishwadeep Khatri's topic in We ask and you answer! The best answer wins!If the data is not normal and is transformed, then that impacts the accuracy and validity of the control charts if in case they are to be monitored. This makes it important to handle the transformation of data in a more cautious way. There are no particular method of transformation that fits a particular scenario. Different method of transformation have different benefits. Some of the key considerations while choosing transformational techniques are, extent of non-normality prevalent in the data, how easy it is to apply the method, how much better is the interpretability of the data, how well the transformation supports the process performance and other factors. Its worthwhile to give due consideration of non-parametric method before considering the data transformation. Median charts, run charts, Weibull distributions are few methods that fit into non-parametric methods. Data smoothing is an approach that can assist in removal of noise from the data, clustering, binning and regression methods are part of noise removal approach. Data generalization is another approach of data transformation, where low level attributes are transformed to high level attributes. This is suitable in case if there are finite number of values in data that have large number of distinct values. Like in case of data set that has data for city, street, country and state, we can define hierarchy of these attributes by ordering them with respect to their relations. Order would be country, state, city and street. These are couple of customized data transformation as needed for specific scenario.
-
Raghavendra Rao Althar replied to Vishwadeep Khatri's topic in We ask and you answer! The best answer wins!Probability plot helps to assess normality of the data. Outliers, skewness, kurtosis characteristics of the data can be understood. Kurtosis represents the characteristics of the tail part of the distribution. In case of the data distribution is close to the straight line representation in probability plot, data is normal. In probability plot theoretical quantiles are chosen to provide an approximation of mean or median of data distribution. Quantiles are range of probability distribution that are divided into continuous intervals with equal probability. Data points that are on upper or lower extreme of the line represents outliers of the data. These outliers influence the prediction modeling capabilities for the data set. Probability plots done on residual values of the data is helpful for purpose of prediction model validation and figure out outliers that cause test of models to fail. Probability plots also assist in DOE (Design Of Experiment) by effect plots that represents interaction between various factors in the experiment. Effects that are closer to normal probability line are not significant as they are part of random variations. We need to look at outliers that has significant influence.
-
Raghavendra Rao Althar replied to Vishwadeep Khatri's topic in We ask and you answer! The best answer wins!Z-MR charts or short run charts, are useful proposition in case of dynamic product groups that has wide variety of products with short production volumes. This version of control chart helps in situations where there are customized solutioning given to the customers. From operations wise this mode of delivery reduces the need of inventory and improves response to customers, but in terms of monitoring the process it will be complex situation. Since the variations is involved in the scope of delivery of the pizzas in terms of each order being different from each other with respect to items ordered, delivery location and so on. This situation needs Z-MR chart, as it accounts all the sub-group of the data point. Z value computation is generalized way of computing the process stability irrespective of the unit of measure. Since the sub-group vary from each other, this generalized approach for assessment helps. Z-MR chart normalizes the data by subtracting the mean value from the data and dividing it with standard deviation so that the data points get centered with common reference to assess from. This helps to have common platform to assess the data coming from various sub-group on common control charts. Other type of control charts will not utilize the variations of all the sub-groups.
-
Raghavendra Rao Althar replied to Vishwadeep Khatri's topic in We ask and you answer! The best answer wins!Non linear regression will be useful when relationship between dependent and independent variable are not predictable. Linear regression provides the linear relation function that fits the dependent and independent variables. Non linear models helps to model the randomness in the relationship between the parameter. Non linear regression helps to capture complex relationship between the parameters. For real world phenomenon like economics, that have complex influencing factors, non linear regression will be useful. Non linear regression also helps to bring out the hidden relationship between parameters. Other benefits of non linear regression is in feature selection in prediction modeling, and also in building interpretability into prediction models. Challenges with non linear regression are the possibility of overfitting of the data. Since there are multiple local maxima and minima its harder to identify the optimal parameters for the prediction model. Also the models are more sensitive to the noise and the overall effect of noise would get amplified. Computational intensiveness and large data need for analysis are other limitations. Governing factor for choosing right regression approach, is to start with linear regression to understand the fit of the data. In case if its not possible to have best fit. Then non linear regression is to be checked. Availability of large set of data is another need for being able to use non linear regression.
-
Raghavendra Rao Althar replied to Vishwadeep Khatri's topic in We ask and you answer! The best answer wins!Histogram assists in summarizing data over scale of defined interval. They represent frequency of distribution of various data points for a variable. Histogram classify the data points into bins based on specified bins count. Lets take example of salary of the employees of the organization to be visualized. Bins of the histogram are created by range of 0 to 5 lakhs, 5 to 10 lakhs, 10 to 15 lakhs. Now histogram will plot the count of people in each of these bins in the Y axis and the X axis would represent the bins. This histogram will help to visualize if the data is skewed to left or right or normally distributed. Left skewed mean the tail of the spread is on left side, which means large number of people are on higher spectrum of the salary. Similarly right skewed is other way round. This scenario represent central tendency of the salary to see where is most of the data points are centered, how are the variations across different spectrum of salary are built and also the shape of the spread. Since the data gets bucketed into the bins. Way we define the bins will influence central tendency, variability and shape of the distribution, as those bins are generalization of the range of data points. Granularity of the bins definition should be balanced to get right insights.
-
Raghavendra Rao Althar replied to Vishwadeep Khatri's topic in We ask and you answer! The best answer wins!EWMA (Exponentially Weighted Moving Average) control charts are used for monitoring attribute type of data. These charts can be used to plot individual data points or subgroup means. EMWA charts consider full history of the process under monitoring for its plotting. Compared to other control chart, EWMA differs in terms of, weightage of recent samples contribute higher towards moving average computation in EMWA. This helps to highlight even the smallest shift in the process average. If the process needs focus on smoothing out the effect of uncontrollable noise EWMA will help. Disadvantage of EWMA charts are, they are complex is its statistical computation. They are not appropriate for the processes where the shift is process are very large.
-
Raghavendra Rao Althar replied to Vishwadeep Khatri's topic in We ask and you answer! The best answer wins!Outcome to measure here is “water level up to mark”, metric will be actual water level measures. Data type is continuous. Sample size is fixed at 1 bottle per hour. I-MR chart is the best one. Individual Moving Range chart is used when continuous data is to be monitored with 1 sample. We need to compute the control limits for this process of water bottling. Compute the average of entire data set that is available at given point of time. Select the period of data such that in that period there has not been any major change in the processes. Idea is to make sure that we are looking at the set of data that is from common processes. Moving range is another component of I-MR chart, moving range is absolute difference between two consecutive points. Calculate average of moving range values. This information will help us to compute Upper Control Limit (UCL) and Lower Control Limits (LCL) for Individual chart and Moving Range chart. Using these initial values, we can set up process stability monitoring for the process.
-
Raghavendra Rao Althar replied to Vishwadeep Khatri's topic in We ask and you answer! The best answer wins!Job Breakdown Sheet (JBS) or Standard Operating Procedures (SOPs) helps to list down step by step process of executing a job. This helps as a ready reckoner for the person executing the job to replicate the expected work steps without having to worry about possibilities of missing out any steps. Potential advantage also includes institutionalization of the standard practices across the unit of organization to make the outcome of the process predictable in terms of cost, quality and time. Potential disadvantage of the JBS would be, it may make the executive less open for creative and experimentation mindset. Unless there is periodic mechanism to refine and update the JBS there is danger of outdated process being executed. JBS would be handy tool to establish a new practice as part of Improve phase of the six sigma DMAIC framework. Also JBS will provide opportunity to firm up on the established practice in Control phase, helping in making a practices a culture of the organization.
-
Raghavendra Rao Althar replied to Vishwadeep Khatri's topic in We ask and you answer! The best answer wins!Second school of thought is more relevant. Discovering the product and services that we deliver, and discovering the users that use our product and services are key part of product and services maturity journey. In the product and user discovery, we focus on understanding the life of users and figure out the ways in which our product and services can enable their life better. Many a times users would have found a alternate ways to use our product and services, which may not be the most optimal way. But easing those alternate way into optimal way so that the product can really help users in their life should be the focus for service provider. Building tons of features into product and service is so common, though we know users only use a fraction of features among them. Building good balance between usability for users, feasibility for builders and viability for the business is critical to establish a matured product and service.
-
Raghavendra Rao Althar replied to Vishwadeep Khatri's topic in We ask and you answer! The best answer wins!One-piece processing focus on producing based on customer need. This helps to maintain good control on cost, as we do not have to mass product and wait. This method also will have better quality as we can focus closely on a piece being processed. Productivity is also better as the piece flow without any waiting time between processes. Lead time also will be better as focus is to cater to a specific need of the customer on demand. Cost benefit analysis is needed to figure out if the cost of building at the last moment for the customer need balances with the building in batch. Manufacturing of car would be good example of one-piece processing based on customer demand. One-piece processing also would lead to low employee morale as there is no variety in the work processing. In case of batch processing, there is initial investment in setting up the process, but once the processing starts outputs are high and it will be productive process. Quality may be challenges as the processing is in a batch. Cost of processing will be relatively better than one piece processing. Batch processing suits well for the business that have low shelf life of the raw materials like bakery products processing. Waiting time is an issue as the batches has to wait until the next process is ready. Based on the needs of the companies combination of both the approaches may work well. Study of the business is needed to devise right batch size for the processing.
-
Raghavendra Rao Althar replied to Vishwadeep Khatri's topic in We ask and you answer! The best answer wins!DPMO method is useful when we have defects count, samples count, OFE (Opportunities For Error) details. DPMO = total defects /total OFE X 10^6. Total OFE is computed as number of samples X OFE. DPU method will be used when we do not know OFE. Number of defects is known, OFE not known, number of samples is known then DPU method will be used. Example: 500 mobile phones inspected, every scratch is a defect, total of 8 scratches found on 5 phones; remaining 495 phones no scratch. defects = 8; sample = 500; DPMO = DPU X 10^6. Yield % will be used in case if Defectives are known, number of defects or number of sample not known, OFE not known, then DPMO = defective X 10^6. Example: samples of among 1500 bottles, 125 bottles are bad, then yield = good parts / total parts; yield = % good parts/total parts; FTR yield = First time right parts / Total parts.
-
Raghavendra Rao Althar replied to Vishwadeep Khatri's topic in We ask and you answer! The best answer wins!Defective data follows the binomial distribution ‘P’ chart to be used for monitoring and capability analysis. ‘P’ chart signifies the proportion of defective trends. NP chart is used when you have Defectives data with a Fixed Sample Size. P chart is used when you have Defectives data with a Variable Sample Size. Defect data follow poison distribution, the Z goal will depend on how many defects be reduced to give DPMO and compute the required Zgoal. C chart is used when you have Defects data with a Fixed Sample Size. U chart is used when you have Defects data with a Variable Sample Size. In a U chart, the UCL and LCL will vary with changes in the sample size. All three types of defects minor, major, and critical can be separately assessed for process stability, to get a sense of contribution from each of these classes on stability. Based on the criticality of these classes, decisions can be devised towards making the overall process stable, before exploring the capability of the process.
-
Continuous discovery of the product is one of the key themes of the Product Management thought process in software development. This inspires me to be close to customers and understand how our products enable our customer's life on day to day basis. Where can this thought process fit in? Of course, Product thinking includes - design thinking, product metrics (metrics that are close to the customer), user persona mapping, customer journey mapping, product strategy, and user scenarios mapping to product needs. All these areas are enabled by multiple competencies of Business Transformation.
-
I have been exploring the model of Customer Centered Integrated Management System framework, with the aspiration of bringing best from the world-class models like Six Sigma, CMMi, ISO 9001, ISO 27001, Agile Manifesto, Product Thinking, and so on, for the needs of a various segment of the organization. Context-based management system framework that focuses on what matters the most for the customer. I have taken the challenge of winning the heart of Delivery Leaders who think process and data will not be a major factor for organizational maturity. Quality Management System Experts should become a strategic partners in business transformation with application development leadership and business leadership. In this aspiration I have also signed up for Benchmark Six Sigma's Business Excellence with Master Black Belt program, looking forward with great anticipation, to make a difference in the industry.
-
Where does the "Systems Thinking" perspective fit in? I am coming from the view of having an organizational system that connects vision and OKR (Objectives Key Result areas) at all levels. Also, all the initiatives of the organization are aligned toward the common organizational vision. A well-connected network of organizational practices, helps an organization to be consistently aligned with common goals. Also optimally operate to move at a quick pace towards organizational maturity. I can think of models like CMMi that have a vision of well-rounded organizational practices that exhibits systems thinking with the power of process and data.
-
Raghavendra Rao Althar replied to Vishwadeep Khatri's topic in We ask and you answer! The best answer wins!In the context of software development transportation costs can be equivalent to software requirements clarifications that are waiting to be responded to by the onshore team which has a considerable time difference from the offshore team. Motion examples would be scattered software development team members, who may have to do frequent movements to reach out to their team members for any clarification. Agile methodology recommends co-located teams to avoid this waste. Because this waste due to motion will create context-switching for the team member, as they move to get clarifications from their other team member. Context switching results if disconnected during work and getting back to the flow of work will need more energy and time. Dependency on interface partners of software development teams is another transportation-related waste. This involves the software development team waiting for the go-ahead from another software development interface partner. Lack of resources that are having multiple skills will also add to motion-related waste, for example, developers have to wait for feedback from testers or Business System analysts and so on. The agile methodology also kind of emphasize the need for an Agile team that has a strong composition of all needed skill, where a team can work as a cohesive unit. In the case of manufacturing transportation wastes are the unwanted movement of materials across shop floor between machines, or between warehouses of different manufacturing locations. Motion wastes are the unwanted movement of workers on the shop floor, for picking up the raw materials or any other required inputs for their processing at their machine.
-
Bringing in lean principles into software development is well explored in the book "Lean Software Development: An Agile Toolkit Book by Mary Poppendieck and Tom Poppendieck". Book is structured in expanding these principles in the context of Software Development; Eliminate waste | Amplify learning | Decide as late as possible | Delivery as fast as possible | Empower the team | Build integrity in | See the whole. How do we win the confidence of software delivery leaders on six sigma experts being able to become their strategic partners in delivery.