

Suresh Balu
Members
-
Joined
-
Last visited
-
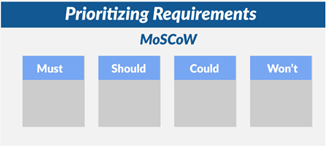
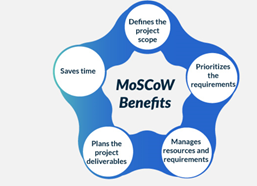
MoSCoW is one of the popular Prioritization techniques which will help us to understand and manage the Priorities in a Project deliverable. Suppose if a Product / solutions need to be developed and which has multiple features or requirement this method help us to arrange in the order of importance from Stakeholder / Customer perspective. MoSCoW stands for · Must Have · Should Have · Could have · Won’t have this time Must Have: Must have are the product features which need be there when the product is deployed in Production. This is Not Negotiable Should Have: This requirement is almost important to Must Have, but its not vital to the success of the Project. Could Have: This requirement is good to have, but not a Mandatory and it can be launched in phase 2 or 3 of the solution. There will be an impact, but the impact is very Marginal. This is nice to have if we have extra time and Budge. Won’t have: This requirement is something out of scope for now, not having these requirements will not impact the Solution. This is a great way to avoid the Project Scope Creep by dropping some of the features of the solution which is not related to the solution and it will not impact the solution. Steps for MoSCoW method: · Elicitation: Under this method objective is to have Interview / Focus Group Discussion/ Facilitated session with Stakeholders and understand the requirements and reason behind the requirement · Validation: Under this step focus is on collecting additional data and perform further study to finalize the needs/expectations from the Stakeholders. · Specification: In this step the focus is on prioritizing and formalizing the data into requirements definition report and to make sure they are tested · Verification: Finally, verify that the requirements are accurate and publish the needs and expectations of the Stakeholders. Benefits of using MoSCoW Technique: I personally applied this technique in many of the my Projects which are related to Solution/Product/Tool Development and this is a great method in terms of collating all the Solution/Product requirement in place, have focus group discussion with Stakeholder and prioritize then as Must Have, Should have, Could have and wont have basis their impact on the final product and needs of the Stakeholders.
-
Change Effectiveness Equation (Q x A = E), where Q stands for Quality of the Product/tool/solution Developed by the Organization/Department and A stands for Acceptance of the Tool/solution by the End Users. Typically, the Success of Any Tool/Product/solution is depending not only on Quality of the Tool or how good it is, it also depends on the Acceptance by its Customers or people who uses the Tool. Quality typically focus on Technical side of the Tool its Design & Features; Acceptance focus on End user point of view, WIIFM (What’s In It For Me). Below given is the Equation for Change Effectiveness: For 100% effectiveness of any given solution 20% weightage goes to Quality of the Solution and remaining and major portion of 80% weightage goes to Acceptance of the solution. It would be very interesting to note that we are doing the product (x) of the Quality and Effectiveness. Any of these is not good or Zero than the Change effectiveness score will become Zero/reduced drastically. It is important to note that just finding a solution is not enough, but the identified solution should be understood and implemented. It is very important to create the “Shared Need” as early as possible in the project life cycle and continue building the momentum for the Change. It is very important for the Project Leader to Quantify these components and increase the Effectiveness Score. It can be done in following ways: · Identify key selling points of the Solution and create the awareness with end users the key benefits of using the solution (WIIFM) · Summarize and share the key Features of the Product, give more specification about Product Quality · Perform Stakeholder analysis and involve Leadership team to encourage team to use the solution I have seen many instances where poor Effectiveness score due to resistance to change initially when the new solution is launched. By leveraging some of the solutions mentioned above will improve the Change Effectiveness Score.

-
Cost Benefit Analysis is one of the Key actions performed by the Project team/Finance team before moving ahead in any Project decision. This analysis helps Business to decide whether the decision they are going to take will benefit them or not. For doing the Cost Benefit analysis various sub elements of Cost and benefits will be considered and likewise from Return point of view. Cost Examples: · Direct Cost · Indirect Cost · Intangible cost · Opportunity cost · Cost of Potential Risks Benefit Examples: · Direct Benefits · Indirect benefits · Notional benefits etc. There are 4 steps process in Cost Benefit Analysis: · Identify the Cost and Benefit Associated with the Project · Assign monitory value to the cost · Assign monitory value to the benefit · Finally compare the value of the Cost with the value of the Benefits. If the Value of the Benefit is more than value of the Cost, then Project can be taken up. Key Financial measures of Cost Benefit Analysis, Few examples: · ROI: Return on Investment: This Financial measure compare the Cost (Investment) with the Benefit (Profit) and arrive the impact in a Percentage. Example: if cost incurred is $10K and if the benefit generated is 15K then ROI 150%, in this case it is wise to go ahead with Investment decision. · NPV – Net Present Value NPV is the difference between the Present value of the Cash Outflow with that of the Present value of the future Cash inflows over a period. NPV focus on Time value of the Money. For example. An investor would like to receive $100 today rather than receiving the receiving $105 after 6 months. CBA helps to calculate the Present Investment and Future Revenue and the difference is highly significant then we can go ahead with Project decision. Exceptions if the Cost Benefit Analysis outcome is Negative: Yes, there may be instances where Business may need to go ahead with a Project even though there is no Profit or not much return on Investment. Few examples could be Projects related to enhancing the Customer satisfaction, Employee satisfaction, gaining more Market Share or in case of Regulatory compliance. Some of these projects may see a negative CBA in short term however indirectly it is building the Reputation and Brand for the Company.
-
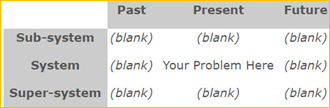
9 Windows is a Tool used as Problem solving Framework. Its looks like a 3 x 3 Matrix with Problem statement in the Middle square. It analyses the problem with the context of Time (Past, Present and Future) and with Space (Sub system, System and Super System). With the use of 9 windows, it helps by understanding the Problem in the context of Past, Present and Future, also exploring the Problem in Super System (Macro level), current System and Sub-System (Micro level) Below given is the Sample 9 Windows Matrix with Problem Statement in the Middle and 8 methods to solve the Problem in context of Time & Space. Sub-systems: are the component or parts of the System. Example: Equipment, Doctor, Nurse, Medicine etc. System: The Problem or system that is created. Example: Doctors Office/ Clinic. Super System: it is the external environment and components that the problem or system interacts. Example: Health care system There are different ways to represent the past, present and future columns, one simple method involves asking the following questions: Past: What is that I could have done to prevent this problem happening Present: What is that I could do presently so that this problem wouldn’t be happening Future: What could be done to prevent the happening So, this is one of the Creative Tool of Problem solving and it will give you up to 8 ways to Analyze and address the Problem.
-
EMO Index measures the emotional state of Customers & Stakeholders and it is a registered trademark of EMO Insight International. It determines the general feeling of each customer or group of customer or group of stakeholders towards the Company and its products/Services. In Traditional methods the focus is more on Sociodemographic variables like Race, Age, Sex, Standard of living etc. or pattern basis Product purchase, Quantity purchased, seasonality etc. EMO is a combination of Emotion felt and Intensity at which they are felt and it can be measured with -100% and +100% and it can be calculated at individual Level or at a group level by dividing the Customers into Seven broad clusters, like: 1. Fans (+100 to +80) 2. Believers (+80 to +55) 3. Followers (+55 to +30) 4. Stand By (+30 to +15) 5. Lost Souls (+15 to -5) 6. Burned Out (-5 to -30) 7. Opponents (-100 to -30) So, by grouping the customers/stakeholders into these segments basis the emotion felt, and its intensity helps to measure the impact on the Customer Behaviors.
-
Decisional Balance sheet is one of the Simple and effective Tool used for Decision making process. This Tool will compare the alternative solutions and captures the Merits & De-merits of each solution in terms of Scoring / Weightage, and if the Final score turns to be Positive then we can go ahead for the Decision. In Simple terms, it is a table that represent the Pros/Cons of the Idea/Solution. The decision needs to be taken might be related to the Problem that need to be solved or condition that needs to be changed. It also helps to speed up the final decision-making process. Example: The Company would like to decide on Launching the New version of the Mobile Phone with Increased Battery Backup. The company is closely evaluating the Pros and Cons of the impact of decision. Score Measured in the scale of 1 to 10. Pros (+) Cons (-) Increase Market share (9) Increase in Cost (5) Increase in Sales/Revenue (7) Increase in weight of the Phone (4) Increase in Customer Base (8) Increase in the size of the Phone (3) In the above example, the Total score for Pros is 24 and Total score for Cons is 12, so in this case Company should go ahead with the decision of Launching the Mobile Phone with higher battery backup. In Summary, Decisional Balance sheet is one of the Effective tool used in Decision making process.
-
North Star Metric is a Key Metric that a Company uses to measure their Growth. This Metric is closely related to the Companies Long Term and Short-Term Strategy. This Metric also help to identify how much benefit it will bring to the End Customers. Few Examples of North Star Metrics are like: · Spotify “Time spent in Listening” · Airbnb “Number of days/nights booked” · Facebook “Number of active users” · Uber “Number of Rides per Month” · Amazon “Number of Purchase per Month” The Key rationale behind North Star Metric is to how to create more Value to End Customers so that they use the Companies Product or Services, the more they use better the Revenue or Sales to the Company in turn it will increase their Profits and Market Share. As companies focus on North Star Metrics and to achieve that they need to focus on creating Long term value to the Customers and rather than getting higher revenue in the short Term. In Practice, North star Metrics is broken down into smaller Metrics to drive accountability and ownership at individual level. For Example: In Ecommerce Company the Delivery boy will contribute to the Metric by delivering the Product on time. Likewise, in a Software/Application development Company, the Web developer will contribute by reducing the Page Load Time so that the Customers will results Faster. Overall, as the Companies focus on improving the North Star Metrics in turn this will help in creating more Value to the Customer.
-
Suresh Balu changed their profile photo
-
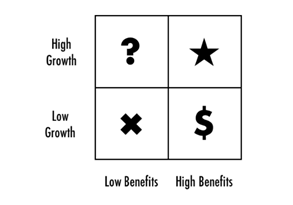
The Product Portfolio Matrix helps to achieve the right mix of the products Organizations can offer in the Market to Maximize the Market share. This Matrix distribute the Products under 4 broad Categories, which are called Question Mark, Stars, Cash Cows and Pets (also called as Dogs). The below image depicts the 4 quadrants and Product types, Cash cows are represented by $ Sign and Pets are represented by (x) cross mark. Question mark (?) They are the Products which very high Growth rates however don’t yet deliver the significant business results by generating Revenue, selling different products or services, enhancing the brand equity or saving money. Stars (*) covers the high growth Products and deliver the desired benefits to the Business. Products in the Stars quadrant are market-leading products and require huge investment to retain their market position/share, boost growth, and to maintain a competitive advantage. Cash cows ($ Sign) under this quadrant products characterized by low growth, but they offer plenty of business benefits. Products in the cash cows are considered as leaders in the marketplace. The product under this group have a significant amount of investments and do not require any further investments to be done to maintain their position in the Market. Pets (x Mark) are the quadrant that exhibits a low growth and offer very few benefits. Products in this quadrants able to generate revenue however growth is very limited and these products gradually phased out or to be re-designed to relaunch in the Market. DMAIC – Projects can be taken up for Question Mark, Products in this quadrant are in a market that is growing quickly but where the product(s) have a low market share. So we can do necessary Analysis and come up with Improvement opportunities to increase the Market Share. DMADV – Projects should be taken up in Pets, Products in this quadrant are in a market that is growing slowly and where the product(s) have a low market share. DMADV methodology should help to re-design and redeploy the Projects in Markets to gain better share.
-
Standardized work is one of the Great Lean concepts. This will help in Baselining/Defining the AS IS process very precise & clearly and helps how and speed at which a product or a Transaction to be processed to meet the Customer Demand. This is one of the Key requirements for JIT (Just-In-Time Production System). The objective is to clearly communicate to the operator exactly how the job should be performed. There are 3 elements of Standardized work: Takt Time Work Sequence Standard In-Process Inventory Talk time: This explains the rate at which product/transaction must be processed to meet the customer Demand. For Example. A staff has 8 hours in a day and need to deliver 16 Transactions in a day then he/she must complete 1 transaction in 0.5 Hours. So, this will set the Target time within which Transaction needs to be completed and helps to define the # of staff need to be deployed to meet the Customer Demand. Work Sequence: This will define the exact number of steps to be performed and in which order to get the desired outcome. Example: Process Mapping or SOP may help in clearly define the work Sequence. Standard In-Process Inventory: This will define the ideal Quantity of inventory to be carried to meet the Demand so that the process is not carrying Over or Under Inventory which will impact the Production / Cost of Operations. So, by documenting and displaying the above elements in the work station to operator / Staff will facilitate better clarity, expectation and in turn help to meet the Customer demand with Economical Cost of Production.
