
Topics
-
Fifty-five women engineering students completed an AI bootcamp focused on rural Karnataka. Participants developed AI-based solutions after visiting villages and conducting field interviews. The She Innovates bootcamp partnered with several organizations to achieve its goals. This initiative aims to boost women's participation in AI and entrepreneurship. It encourages AI applications for rural development and community-focused sectors. View the full article
-
Besi's quarterly orders more than doubled, fueled by AI and hybrid bonding technology. The company saw increased customer adoption of its advanced chip packaging solutions. Demand for AI applications continues to drive growth in data centers. Besi anticipates revenue growth between ten and fifteen percent. This strong performance aligns with other semiconductor sector reports. View the full article


Leaderboard
-
Vishwadeep Khatri
Administrators1Points6,722Posts -
Mayank Gupta
Members1Points679Posts -
Sai Kotari
Lean Six Sigma Black Belt1Points11Posts -
R Rajesh
Members1Points160Posts


Popular Content
Showing content with the highest reputation on 01/25/2022 in Posts
-
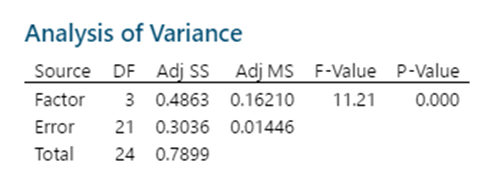
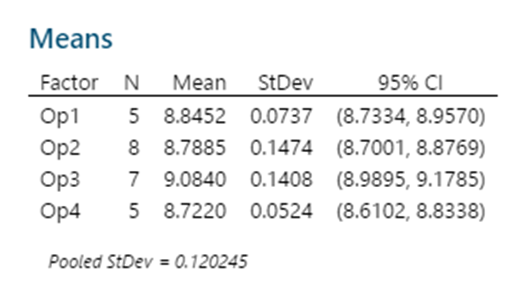
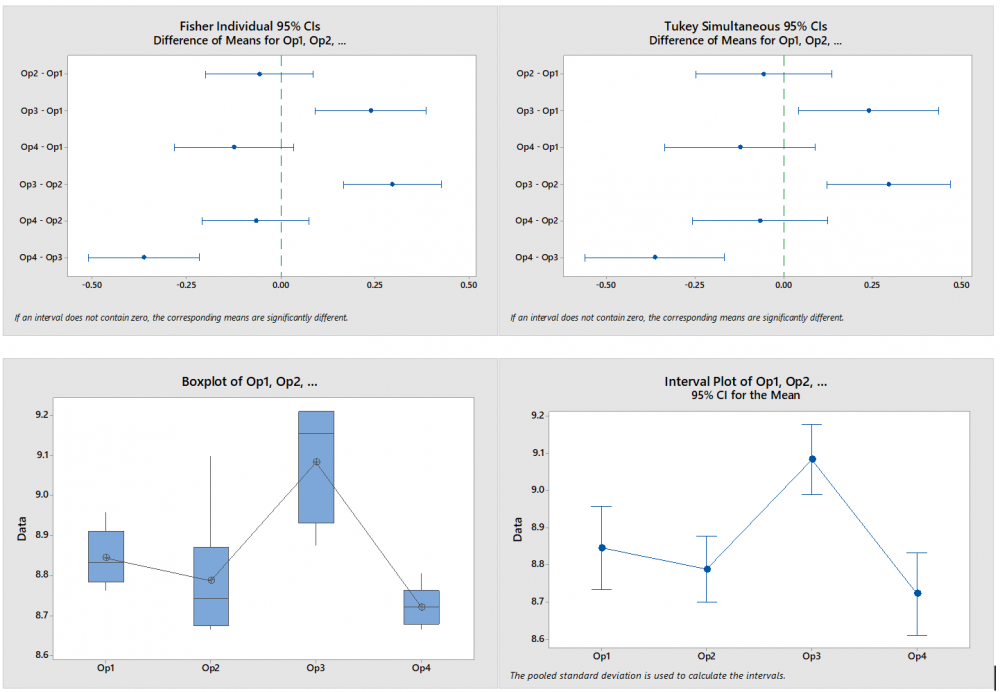
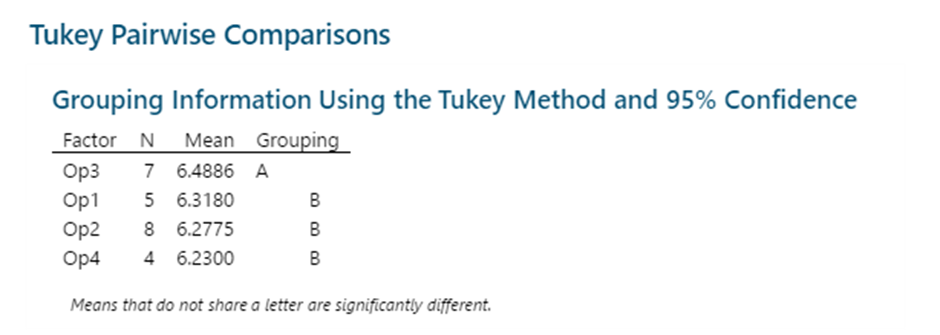
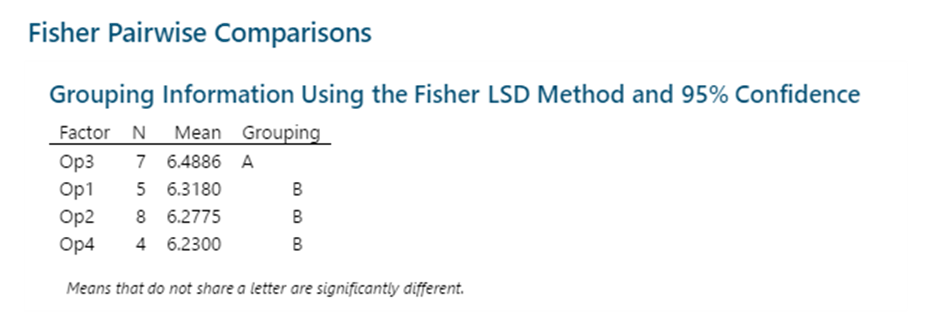
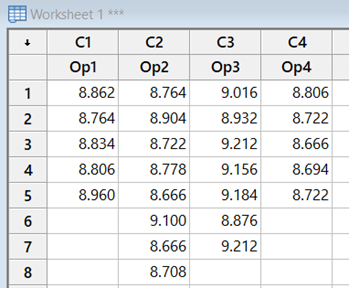
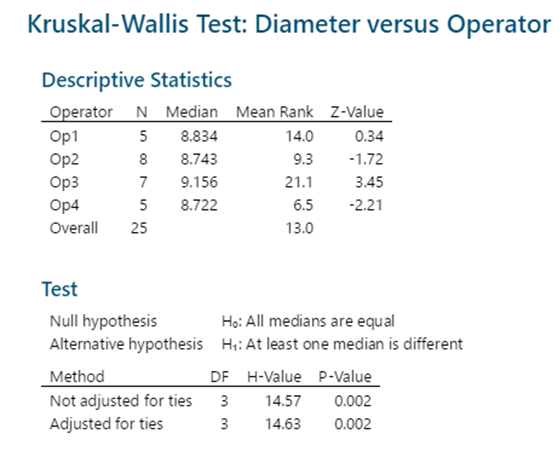
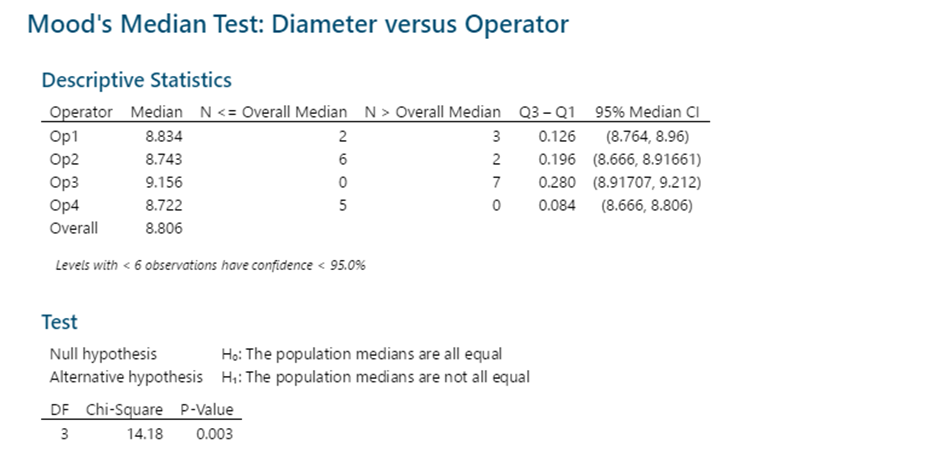
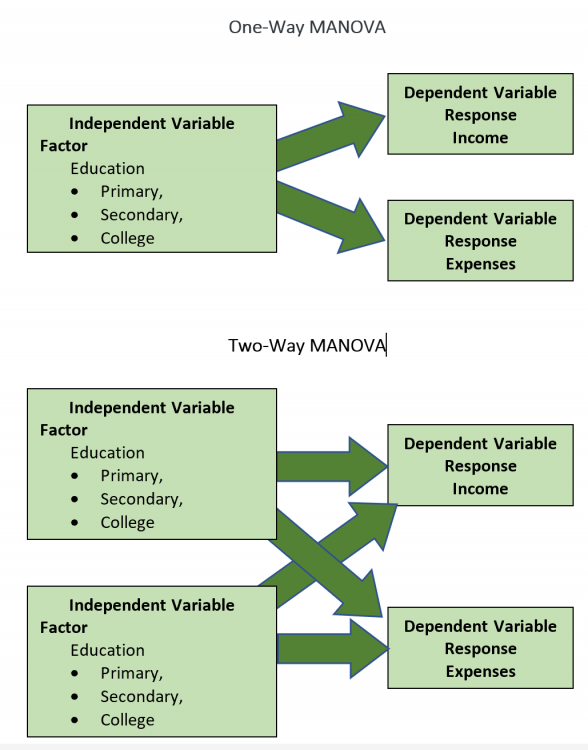
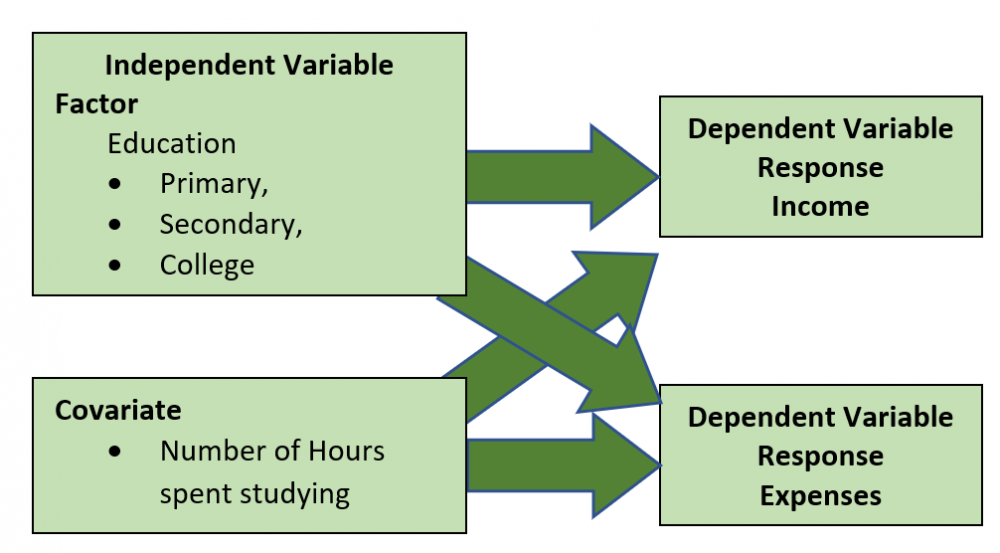
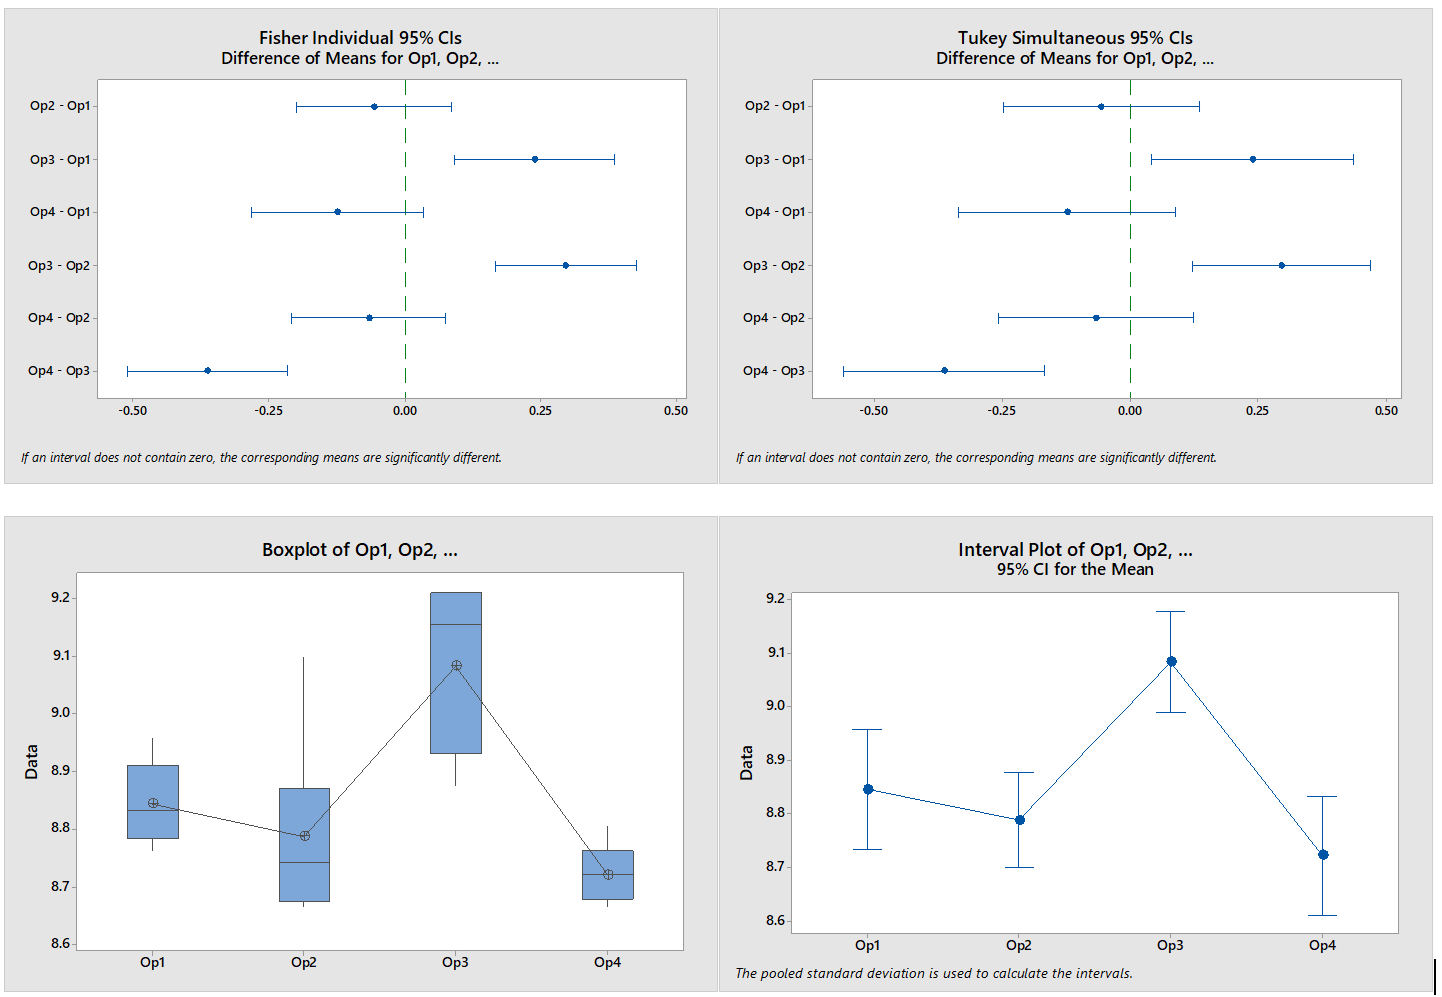
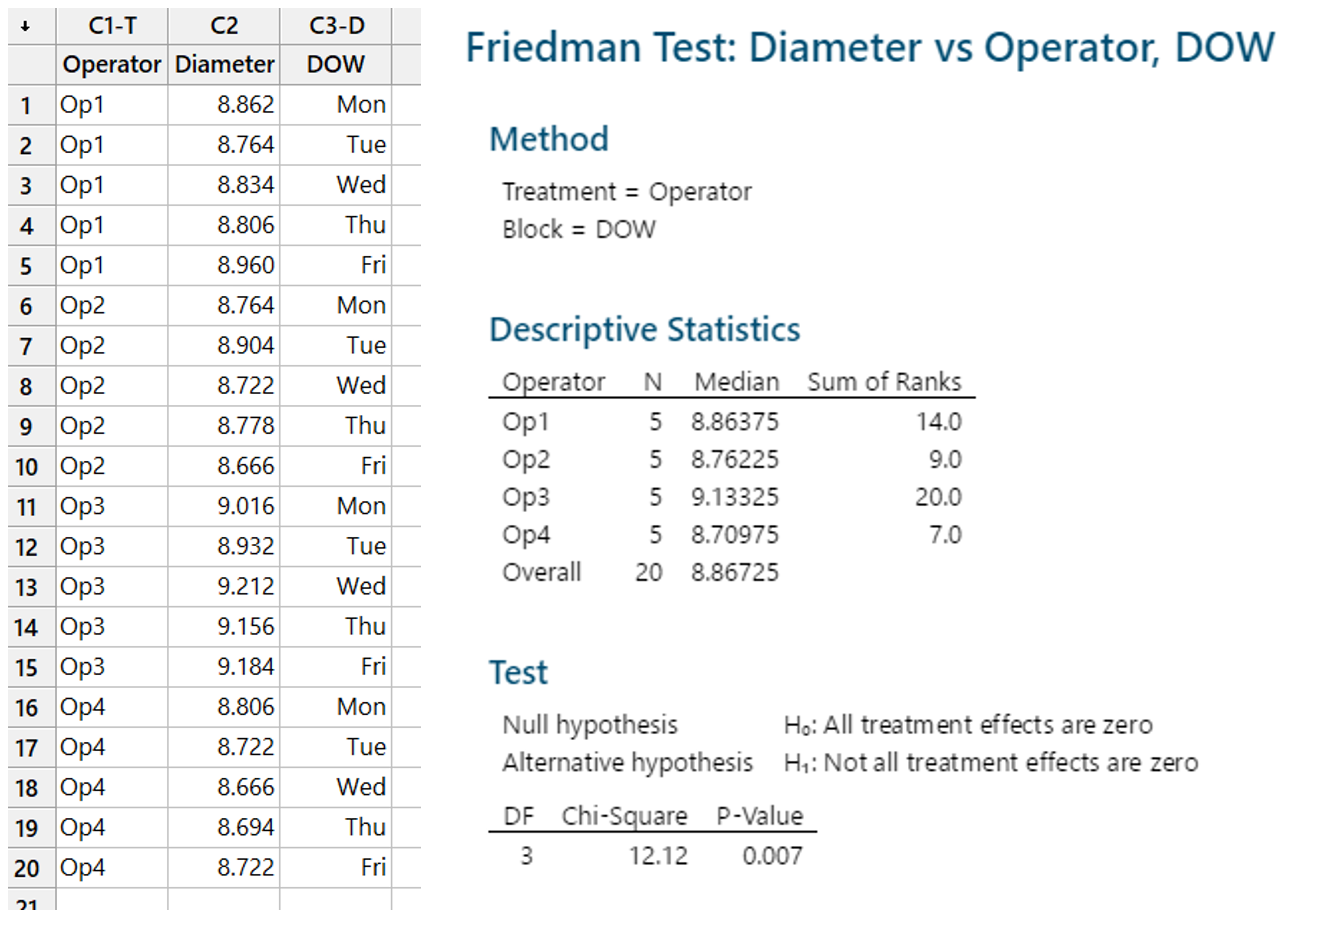
1 pointParametric tests to compare variances for more than two populations are given below One Independent Variable – 1-Way ANOVA (Completely Randomized Design). Subjects are assigned randomly to treatments. This design contains only one independent variable with one or more classifications or treatment levels. In this design, the Total Sum of Squares (the variation in the data - SST) is divided into the variance from the treatment (Between Group Variation i.e the columns - SSC) and the error variance (unexplained by the treatment, i.e. within-group variation. SSE). ANOVA compares the relative size of these two variances using the F Statistic which is the ratio between the two variances. SST = SSC + SSE Assumptions for ANOVA. Data is randomly drawn from a normally distributed population and the variance of the populations is equal. Use of Confidence Intervals. In the event of the results being significant (p-value<Alpha) the researcher needs to do a post hoc or posteriori test to determine which group is statistically significant from the rest. In order to determine this the Confidence Intervals are plotted and significance is determined by examining the overlap between the confidence intervals. In addition, Tukey’s Honestly Significant Difference (HSD) test for Equal Sample Sizes, or the Tukey-Kramer Procedure for Unequal Sample Sizes. Example. The sample consist of the pipe diameter of 4 operators. The p-value < 0.05 indicates that one or more one operator is statistically significantly different from the other operators. Examining the 95% Confidence Interval of the Operators, it can be observed that the Confidence Interval of Operator 3 does not Overlap with other Operators. This is also evident from the Fisher Individual 95% Cis and Tukey Simultaneous 95% CIs and the Box Plot. Thus, we can conclude that Operator 3 is significantly different from the other 3 Operators. Further, the Fisher Individual 95% Cis and Tukey Simultaneous 95% CIs have also bet the Operator 3 is a separate group from the remaining 3 Operators. One Independent Variable + 1 Block Variable – Randomized Block Design. The Randomized Block Design is similar to the Completely Randomized Design; however, it has a second variable, referred to as the Blocking Variable that is used to control for confounded or concomitant variables. These variables are not controlled by the researcher but affect the outcome and hence need to be blocked. The SSE (Error Sum of Squares) is segregated into SSR (Sum of Squares Blocks) and SSE (New Error Sum of Squares) SST = SSC + SSR + SSE Repeated Measure Design is a randomized block design in which each block level is an individual item/person and that person/item is measured across all treatments. It helps researchers to determine if the means of three or more measures from the same person are similar or different. The repeated measure ANOVA controls the between-subjects variance by removing it from the error term and measuring it separately. ANOVA for Latin Square Design The Latin Square Design utilizes the Blocking principle. It is used to remove two nuisance sources of variability which are in the rows and columns of the square. The rows, and columns are the two restrictions on randomization. The model is totally additive, in that there is no interaction between the treatment, rows and columns. The Analysis of Variance divides the total sum of squares into the sum of squares for the rows, columns, treatment, and error. The F test ratio of MS(Treatment)/MS(Errors) is used to determine if there is no difference in the treatment means. (MS – Mean Sum of Squares) Randomized Incomplete Block Design. When it is not possible to run all the treatment combinations in each block, the randomized incomplete block design is used. When all treatments comparisons are equally important, the Balanced Incomplete Block Design is used. This design ensures that each block is selected in a balanced manner so that any pair of treatments are selected the same number of times as any other pair. Two Independent Variables – Two-Way ANOVA In this design, two or more independent variables are explored at one time. These are also called factorial designs. In this design, each and every level is studied under the conditions of every level of all other treatments. The design can have 3,4, …, n independent variables being studied at one time. For example, the independent variables can be machines, operators, shifts, day of the week, suppliers, and raw materials. All of these independent variables can be done in one study. This will be a Six-Way ANOVA. The Completely Randomized Design, the Randomized Block Design, and the n-Way ANOVA all have one dependent variable. Chi-Square Goodness of Fit Test. This test is used to analyze the probabilities of multinomial distribution trials along a single direction. For example, to study Education with 4 possible outcomes, viz. illiterate, Primary School, Secondary School, Bachelors's and above, the single dimension is Education and the possible outcomes are the levels of education. Also, it is imperative that on one trial only one outcome can occur. The Chi-Square Goodness of Fit test measures the difference between the observed frequencies and expected frequencies. The Chi-Square Distribution is used to measure the significance. It is a one-tailed test since Chi-Square of Zero means the perfect agreement between observed and expected values. Chi-Square – Test of Independence. The Goodness of Fit test cannot be used to measure the analyse two variables at one time. For this purpose, the Test of Independence is done. Test of independence can analyse the frequencies of 2 variables with multiple categories to determine if the two are independent. Use Case. To determine if the type of pizza topping is independent of the customer's age or the citizenship is independent of investment in bitcoin. Non-Parametric tests to compare variances for more than two populations are given below One Independent Variable – Kruskal Wallis Test. This test is the nonparametric equivalent to the one-way ANOVA. It is used to check if 3 or more samples come from the same/similar or different populations. It can be used for Ordinal Data and is not based on the shape of the population distribution. It assumes that the groups are independent of each other and random selection of items in the groups. The Kruskal Wallis Test for the above data shows a p-value of < 0.05 indicating that one of the operators is statistically significant from the others. Examination of the results shows that Operator 3 is significantly different from other operators. One Independent Variable – Mood’s Median Test. It is used instead of the Kruskal Wallis test when there are outliers present in the data. The results from the Mood’s Median Test indicate a p-value of 0.003 with is significant with an Alpha of 0.05. Confidence Interval Mood’s Median Test. On observing the 95% Midian Confidence Interval of the three operators, it can be seen that the CI of Operator 3 is distinct from the other operators. One Independent Variable + 1 Block Variable – Friedman Test This is the nonparametric equivalent to the randomized block design. If the normality of the data cannot be assumed or the data is ranked the Friedman test is used. It assumes independent blocks; no interaction is present between blocks and treatments, and the observations within each block can be ranked. In the Friedman Test below, the Day of the Week is Blocked. The p-value of 0.007 < Alpha of 0.05 indicates that one of the operators is statistically significantly different. On observation, it can be seen that Operator 3 is different from the rest of the Operators. Multivariate Analysis of Variance (MANOVA). This test is used when there are more than one continuous Dependent Variables. A one-way MANOVA would examine the effect of one independent variable on two dependent variables. For example, to study the effect of education on income and expenditure. A two-way MANOVA would examine the effect of two independent variables on two dependent variables. For example, to study the effect of education and citizenship on income and expenditure. Multivariate Analysis of Covariance (MANCOVA). This test includes covariates. It involves finding out the statistical significance between multiple dependent variables (continuous) and an independent (grouping) variable and controlling with additional variables called covariates. Covariates reduce the error term hence the effect of the covariate is removed from the relationship of the independent and dependent variables. References https://medium.com/nerd-for-tech/everything-about-manova-and-mancova-4c1c237af464


 1 point
 -
1 pointParametric analysis of Variance (ANOVA) is used to compare multiple populations and even subgroups of those populations, tells us if there are any statistical differences between the means of three or more independent groups. ANOVA is extension of t-test which allowed us to test two groups if there is difference in means. If you have multiple groups, you could use t-test multiple times but a better way of doing that is through ANOVA. Anova is the ratio of Variability between and Variability within. Various ways of comparing variances for more than 2 population: One-way Anova/Single factor: One-way means the analysis of variance has one independent variable, Measures single factor from multiple sources. It helps to identify if there are significant differences between the means of independent variables. Factorial ANOVA/Two-Way Anova- Covers ANOVA tests with two or more independent categorical variables. It allows us to “account for variation” for the ROW level due to other factors as each row will have its own mean and std deviation. This allows greater focus on Group differences making it easier to detect differences. Through this we are attempting to minimize the Error variance by detecting variance. Two-way/Two-factor with replication – Measures 2 factors, but has multiple repetitions of each combinatio Two-way/Two-factor without replication/ Randomized block design - Measures 2 factors Total variance: Total variance is ratio of between groups by within groups. Larger the difference, the more likely the groups have different means and that we should reject the Null Hypothesis. a) Variation within each group b) Variation between the groups Concept of confidence interval: ANOVA tells us groups are different, but it does not tell us what the difference is. Confidence interval helps us assess the location. Pairwise comparison will lead to Type I error by compounding the error. The most important statistics in the analysis of variance table are the p-value (P), S, R2, and adjusted R2 values. Collectively, these values tell if means are significantly different from each other P-value - If P is less than or equal to the alpha level, one or more means are significantly different. - If P is larger than the a-level, the means are not significantly different. If the ANOVA results indicate that there are significant differences, we can look at the individual statistics and confidence intervals to learn more about the differences. S, R2, and adjusted R2 are measurements to show how good the model fits the data. There are multiple comparison methods: - Fisher’s LSD – This is used in conjunction with ANOVA. While ANOVA tells us if two of the groups are different from each other, Fisher’s LSD tests two specific groups against each other. - Tukey Method – For pairwise comparison after One Factor ANOVA - Scheffe Procedure – Similar to Tukey Method, this method is used when Null Hypothesis is rejected after ANOVA, this test is used to determine where the difference exists. - Bonferroni Correction – Method used to detect false positives When might you use Anova? A few scenarios as example when we might want to use Anova: · A group of patients trying three different therapies and to compare if one therapy is better than the others. · Three different types of drinks for a group of people, and compare the reaction time · Students from different colleges take the same exam, check if one college outperforms the other1 point
-
Hi Arun You will have to use data for all 25 months. There are guidelines on removing a data point while doing analysis, however looking at the description provided by you, I do not feel a need to remove any of the data points. Cp and Cpk are typically calculated for Continuous Data types, however since your metric i.e. Defects is Discrete, it is better to calculate DPU or DPMO. You may refer our calculator at the below link to calculate the current Sigma Level of the process. Enter the total sample size, the number of total defects found and number of opportunities (if known) https://www.benchmarksixsigma.com/calculators/sigma-level-calculator-discrete-data-defects/ Alternatively you could also run the Poisson Process Capability analysis in Minitab. Path is as follows Stat --> Quality Tools --> Capability Analysis --> Poisson Here you will have to enter data in columns. One for sample size and the other for defect count. Hope this helps.1 point
-
For me, if this is a highly repeated tendency, I will be sceptical as it is not just the company that chooses a candidate, it is also that the candidate who chooses a company. If it is not a highly repeated pattern, I agree with Rajesh.1 point
-
If I were the hiring manager, I would handle this on a case-to-case basis. If I see a candidate who has changed jobs frequently and I would try to enquire him/her as why these many job changes have happened. I will ensure that there is no legal or criminal record against the person (as much as I can confirm that). I will also check if it's a good bet to have a person who has made many changes , essentially to identify what X-factor he/she can bring to my organisation. That will be a key factor for me and after ascertaining the facts that why he/she jumped from other organisations and if the answers are convincing, then I will take a call accordingly. So no criminal record or legal issues, Genuine reasons for leaving organisations and X-factor (value add to the organisation) can make the candidate hired in.1 point


This leaderboard is set to Kolkata/GMT+05:30