
Topics
-
Fifty-five women engineering students completed an AI bootcamp focused on rural Karnataka. Participants developed AI-based solutions after visiting villages and conducting field interviews. The She Innovates bootcamp partnered with several organizations to achieve its goals. This initiative aims to boost women's participation in AI and entrepreneurship. It encourages AI applications for rural development and community-focused sectors. View the full article
-
Besi's quarterly orders more than doubled, fueled by AI and hybrid bonding technology. The company saw increased customer adoption of its advanced chip packaging solutions. Demand for AI applications continues to drive growth in data centers. Besi anticipates revenue growth between ten and fifteen percent. This strong performance aligns with other semiconductor sector reports. View the full article


Leaderboard
-
Rupinder N
Members1Points178Posts -
Venugopal R
Members1Points238Posts


Popular Content
Showing content with the highest reputation on 09/10/2018 in Posts
-
1 pointGreat attempt by everyone and very neatly explained that the customer will not be willing to pay the cost due to the "hidden factories". The chosen best answer is that of Vastupal for providing the explanation in great detail. Must read Venugopal's answer to understand with the help of a clearly outlined example, complete with calculations. Keep it up!1 point
-
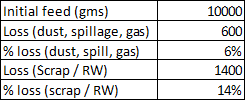
1 pointRolled Throughput Yield (RTY) is calculated by multiplying the yields for each process. Let me illustrate an application of this metric using an example. XYZ company manufactures friction material that goes into auto disc brake pads. The processes under consideration start with the Mix, which is subjected to pre-form process, and then compression molding and then grind finish. Let's assume that the standard weight of mix required for each pad is 100 gms. If 10000 gms of mix is fed into the processes, the yield for each of the 3 processes, Preform, Comp. molding and Finishing are tabulated as below: The yield for each process is calculated in the last column, and the resulting RTY is 0.8, which means that when quantity of mix equivalent for 100 pads was fed into the system, we ended up getting only 80 pads. The loss of yield can be categorized into 2 categories. 1. Due to the losses due to spillage, gaseous waste, finishing dust (SGF) 2. Due to rejections that were either scrapped or reworked. (SRW) The RTY brings out the practical yield from the process at large. If we take a six sigma project to improve the RTY (say from 0.8 to 0.9), it will lead to the revelation and analysis of the 'Hidden Factory' in terms of Scrap and Rework handling that is going on in between the processes. Further probing would lead to a question about how much of SGF wastage can be reduced. It is likely that the factories will have practices by which Reworked material for a particular process will be fed into the next process. Similarly the wastage due to spillage may be retrieved and re-routed to the preform process. The grind dust may be collected and recycled at permitted proportions into the molding process. Assume around 2% of the SGF and 8% of the SRW are re-introduced into the process, the resulting yield (if we didn't consider RTY), would have worked out as 90%, and we would have missed out on exposing and quantifying the "Hidden Factory" and the opportunity for improvement
 1 point
This leaderboard is set to Kolkata/GMT+05:30