Senthilkumar G
Lean Six Sigma Black Belt
-
Joined
-
Last visited
Everything posted by Senthilkumar G
-
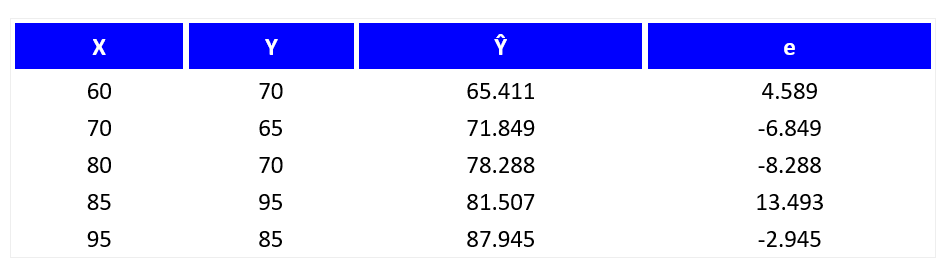
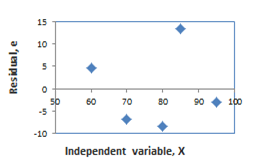
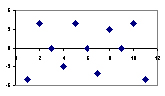
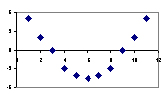
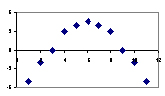
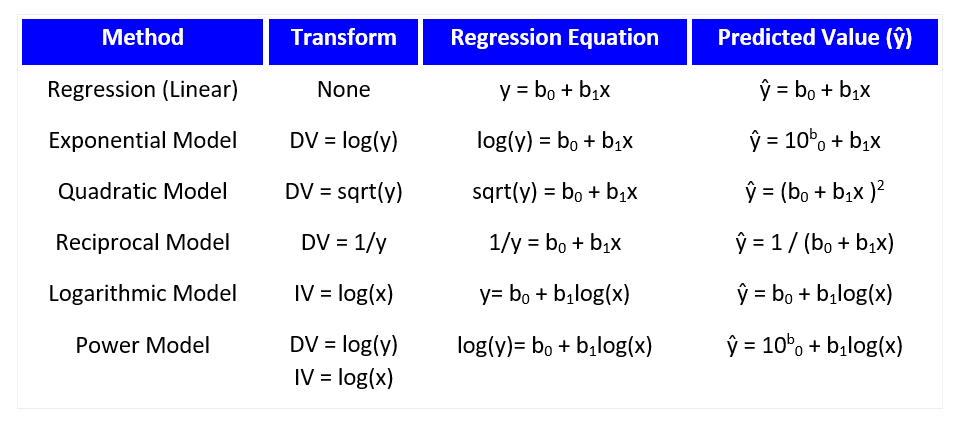
Q 271. What is a residual in Regression? Why is it important to analyze the residuals before assessing the goodness of a Regression Model? What does it mean if Residuals are non normal or non random? Residual: Cutting-edge statistics and optimization, Residuals and statistical errors are closely related and easily disordered measures of the deviation of an observed value of an element of a statistical from its “Theoretical Value”. Residual = Observed value - Predicted value The Error of an observed value is the deviation of the observed value from the true value of quantity of interest (for example: a population mean) and the residual of an observed value is the variance between the observed value and the estimated value of the quantity of interest (for example: a sample mean). The division is most important in regression analysis, where the concepts are sometimes called the regression statistical errors and regression residuals and where they lead to the concept of studentized residuals. Error Vs Residual: · The difference between the height of each person in the sample and the unobservable population mean is a statistical error, whereas · The difference between the height of each person in the sample and the observable sample mean is a residual. Residual in Regression: Since a linear regression model is not always appropriate for the data, you should assess the appropriateness of the respective model by defining residuals and examining residual plots. Residual (e) is the difference between the observed value of the dependent variable (y) and the predicted value (ŷ) and each data point has one residual. Residual = Observed value - Predicted value e = y - ŷ Together the sum and the mean of the residuals are equal to zero ( Σ e = 0 and e = 0). Notation: e = Residual y = Observed Value y’ = Predicted Value Properties: Σ e = 0 Mean of the residuals e = 0 Important to analyze the Residual Plots: A residual plot is a chart that shows the residuals on the vertical axis and the independent variable on the horizontal axis. The facts in a residual plot are randomly dispersed around the horizontal axis, then linear regression model is mostly appropriate for the particular data set; otherwise, a nonlinear model is more appropriate. The below table shows the inputs and outputs from a simple linear regression analysis. The below chart displays the residual (e) and independent variable (X) as a residual plot. The above residual plot shows a fairly random pattern, the first residual is positive and then the next two residuals are negative, the fourth one is positive residual, and the last residual is negative. This random pattern is clearly indicating that a linear model provides a moderate fit to the data. Below, the residual plots show three typical patterns for the reference. The following first plot shows a random pattern, indicating a good fit for a linear model. 1) Random Pattern: 2) Non-Random: U – Shaped: 3) Non-Random: Inverted U The above last two patterns are non-random (U-shaped and inverted U), suggesting a better fit for a nonlinear model. Residuals are non normal or non random: Non-normality or non-random of the residual plot is an indication of an inadequate model. It means that the errors the model makes are not consistent cross-ways variables and observations (ie. the errors are not random). Transformations of Variables: Once a residual plot data set to be nonlinear, it is commonly possible to "transform" the raw data to make it more linear and it will allow us to use linear regression techniques more effectively with nonlinear data. What is a Transformation to Achieve Linearity? Converting a variable involves using a mathematical operation to change its measurement scale. Generally, there are two kinds of transformations. i) Linear transformation. A linear transformation preserves linear relationships between variables. Therefore, the correlation x and y would be unchanged after a linear transformation. ii) Nonlinear Transformation: Nonlinear transformation changes (increases or decreases) linear relationships between variables and, therefore, changes the correlation between variables. By using Regression, a transformation to achieve linearity is a special kind of nonlinear transformation. The respective nonlinear transformation that increases the linear relationship between two variables. Methods of Transforming Variables to Achieve Linearity: There are numerous ways to transform variables to achieve linearity for regression analysis. Some common methods are summarized below. Perform a Transformation to Achieve Linearity: Changing a data set to enhance linearity is a multi-step, trial-and-error process method. The following steps to be performed for Transforming a data set to enhance Linearity: i) Conduct a standard regression analysis on the raw data. ii) Construct a residual plot. a. The plot pattern is random, then do not transform data. b. The plot pattern is not random, then continue. iii) Compute the coefficient of determination (R2). iv) Choose a transformation method (see above table). v) Transform the independent variable, dependent variable, or both. vi) Conduct a regression analysis, using the transformed variables. vii) Compute the coefficient of determination (R2), based on the transformed variables. a. The transformed R2 is greater than the raw-score R2, then the transformation was successful. b. If not, attempt a different transformation method. The greatest transformation method (exponential model, quadratic model, reciprocal model and etc.) will depend on nature of the original data. Healthier way to determine which method is best is to try each and compare the result (residual plots, correlation coefficients). The finest method will yield the highest coefficient of determination (R2). Reference: https://en.wikipedia.org/wiki/Errors_and_residuals https://stattrek.com/regression/residual-analysis.aspx?tutorial=AP Thanks and Regards, Senthilkumar Ganesan, Email: [email protected] Mobile: +91-7598124052.


-
Q 266. "Purple Cow" is a term that is used in Marketing and Sales. In a world that is full of "good enough" Lean Six Sigma success stories, what would be key elements of a "Purple Cow" approach in the field of Business Excellence? Purple Cow: Purple Cow is a Sales and Marketing Science or approach, Mr. Seth Godin written a book of “Purple Cow: Transform your Business by Being Remarkable” and published in 2003. The respective book presents Mr. Seth Godin’s own belief that imaginative advertising is less effective today because of disorder and advertising avoidance. The respective book advocates that companies produce remarkable products and target people who are likely to spread word of mouth about the product. The Newspaper USA Today thought it “reminds business people of the tried and true path to success. Make a Great Product”. Purple Cow Analysis: The book “Purple Cow: Transform your Business by Being Remarkable” contains of general concepts combined with great examples. The main disagreement starts with advertising is less effective that it has been, and that the only way to gain care in a market is to not only market a product in a remarkable manner., but also to have a remarkable product to market. Mr. Godin gives best samples of products and marketing programs that have been remarkable. But indicates that is no use copying these directly. Kind a note of it, “Today, the one sure way to fail is to be more boring, your one chance for success is to be remarkable”. Sales and Marketing: Mr. Seth Godin mainly focused on Marketing and Sales and provides Ten-point checklist that set out how to create a remarkable product. The key assumption that advertising is broken has been criticized as being contradicted by research. Sales and Markets for years have talked about following P’s of marketing. Some of them include: i) Product ii) Pricing, iii) Promotion, iv) Positioning, v) Publicity, vi) Packaging, vii) Pass-along, viii) Permission, & ix) Purple Cow. (Remarkable: Something Different, Interesting and Eye Catching) The above checklist for marketing, A quick way to make sure marketers done their job. If the elements are out of whack with each other (For Example: Pureed meals that you market to senior citizens but taste like a baby or children food) then the marketing message is blurred and ultimately ineffective. Marketing is not always guaranteed to work, but the way things used to be. If you got all your above P’s right, you were more likely than not to succeed. Something disturbing has happened, though. The above eight P’s just are not enough. “P” that is suddenly exceptionally important. The new P is “Purple Cow”. The Longstanding way of marketing are dead and being safe is now moreover risky. The respective product will only survive in a crowded marketplace if company stop advertising and start innovating. Cutting-edge Purple Cow marketing guru Mr.Seth Godin urges everyone involved in creating, designing or selling to think in new ways about their market, by adopting alternative approaches or solutions and companies are also ensure that usability of approaches. Ten Ways to Raise A Purple Cow in the field of Business Excellence: Marketing roughly remarkable means asking new queries and trying new best practices. The following Ten suggestions or ways to raise a Purple Cow: 1. Differentiate your Customers. 2. Pick one under-served niche to target. 3. Create Two Teams. 4. Contacts & Communication: Customer Records. 5. Getting in the habit of Doing unsafe thing for every opportunity (Best way to find-out What is working and What is not working). 6. Explore the limits. 7. Think Small. 8. Find things that are "Just not Done" in your industry. 9. Ask, "Why not?" 10. What will happen if marketers/sales person simply told the truth inside the company and to their customers? Marketers need to have above practices for the respective products and continuously to improve their marketing strategies in global market. "Purple Cow" approach in the field of Business Excellence: 1. Why advertising is losing its power. 2. How to make your product to stand out. Distance periods: i) Before ii) During iii) After Advertising 3. Why taking risks is safer than avoiding them. 4. Focus on early adopters. Five Group of People: i) Innovators ii) Early adopters iii) Early Majority iv) Late Majority v) Laggards In general, they (Innovators and Early adopters) are the one who mainly focus on new things rather than other. 5. Marketing is about inventing the product. i) Marketing is about inventing the product based on customer needs (Feedback) rather than selling the product. ii) Develop a simple slogan (Tower of PISA: Tourist attraction slogan is “It’s Leaning Tower”). 6.Targeting the Right People. 7. Don’t Fear Criticism. Diagnostic Business Analytics (Predictive and Prescriptive) will help marketers and businesses to have simulation approach in particular to deal with customer needs or opportunity. The above key elements of a "Purple Cow" approach in the field of Business Excellence will deliver remarkable success for any organization. References: https://en.wikipedia.org/wiki/Purple_Cow:_Transform_Your_Business_by_Being_Remarkable https://www.sethgodin.com/ https://www.impactbnd.com/blog/how-to-be-remarkable-in-10-simple-steps-highlights-from-seth-godins-the-purple-cow Thanks and Regards, Senthilkumar Ganesan, Email: [email protected] Mobile: +91-7598124052.
-
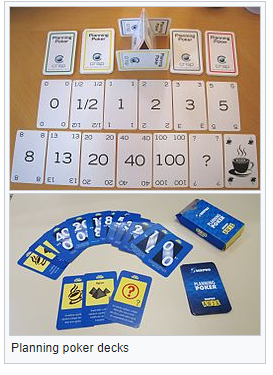
Q 265. Planning Poker is a gamified technique for estimating, more commonly used in agile software development. What is Planning Poker and how is it used in software development? What is Planning Poker? Planning Poker is also called Scrum Poker, an agile estimating or relative size of development goals and planning technique in agile software development that is consensus based. To start a poker planning session in agile software development, the product owner or customer reads an agile user story or describes a feature to the estimators. In planning poker, the respective members of the group individually make estimates by playing numbered cards face-down to the table, instead of speaking them audibly. The cards are revealed by Moderator/Agile Coach, and the estimates are then discussed. The main objective of hiding the figures in this way, the group can avoid the cognitive bias of anchoring, where the first number spoken audibly sets a precedent for subsequent estimates. Planning poker is a difference of the Wideband Delphi method, it is mostly commonly used in agile software development cycle, in particular in Scrum and Extreme Programming. Planning Poker Process in Agile Software Development: i) Rationale: The reason to use planning poker is to avoid the influence in particular of the other participants. If particular number is spoken, it can sound like a suggestion and influence the other participants' sizing. Planning poker should force people to think independently and propose their numbers concurrently. This is skillful by requiring that all participants might show their card at the same time. ii) Equipment: Each estimator in agile team is holding a deck of Planning Poker cards with values like 0, 1, 2, 3, 5, 8, 13, 20, 40 and 100, which is the sequence we recommend. The ethics represent the number of story points, ideal days, or other units in which the team estimates. The estimators discuss the feature of particular product and asking questions of the product owner as needed. Once the feature has been fully discussed with in the team, each estimator confidentially selects one card to represent his or her estimation. All the selected cards with in the team are then revealed at the same time. If all estimators nominated the same value, that becomes the final estimation for agile development. If not, then the estimators need to revisit their strategies and discuss their estimates again. The high and low estimators should share their reasons. With follow-up further discussion, each estimator reelect an estimate card, and all cards are again revealed at the same time. Poker planning process shall be repeated until consensus is achieved. iii) Procedure: At the time of estimation meeting, each estimator is given one deck of the cards. All the decks have identical sets of cards with in them. The Agile meeting proceeds as follows: i) Agile Coach or a Moderator, who will not play, generally chairs the meeting. ii) The Product Owner or Business Analyst plays a key role, provides a short overview of one user stories to be estimated. Each team is given an opportunity to ask question freely and discuss accordingly to get more clarity on assumptions and risks. The summary of the discussion is recorded by Moderator. iii) Each individual lays a card face down representing their estimate for the story. During Agile estimation revealed discussion, numbers must not be mentioned at all in relation to feature size to avoid anchoring. iv) Everyone calls their cards simultaneously by turning them over. v) People with high estimates and low estimates are given a soap box to offer their justification for their estimate and then discussion continues. Soapbox: A soapbox is a high platform which one stands on to make impromptu speech independently, often about a political subject. vi) Repeat the estimation process until a consensus is reached. vii) To ensure that discussion is organized and well structured; the Chairperson/Moderator or the Product Owner may at any point turn over the egg timer and when it runs out all discussion must conclude and another round of poker is played. The construction in the conversation is re-introduced by the soap boxes. Agile Perspective due to the Impact of COVID-19 Global Outbreak: Due to the impact of COVID-19 global outbreak, Many Organizations over the globe is making powerful changes to adjust to the new virtual reality, digital transformation in fourth industry revolution (Industry 4.0/Service 4.0), moving all the possible functions online including Training, Team meeting and Stakeholders making decisions with social distance, HR, Marketing, Sales, Finance and Cyber Security and HSE systems, and naturally, IT. Agile business analysis ensures that information is available to the agile team at the accurate level of detail at the exact time. The strong agile team should be formed with Lean mindset and scaled agile business planning as well. Agile Business analysts help agile teams to answer the following important questions: i) What need are we trying to satisfy? ii) Is that need worth satisfying? iii) Should we deliver something to satisfy that need? iv) What is the right thing to do to deliver that need? Business Analysis Core Concept Model in Agile Software Development Cycle: Agile team might consider BACCM (Business Analysis Core Concept Model) while estimating Agile software development cycle or incremental approach under any critical situations. 1. Value 2. Solution 3. Need 4. Stakeholders 5. Context 6. Change. Definition: We as an Agile Team to deliver a Value from a Solution to a Need of Stakeholders within Context of Change. Organizations new to the agile mindset and practices, a primary focus on continuous improvement, ongoing changing behavior, faster and high-quality delivery and making growth enables the organization to move towards culturally adopting the agile mindset. Adopting the agile attitude refers to the cultural adoption of agile principles as opposed to the organization considering agile as a methodology or practice to be implemented. During agile initiatives, scope is constantly evolving which we cannot avoid. This is managed by the product backlog list by respective product owners which is continually reviewed and re-prioritized. This process contributes to the refinement and redefinition of scope in order to meet the evolving and emerging business need. If a major change emerges that significantly impacts the overall value and goals for the project, the respective agile project can be adjourned and reassessed based on following. i) Breadth of Change ii) Depth of Change iii) Value and Solutions Offered iv) Delivery Approach. v) Major Assumptions. Before deciding Agile implementation in any Organization, an agile sponsor understands and accepts the following: i) Use of adaptive planning (Change driven) over predictive planning (Plan driven), ii) Use and value of a fixed period of time for a work cycle (Agile software development or Incremental), and iii) Need and value of the sponsor’s engagement, participation and collaboration. Benefits: Planning Poker leads to better estimate is because of business analysis brings people together and ensures that multiple expert opinions with the agile development or incremental approach team at right time. Because these experts form a cross-functional team from all disciplines on a software development project, they are better suited to the estimation task and simplification. Planning Poker business technique provides the following major benefits in Agile Software Development: i) Accurate Estimates on Time ii) Equal Voice/Equal Contribution (Agile Team) iii) Facilitating Team Coordination iv) Facilitates Implementation Strategy v) Empowered Agile Team and Self-Organizing. vi) Focus on Business Value (Stakeholders) vii) Faster and high-quality delivery (Lean) viii) Continuous Improvement References: https://en.wikipedia.org/wiki/Planning_poker https://www.mountaingoatsoftware.com/agile/planning-poker https://www.iiba.org/ Thanks and Regards, Senthilkumar Ganesan. Email: [email protected] Mobile: +91-7598124052.
-
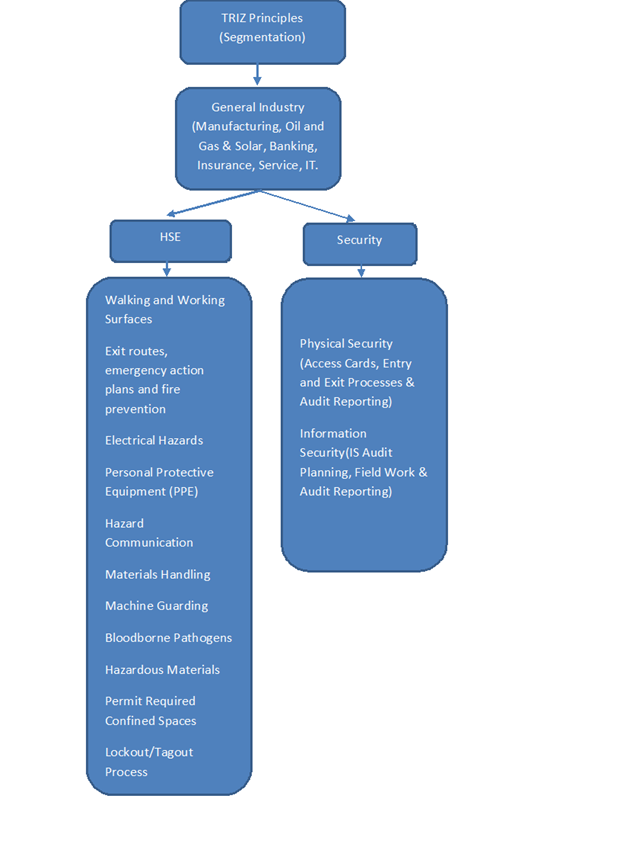
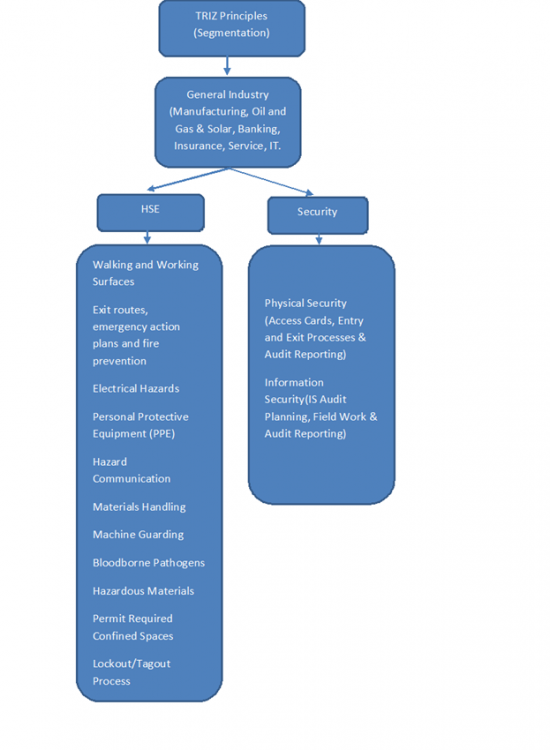
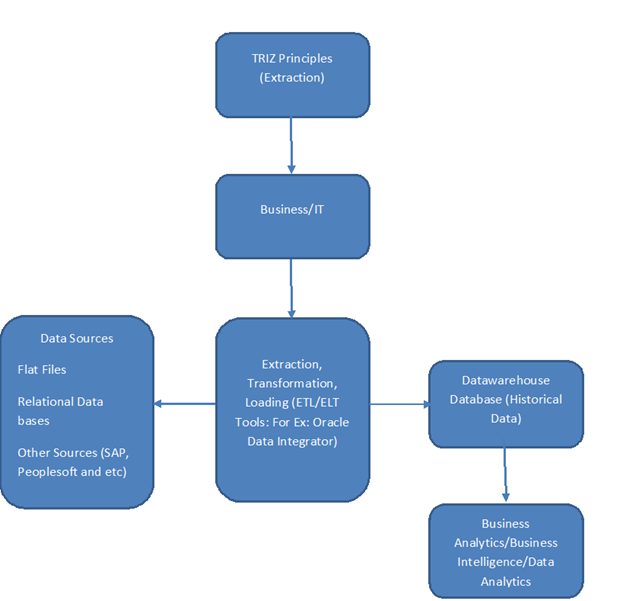
Q 264. What is the concept of Contradictions and Inventive Problem Solving in TRIZ? How can a contradiction be resolved without a compromise? Explain with examples from different domains. TRIZ: TRIZ is a Problem-solving science and Russian acronym for the “Theory of Inventive Problem Solving,” an international system of creativity developed by Soviet Scientist Genrich Altshuller and his colleagues between 1946 and 1985. TRIZ includes universal principles, a practical methodology and tool sets, an innovation Knowledge and model-based technology for generating innovative solutions for Problem Solving. TRIZ Principles are mostly used in Product Development, Design Engineering and Process Management: i) Problem formulation ii) System analysis iii) Failure analysis iv) Patterns of system evaluation TRIZ research has produced three primary findings: 1. The Incidents/Issues/Problems and solutions are repeated across industries and sciences 2. The patterns of technical evolution are also repeated across industries and sciences 3. Scientific effects outside of the field. TRIZ practitioners apply all these findings in order to improve Products in Product Development Life Cycle, Services in Service Design and Service Delivery Life Cycle, and Systems in System development Life Cycle. Contradictions: Cutting-edge traditional reason, a contradiction consists of a mismatch between two or more propositions. Contradiction usually happens when the proposals or suggestions, taken together, yield two conclusions which form the rational, usually conflicting each other. TRIZ recognizes two categories of Contradictions: 1) Technical Contradictions: These are classical engineering “Trade-offs”, where we could not reach desired state because something new preventing from system. In other words, when something gets better, something get automatically gets worse. For Example: Service is customized to each customer (Good), But the Service delivery system gets more complicated. 2) Physical or Inherent Contradictions: The situation in which an object or system suffers contradictory, opposite requirements. For Example: Software should be complex (to have integrated features), but simple (to be easy to learn more quickly) TRIZ Problem Solving Method: TRIZ is a powerful methodology for creative problem solving based on logic, data and research rather than institution. TRIZ Key Points: TRIZ is a system of creative problem solving, commonly used in engineering design, product development and process management. TRIZ follows four basic steps: 1. Define your specific Incident/Issue/Problem. 2. Find the TRIZ generalized problem that matches it. 3. Find the generalized solution that solves the generalized problem. 4. Adapt the generalized solution to solve your specific problem. Most problems stem from technical and physical contradictions. At least one TRIZ principle can be applied to specific problem and laws to eliminate these contradictions, and you can solve the problem very easily. TRIZ Concepts and Techniques: TRIZ comes with a range of ideas and techniques beyond the basic principles outlined above. Some are conceptual and analytical, such as: i) Continuous Improvement of System tends to become more reliable and stronger. ii) Functional Modeling, Analysis and Trimming. TRIZ uses these above methods to define problems. iii) Locating the Zones of Conflict or Root Cause Analysis. iv) Prescriptive: The Laws of Technical Evaluation and Technology Forecasting. Summary of TRIZ Principles: The following 40 Principles described in table to allow the development of many solution concepts for every technical problem without introducing a compromise. Implementing a selected concept still remains the work of responsible/accountable person (RACI Matrix). TRIZ identifies these principles, and uses them to make creative process in General and Construction Industry (More Predictable). Summary of 40 Principles 1 Segmentation 21 Rushing Through 2 Extraction 22 Convert Harm into Benefit 3 Local Quality 23 Feedback 4 Asymmetry 24 Mediator 5 Consolidation 25 Self Service 6 Universality 26 Copying 7 Nesting 27 Dispose 8 Counterweight 28 Replacement of Mechanical System 9 Prior Counteraction 29 Pneumatic or Hydraulic Constructions 10 Prior Action 30 Flexible Membranes or Thin Films 11 Cushion in Advance 31 Porous Material 12 Equipotentiality 32 Changing the Color 13 Do it in Reverse 33 Homogeneity 14 Spheroidality 34 Rejecting and Regenerating parts 15 Dynamicity 35 Transformation of Properties 16 Partial or Excessive Action 36 Phase Transition 17 Transition into New Dimension 37 Thermal Expansion 18 Mechanical Vibration 38 Accelerated Oxidation 19 Periodic Action 39 Inert Environment 20 Continuity of Usual Action 40 Composite Materials TRIZ Principles and its examples with Different Domains: Eliminate Contradictions Scenario 1: Segmentation a. Divide an object into independent parts. b. Brand an object sectional for easy assembly or disassembly. c. Increase the degree of an object’s segmentation. The following flow chart describes the TRIZ principle for Segmentation. For example, HSE and Security could be divided into independent parts for any organization. We could implement PDCA (Plan-Do-Check-Act) cycle to increase the degree of an object’s segmentation. Apply this TRIZ principles on regular basis and eliminate particular contradiction without compromise. Scenario 2: Extraction (Extracting, Retrieving, Removing) a. Extract the improvement or disturbing part from an object or data source. b. Extract only the necessary part or property from an object or data source. The following process flow chart describes extraction process (ETL Process: E-Extract, T- Transformation, L-Loading Process) from various data sources and those improvement part (data’s) moved to data warehouse for further analytical purpose. Business intelligence reporting systems get benefited almost all the industries/domains. Historical data are very helpful to predict the future, apply this TRIZ principles (Extraction) on regular basis and eliminate particular contradiction without compromise. TRIZ approach brings repeatability, predictability and reliability to the problem-solving process and delivers a set of innovative Products, Services and Systems. The most of the problem stem coming from Technical and Physical contradictions, apply TRIZ principle and laws without contradict to other principle and eliminate contradictions without compromise. References: https://en.wikipedia.org/wiki/TRIZ https://www.triz.org/triz/principles https://www.mindtools.com/pages/article/newCT_92.htm https://www.oshaeducationcenter.com/oeca/member-login/ https://www.isaca.org/membership/membership-benefits Thanks and Regards, Senthilkumar Ganesan, Email: [email protected] Mobile: +91-7598124052

-
Q 263. Hammurabi Code - one of the first law ever written suggests to have one's own skin in the game thus entrusting a moral obligation for fair play. Highlight some of the innovative ways of implementing such moral obligation in an organization? Hammurabi Code: The code of Hammurabi is a Legal and Ethical Science and well-preserved Babylonian code of law of ancient Mesopotamia, dated to about 1754 BC, the 6th Babylonian King Hammurabi endorsed the code and it is one of the very oldest texts of significant length in the world. It consists of 282 laws with scaled penalties adjusting “an eye for an eye”. Eye for an Eye: If Someone does X, then Y will happen, the simple example is the “Eye for an Eye” principle. In that Case, the rule was that punishment must be exactly equal to the crime irrespective of gender. The law of twelve tables of Rome simply prescribed the particular penalties for particular crimes. The actual meaning of the principle “Eye for an Eye” is that a person who has been injured by another person returns the criminal action to the originator in compensation or that an expert does so on behalf of the injured individual. The root principle of this law is to provide reasonable payback to the convicts. Hammurabi Code History: Hammurabi ruled from 1792 to 1750 BC according to the middle chronology, at the head of the stone slab is Hammurabi who feared God, he received the law from Shamash (Sun God, God of Justice, morality and truth and the Queen of Heaven). Hammurabi bring about the rule of righteousness in the land, to destroy the wicked and the evil-doers so that the strong should not harm the weak. Totally 282 laws were agreed in 44 columns and 28 paragraphs in an organized way and one of the oldest writings, some follow along the rules of “an eye for an eye”. Hammurabi Law Codes may cover the following Laws: The following laws may cover Hammurabi codes and also innovative ways of implementing laws in an organization. 1) Economic Provisions (Prices, Tariffs, Trade, Commerce) 2) Contract & Liability Law (Contracts, Terms and Liabilities) 3) Family Law (Marriage and Divorce) 4) Children Law 5) Criminal Law (Assault, Theft) 6) Civil Law (Slavery, Dept) The code of Hammurabi was trying to attain the following: 1. Equality 2. Partiality 3. Consistency 4. Damages 5. Retribution 6. Biases Laws covered: The respective Laws covered such subject as: 1. Slander 2. Fraud 3. Slavery and Status of slaves as property 4. The duties of workers 5. Theft 6. Trade 7. Liability 8. Divorce 9. Adultery 10. Perjury Innovative ways of implementing Hammurabi code in an organization: The following simple flowchart provides innovative ways of implementing such moral obligation in an organization. Steps 1: Corporate HR – Policy and Diversity & Inclusiveness (Harassment & Discrimination), Corporate Finance, Corporate Strategy/HSE/Security/Risk & Corporate Legal, Ethics & Behavior team together to incorporate Hammurabi codes after considering each subjects of law covered. Step 2: The respective Hammurabi Codes and Law reviewed by respective team as mentioned in Step 1. Steps 3: The respective laws covered for such subjects reviewed by respective team as mentioned in Step 1. The respective solutions and Performance measures reviewed by respective team before implementing Hammurabi Law codes in an Organization. Solution Evaluation: The following key tasks, purpose and respective inputs may consider during Hammurabi Laws code evaluation. Continuous data output of a well controlled process with controlled inputs are likely to follow a Normal Distribution. i) Measure Solution Performance (Inputs: Business Objective, Implemented Solution) ii) Analyze Performance Measure (Inputs: Potential Value, Solution Performance Measures) iii) Assess Solution Limitations (Inputs: Implemented Solution, Solution Performance Analysis) iv) Assess Enterprise Limitations (Inputs: Current State Description, Implemented or Constructed Solution, Solution Performance Analysis) v) Recommend Actions to Increase Solutions Value. (Inputs: Enterprise Limitation, Solution Limitation) Step 4: Comply and Declaration would be done by all Employees/Contractors/Vendors. (Once in a 6 months or a year) Step 5: The final output as mentioned in the flow process flow chart, greater performance and high-quality results can be accomplished from respective organization. The above innovative and easy ways of implementing Hammurabi codes, Laws and Subjects are provided for respective team to review in any organization. Team need to deeply review and evaluate the solution before implementation. The respective employees will comply & declared once in a year accordingly. References: https://en.wikipedia.org/wiki/Code_of_Hammurabi https://www.iiba.org/ Thanks and Regards, Senthilkumar Ganesan, Email: [email protected] Mobile: +91-7598124052


-
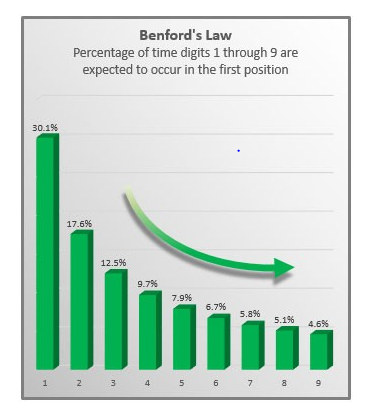
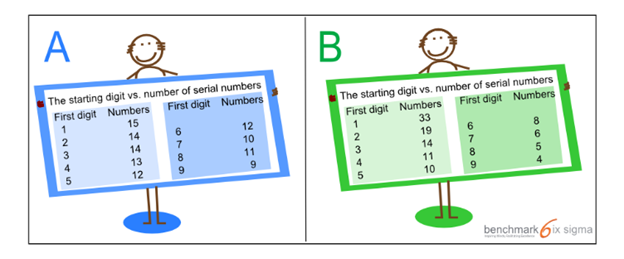
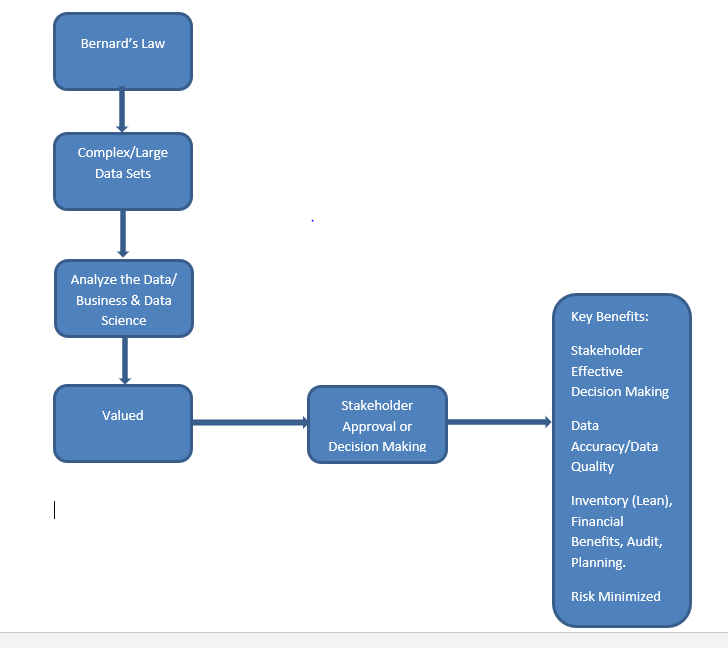
Q 262. According to Benford's Law - "In any collection of statistics, a given statistic has roughly a 30% chance of starting with the digit 1". What are some of the business applications of this law? Hint: Refer the link - https://www.benchmarksixsigma.com/how-to-find-if-a-data-set-is-genuine/ Benford’s Law: Benford’s Law is a Legal Science and Ethical framework driven also called the NewComb-Benford’s Law, the law of anomalous numbers or First Digit Law, is an observation about the frequency distribution of leading digits in many real-time diverse data sets of numerical data. Benford’s Law is mainly used for fraud detection in scientific or any technical publications or research and exploration oriented that may give positive results. When to Use Benford’s Law: Benford’s Law maintains that the numerical 1 would be the leading digit in a data set of numbers 30.1%, Next, the numerical 2 will be the leading digit 17.6%. The numeral starting from 3 through 9, will be the leading digit with decreasing frequency. This expected number of leading digits can be illustrated as shown in the chart "Benford's Law." Microsoft Excel can count the leading digits contained in virtually any data set, chart the findings, and compare the respective results to Benford's curve to see if that particular data set obeys the expectations set by Benford's Law. Benford’s Law: Why this works. With respect to non-technical description, Benford’s Law works whether you are counting dollars, inventory, populations and acres, because we must count 1 before counting 2,3 or 4 and so on. Every counting starts with lowest numbers. With this respective simplified counting exercise, we can see Benford's Law at work—rather than each digit having an equal chance at being the first digit, lower numerals always have a greater chance of leading digit as compared to higher numerals. In following Chart, which data set is more likely to be Genuine? Scenario: Financial Complaints system (Financial Audit) With respect to recollect the categorization logic of above chart A &B, Chart B shows the number of complaints marked against their first digit of serial number. The Chart B complaints trends shows an unusual pattern and it need more clarity on specific data sets. With respect to further analysis as well as to be more specific, the number of complaints starting with digit 1 is higher than those starting with 2 and so on. With respect to Benford’s law, we wanted to use a method that will ensure that data will not look fudged or corrupted. After looking all these data, Benford’s law does not apply because of above Chart B values are not distributed across multiple orders of magnitude. The Benford’s law does apply to a large number of different or complex data sets as prescribed below: Larger data sets: i) General Ledgers, ii) Trial Balance Reports, iii) Income Statements, iv) Balance Sheets, v) Invoice Listings, vi) Inventory Listings, vii) Depreciation Schedules, viii) Investment Statements, ix) Account Payable and Receivable Reports, x) Expense Report, Time Sheet Data, Portfolios & xi) Electricity Bills, Stock Prices, Tax calculations, Death rates. It tends to be more and more accurate when you have a multiple order. We need to simulate this exercise in excel more precisely so that we could avoid repeated numbers, duplication digits and we can also search “random numbers in excel without repeats” on SearchEncrypt.com & Google and you shall find a more suitable method. We also need to ensure Benfords law where we can apply and which data sets will give positive results. Equal Opportunity: Data sets must contain data in which each number 1 through 9 has an equal chance of being the leading digit otherwise Benford’s law does not apply in the above larger data sets. No Definitive Proof: Benfords law calculation can never definitely prove or disprove the presence or absence of genuine numbers. Based on the results, Financial portfolio colleague to have deeper analysis about the results and move forward accordingly. A simple visual examination (Visual Management) of the resulting chart will helpful to raise questions or concerns with the data—if the chart doesn't closely follow Benford's curve, then consideration should be given to scrutinizing the data more carefully. Benford’s law importance in real time Business and Data Science: The following simple process flow chart providing inputs together about Benford’s law importance in real time Business and Data Science: The above integrated article shows how the Benford’s law can be used effectively to detect financial statement frauds. Kindly note, Benford’s law should not be used as a final decision-making tool by itself, it may prove to be a useful screening tool indicate that a set of financial statements, reports and portfolios deserves a deeper analysis. References: https://www.benchmarksixsigma.com/how-to-find-if-a-data-set-is-genuine/ https://en.wikipedia.org/wiki/Benford's_law https://www.journalofaccountancy.com/issues/2017/apr/excel-and-benfords-law-to-detect-fraud.html https://towardsdatascience.com/what-is-benfords-law-and-why-is-it-important-for-data-science-312cb8b61048 Thanks and Regards, Senthilkumar Ganesan. Email: [email protected] Mobile: +91-7598124052
-
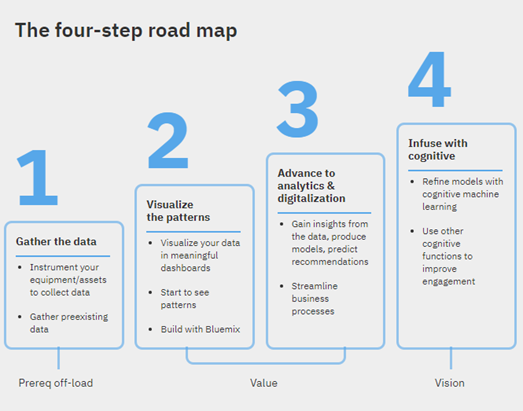
Q 261. While Industry 4.0 focuses on usage of new age technology in manufacturing, Service 4.0 focuses on doing the same to provide unparalleled customer experience in the service sector. What are the salient features of Service 4.0? Industry 4.0: Industry 4.0 is the technology science driven and subset of fourth industry revolution. It encompasses areas which are not normally classified as an industry such as smart industry for instance. Industry 4.0 is the trend towards automation, data exchange in manufacturing processes which include cyber physical systems (CPS), the Internet of Things (IoT) and Industrial Internet of Things (IIoT), cloud computing, cognitive computing and Artificial Intelligence (AI). Industry 4.0 Revolutions Timeline: Industry 4.0 Drivers: Business and Data analytics are their core capabilities, Industry 4.0 is mainly driven by: i) Digitization of products and service offered by respective product owned companies. ii) Digitization and integration of vertical and horizontal value chains. iii)Digitization business and business process models and customer access Industry 4.0 Impact and Evolve the Process in Manufacturing: Scenario: To understand the impact of Industry 4.0 solutions, True transformation happens when all unique challenges and targeting pain points from Manufacturing Personnel in IIoT Ecosystem. The same kind of scenarios are applicable in IoT and Cognitive Computing as well. a. Maintenance Engineer/Maintenance Manager b. Manufacturing Operator/Process Operator c. Plant Engineer/Plant Manager d. Technician, Diagnostics, Repair Installations The four- Step road map for Industry 4.0: Industry 4.0 Challenges: The following challenges are identified in implementation of Industry 4.0. Economic Challenge: I) High Economic costs II) Business model adaptation III) Unclear economic benefits/excessive investment Social Challenge: i) Privacy concerns ii) Surveillance and distrust iii) Threat of redundancy of corporate IT department Political Challenge: i) Lack of regulation, standards and forms of certifications ii) Unclear legal/regulatory issues and data security Organizational Challenge: i) IT security issues. ii) Reliability and stability. iii) Integrity. iv) Lack of adequate skill-sets to expedite the transition towards the fourth industrial revolution. Service 4.0: Service 4.0 is a collective term for technologies and concepts of service and support function organizations which based on new disruptive technologies concepts as mentioned below. i) Big Data and Mobility ii) Internet of Things (IoT) iii) Internet Services Service 4.0 is an equal capable and similar concept of Industry 4.0 which delivering excellent transformation and its services along with digital capability to various customer in this decade. Digital transformation with the above disruptive technologies is quite challenge now-a-days to evolve but they will gain sustainable competitive advantage after Service 4.0 transformation that helps companies meet their customer needs. Successful implementation of Service 4.0 provides the basis for a step change in performance including customer satisfaction beyond traditional lean improvement and reduction in overall costs. Business Strategies: The following important business strategies are giving best outcome to Industry 4.0 & Service 4.0. i) Strong Customization of Products ii) Autonomous – Self Optimization, Tuning, Configuration iii)Self-Diagnosis, Cognition and Intelligent Support Service 4.0 Key Benefits: The following key benefits are identified for Service 4.0 Transformation: i) Greater Flexibility and Adaptability ii) Faster, Speed iii) High Productivity iv) Better Quality v) Performance Improvement vi) Reduction in Costs. Service 4.0 Offering: The following important services offered by service providers based on customer needs. 1. Pro Active. 2. Integrated, Bundled Package 3. Customized, Human Centered 4. Data Driven Assessment or Evolve before Service 4.0 Transformation: A transformation must address the following four major elements. 1. Service Providers Operating Model 2. The Organization 3. People 4. IT For Successful Service 4.0 transformation, companies must be in a position to evolve or assess the following: i) Employees/contractors/vendors ii) Hiring New Talents with capabilities of Digital Technologies such Big Data, Cloud and Cyber security and Safety skills. iii) Pilots iv) Incremental or Agile development approach v) Customer focus or Enabling Process vi) Service Transformation initiative Salient futures of Service 4.0: The following technologies enable the digital transformation and it promote the greater efficiency throughout the value chain. i) Big Data and Analytics. ii) RPA – Robotic Process Automation. iii) Bionic Computing. iv) Internet of Things. v) Cloud Computing. vi) Cognitive Computing. vii) Smart Devices. viii) Virtualization. Industry 4.0 and Service 4.0 are similar concepts and applied to value chain. It promotes greater performance, cost savings and high quality based on customer/consumer needs. References: https://en.wikipedia.org/wiki/Industry_4.0 https://en.wikipedia.org/wiki/Service_4.0 https://www.bcg.com/en-in/capabilities/operations/service-4-0-transforming-customer-interactions.aspx https://www.ibm.com/industries/industrial/resources/smart-manufacturing-optimization/ Thanks and Regards, Senthilkumar Ganesan, Email: [email protected] Mobile: +91-7598124052.

-
‘Analysis Paralysis’ and ‘Extinct by Instinct’: Analysis Paralysis (or Paralysis by Analysis) is the result of Behavioral Science driven and it defines an individual or group process when over processing, over analyzing or overthinking of any critical situation could cause forward motion or decision making to become more paralyzed meaning that no solution or course(s) of action is decided upon. The situation may be too complicated and decision is never made with respect to the fear of change that a potentially larger than problem may arise. A Person or Individual or Group and Leadership should take an immediate decision with less or agreed time frame based on the Business Analytical solutions. A person may desire the perfection solution, but may fear that a decision that could result in error, while on the way to a better solution. On the other end of the time spectrum is the phase extinct by instinct, which is making a fatal decision based on hasty judgement or a get reaction. Analysis Paralysis is generally happened due to fear of either making an error, outweighs the realistic expectations or potential value of success in a decision made in a timely manner. An overload of options, can overwhelm the respective situation and causing this “Paralysis” rendering one unable to come to a conclusion. It should be a larger problem in many critical situations where decisions need to be reached, but a leader or person is not able to provide a response last enough potentially causing a very bigger issue than they would have. Leader should take a decision based on the data availability, past experience and how risk was handled with mitigation. Business Analysis Core Concept Model: A Person or Group and Leader who ever is taking a decision in any large organization should consider the following Business Analysis Core Concept model under any critical situations. 1. Value 2. Solution 3. Need 4. Stakeholders 5. Context 6. Change. Definition: We deliver a Value from a Solution to a Need of Stakeholders within Context of Change. Decision Making: A person or Individual or Group and Leadership must be an effective in understanding the criteria involved in making a best decision and also in a position to assist others to make better decisions under critical situations. Business Analytics Practices (Iterative Methodical Exploration): Data Driven Decision Making Include: i) Descriptive Analytics ii) Predictive Analytics iii) Prescriptive Analytics Effectiveness Measures during Decision Making Process Include: Measures of effective decision making include: i) The Respective Stakeholders are presented or available in the decision-making process. ii) Stakeholders understand the decision-making process end to end and the rationale behind each decision. iii) The pros and cons of all available options are clearly communicated to stakeholders. iv) The best decision reduces or eliminates Risk, and any remaining uncertainty is accepted. v) The decision made addresses the opportunity at hand and best interest of all stakeholders. vi) All stakeholders understand all the conditions, Environment, and measures in which decision will be made vii) A Best decision is made What causes analysis paralysis? Analysis paralysis establishes itself in the inability to make a best with respect to overthinking and over processing the available options, possibilities and data. It's one of the main and major causes for project interruptions, exhausting project level planning sessions (PLP and PLC Processes), the gathering of unnecessary data, and slow movement between every phases or stages. 1. Personal Analysis: Causal personal analysis can occur during decision making process. With respect to overwhelming information and data on hand and fear of change or taking decisions, unable to make a rational decision by decision maker. 2. Conversational Analysis: Analysis paralysis can occur at any time regarding any issue in typical conversation and either analysis paralysis or Extinct by Instinct not been predicted by business. It is likely to occur during conversation, elevated and intellectual discussions. During such intellectual decision-making process or intellectual discussions, analysis paralysis involves the over analysis of a specific issue to that point where that issue can no longer be recognized or accepted, and actually the subject of the conversation is lost. It can also lead to major risk in such large organization. Business analysis core concept model will deliver the best decision during decision making process or intellectual decision-making discussions. Preventive and Overcoming: The following possible ways help to prevent or overcome of analysis paralysis and Extinct by Instinct. 1. Set Limits 2. Clarify Objectives and Priorities 3. Perfection is not the key 4. Incremental development or Agile approach rather than Waterfall, based on methodologies defined in Project Management Plan. 5. Stakeholders involvement during Analysis Phase. 6. Defining Scope of the Project. 7. Define Goals and Deliverables in well advance. 8. Define the Success Criteria. 9. Take small Iterative steps 10.Regression 11.Change Number of options. 12.Add or Remove emotion 13.Random selection 14.Talk about it 15.Make your best decision Business Analysis key Techniques to prevent from Analysis Paralysis and Extinct by Instinct: The following overall integrated, best and powerful Business Analysis Techniques can be used to make best decision in large organization. These techniques are helpful to avoid 'Analysis Paralysis' and 'Extinct by Instinct'. 1. Interviews 2. Legal/Regulatory Information. 3. Survey or Questionnaire 4. Workshops 5. Presentations 6. Assess Requirements Changes (With respect to Cost and Time estimates, Benefits, Risks, Priority and Course of Action) 7. Decision Modelling (Decision Trees, Decision Requirements Diagram) 8. Bench Marking and Market Analysis 9. Business Cases 10.Business Rules Analysis 11.Data mining 12.Estimation 13.Observation: Active/Noticeable, Passive/Unnoticeable. 14.Stake holders List, Map and Personas Important Business Analysis Techniques Explanation (Random Basis): i) Bench Marking and Market Analysis: The objective of market analysis is to acquire this information in order to support the various decision-making processes within an organization as well as improve organizational operations, increase customer satisfaction and increase value to respective Stakeholders. ii) Decision Trees/Decision Requirements Diagram: A decision requirements diagram is a visual representation of the information and data, knowledge, and decision making involved in a more complex business decision. Key elements: Decisions, Input Data, Business Knowledge Models, and Knowledge Sources. The above nodes are linked together into a network to show the decomposition of complex decision making into simpler building blocks. Guideline and Tools: The following Business guideline and tools can be used to avoid Paralysis Analysis. 1. Governance Approach 2. Policies 3. Validate Performance Measures With respect to Analysis Paralysis and Extinct by Instinct, the above Business Analysis Guideline & tools and Techniques along with preventive and overcoming ways method will helpful to Organize organization data with high accuracy. High quality data would be used for data driven decision making which definitely avoid overthinking, over processing, fear of change & confusion and so on. The respective data outputs/outcome will definitely provide more confidences to Leadership or Decision maker to make effective decision on time with safe and secure manner. References: https://en.wikipedia.org/wiki/Analysis_paralysis https://en.wikipedia.org/wiki/Extinct_Instinct https://www.iiba.org/ https://businessanalystlearnings.com/blog/2014/2/10/managing-analysis-paralysis Thanks and Regards, Senthilkumar Ganesan, Email: [email protected] Mobile: +91-7598124052.
-
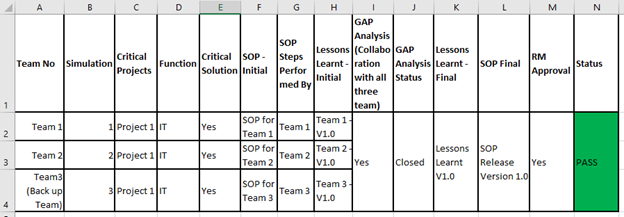
Q 259. Even with detailed SOPs, workers are unable to follow the instructions and end up making errors. Usually the RCA obtained is - 'I forgot'. Could there be an issue in the way SOP is written? What is Instruction Creep and how can process owners avoid it while creating process SOPs? Instruction Creep: Instruction Creep is a phenomenon and Operational Science & Engineering driven that occurs common in Large Organization. Short and Simple descriptions, straight to the point should allow knowledge to become accessible for respective learners. Instruction creep can also lead to uncertainty and misunderstanding, it will also affect the bonding and internal relations ship within the same organization. Could there be an issue in the way SOP (Standard Operating Procedure) is Written? SOP is written by Project Delivery Team and collaboration with operational team together in most of the organization. Project delivery team must be in a position to engage and should have a strong collaboration with operations team till to complete the Integrated Standard Operational Procedure Document (SOP’s) without errors. The following Key Process and Technical Skills are required to complete the SOP: 1. Engagement 2. Collaboration 3. Respect 4. Performance 5. Verification 6. Validation. For every incident in large organization, based on RCA (Root Cause Analysis) or 5 whys techniques, either standard operational procedure document not been updated, or Person not reading the instructions, or not understand the instruction clearly, or Technological gap and Skill gap only. When instructions appear to be overwhelming made human to do more mistakes in Operational activity. Step by step standard procedure document to be prepared by project delivery team along with operational team together based on the number of exercises/iterations/simulations are done by operations team. Over all, the final collective inputs from various team would definitely helpful to achieve the strong SOP’s in large organization before handing over to Business Operations. What is Instruction Creep and how can process owners avoid it while creating process SOP's: Instruction Creep is a phenomenon and Operational Science & Engineering driven that occurs common in many Organization. Short and Simple descriptions, straight to the point should allow knowledge to become accessible for respective learners. The large organization should have the following practice to revisit their Business Analysis beyond the Projects while creating strong process SOP’s. Business Analysis Beyond the Project: 1. Pre-Project (Project Rationale) 2. Project (Delivery) 3. Post Project – Benefits Realization. We need to analyze the following Business Analysis Knowledge Area while Project (Delivery) phases, it is possible that information creep could be avoided before handing over to Business Operations. 1. Strategy Analysis (Business Requirements), 2. Requirement Analysis and Design Definition (Stakeholder & Solution Requirements) and 3. Solution Evaluation (Transition Requirement: Proof of Concept, Prototype) My Personal View about Instruction Creep: Instruction Creep is a phenomenon and Operational Science & Engineering driven that occurs common and we need to have an ideality to achieve zero errors in SOP’s written in large organization. Instructions creep may happen with respect to Project delivery schedule pressure or Cost overrun in any projects. This has to be planned in well advance. We need to engage constantly with the vendors and contractors for number of simulations along with project execution team/operations team together before SOP’s written or before handing over to Business Operations. There may be a gap in Project delivery versus Operations team with respect to project delivery schedule pressure or cost overrun. Employers may represent one person from Operational Excellence, HSE, Cyber Security, Business Communication (In Country Value), Ethics and Behavior, Regulatory Compliance, Diversity and Inclusiveness (D&I), Change & Knowledge Management, Training, Auditing and Social Responsibility team together with project team while under critical project development phases in large organization so that their collective inputs will be helpful to avoid information creep. It will also helpful to deliver the SOP’s without errors and added value to the bottom line of large organization. Scenario 1: The following simple matrix shows the overall output for Strong SOP’s written. Steps: 1. There are three team together would be having various iterations/simulations schedule separately for the same critical project before handing over to Business Operations. 2. Standard Operational Procedure (Initial) steps performed by respective team for the same project. 3. GAP analysis would be done based on the Lessons learnt (Initial) prepared by respective team. 4. After analyzing the GAP, Lessons learnt (Final Version) and Standard Operational Procedure (SOP – Final Version) document would be released after performing final simulation with same team before handing over to Business Operations. Standard Operational Procedure Document (SOP): SOP- Standard Operational Procedure Document may have a short and simple explanations to the point and allow knowledge to become accessible to users. SOP should also contain about document authorization and document controller along with revision history in case of any future change. For any change in SOP, we should have the Change Management process request along with proper evidence to get an approval from respective function. The following Major elements to be included in SOP’s: 1. Document Authorization. 2. Revision History 3. Related Business Process 4. RACI Matrix 5. Architecture (Logical Architecture, Physical Architecture) 6. Assets List/Asset Register Lists. 7. Business Communication, Vendor & Contractor details. 8. Technical Design, Support Document references. 9. Performance Monitoring 10. Step-out and Approval. Plan-Do-Check-Act Cycle: PDCA is a method used in Business that can enable team to control and improve process continuously (Continuous Improvement). This cycle could be followed with number of iterations so that the respective SOP (Standard Operational Procedure) document will be delivered without errors. Reference: https://en.wikipedia.org/wiki/Instruction_creep Thanks and Regards, Senthilkumar Ganesan, Email: [email protected] Mobile: +91-7598124052 Instruction Creep.docx
-
Q 258. It is said that the results of the U.S. presidential election in 2016 were influenced by the "filter bubble" phenomenon on user exposure on social media. What is a filter bubble? What are its potential applications in Business World? What is a filter bubble? A filter bubble is the result of algorithm and exploration science driven, what information would like to see based on the user’s location, past search behavior and search history of results. This means that results are based only on keywords. Social sites in current Business World is easily sorted out the user search history based on the algorithm in built and user may experience the filter bubble every time scroll through your favorite news feed on Facebook or search on Google. These social sites could easily determine users most likely to engaging with based on the contents, search history, news feed rather than complete source of information. Filter bubbles mainly refers to the state of “Intellectual Isolation” that can result from personalized searches on social search engines. With this, users become easily separated from most information that presents on opposing viewpoint. These bubbles are associated with search engines and social media sites. Top Potential Applications in Current Business World: There are more than 50 top potential applications are currently available in Business World, Users are connecting the world together at same time and browsing that information what they need. 1. Google. 2. Facebook 3. Amazon 4. Twitter 5. MSN 6. Yahoo 7. CNN 8. Netflix and etc. Filter Bubble: The following simple diagram explains about filter bubble and how user searching the information in top potential application in current business world. In Social sites, if we consider all of these filters and algorithm together and we will understand easily what is filter bubble. 1. The following diagram which explains about User filter bubble is their own personal and unique universe of information that user lives on online. 2. In your filter bubble, depends on who you are and what you do. 3. Social sites could easily determine which users are most likely to engage with based on the contents, search history, news feed information. Beware Online “Filter Bubbles”: Based on the search engine results (For Ex: Google), we may get a very different search results at the same time while searching on Google search engine. Even when were logged out, there are 57 signals which produced by google to identify mainly following information. 1. Where user is sitting. 2. Computer, Laptop or Mobile and Tablets being used by the respective users. 3. What kind of browser user is using? Personalized filters have been set for the respective users on social search engines at what you click on first and it can throw off that balance. Instead of a balance information diet, user can end up with surrounded information junk food. According to Wall Street Journal Analysis, most of the top internet social sites installed on average of 64 data-laden cookies and user personal tracking beacons each. So, before accepting cookies, user need to thoroughly understand the privacy settings and security policy (Data sharing, information security classification and so on) for the respective social sites. Internet users also should clean up the internet search history, cookies, temp files storage in their respective system on frequent basis. Recommended settings in Individual and Organizational PC’s to avoid Filter Bubbles: i) Periodic review (Individual) & Information Security Audit (Organizational) ii) User Security settings and Clean up. iii) Delete Cookies or Block Cookies. iv) Delete Search and Watch History, Cache, Staging and Temp files. v) Stay logged out always. vi) Encryption mode and Password settings. vii) Always focus on what user need rather than entertainment always. viii) Limiting the Personalized and Tailored aspects of the Web. ix) Custom and Optimized Settings. x) Use the search Engine: SearchEncrypt.com Filter Bubble Effect: SearchEncrypt.com The user needs to use Private search encrypt engines are a wonderful way to avoid filter bubble. SearchEncrypt.com doesn’t track user search history and the search results based on keywords. Search Encrypt results are not influenced by user political views or history of past internet behavior. We need the new gatekeepers to encode that kind of public life and sense of civic responsibility/accountability into the code that they’re writing in social sites in current business world so that we connect this world together with safe and secure manner. Reference: https://en.wikipedia.org/wiki/Filter_bubble https://choosetoencrypt.com/search-engines/filter-bubbles-searchencrypt-com-avoids/ Thanks and Regards, Senthilkumar Ganesan. Email: [email protected] Mobile: +91-7598124052. Filter Bubble-1.0.docx


-
Q 257. Reporting bias leads to incorrect data analysis. What are the different types of reporting biases and how can an organization safeguard itself from reporting bias? Bias: Bias is a belief science and engineering for self and inconsistent or unequal weight against a single or individual, or a group. This is purely an unfair sampling of a population for any function in any industry that does not give any accurate results. Biased Outcome & Reporting: Biased outcome and Reporting may lead to incorrect data analysis in any organization. Also, biased outcome may lead to negative or positive consequences in Diversity & Inclusiveness (Harassment & Bullying, Discrimination), COI (Conflict of Interest), ABC (Anti Bribery and Corruption), Ethics and Behavior, Regulatory Compliance, Auditing, Communication, Change Management and People Development in large organization. It will also lead to huge time/cost spending in near future in the same organization to recover from biased risk. My personal view about Bias: Biased story means that you are supporting or motivating one side of an issue or event. Other than Politics, Biased outcome may lead to negative or positive consequences and it will not give any value to the bottom line. Unbiased Reporting: We need to focus on Unbiased and it means you are telling the exact facts & measures and reporting the actuals that allowing Superior or leadership to make a correct decision. Type of Bias: - Cognitive Bias: Their own Perceptions or Their Own Behavior. - Conflict of Interest: COI (Conflict of Interest) is when a Person or Group or Association has intersecting interests. The respective person or individual & associations are incompatible and It creates the risk. - Statistical Bias: Incorrect data collection and sample selection. - Prejudices: Bias and Prejudice are closed related. Prejudice is prejudgment, unfavorable judgement to person or people with respect to their own limitations. Contextual Biases: The following Subjectivity may bias the evaluation outcome. - Biases in academia - Biases in law enforcement - Biases in media - Other contexts: Educational Bias, Inducive bias, Insider Trading and Match fixing. - Implicit Bias or Unconscious Bias - Explicit Bias or Conscious Bias Safeguarding Organization from Reporting Bias: - Engagement, Collaboration, Respect and Performance (Leadership Goals) - Equity and Equality: Treat everyone in equal manner with respect. - Assign Observer in Team meetings. - Assign a Moderator and Recorder: The Moderator or Recorder is an unbiased representative of any initiative and the feedback process. - Conduct the focus group meetings. - Accurate Data collection, Specialized skills in Statistical Sampling methods. - Metrics Action Plan, Field Work, Audit Planning, Auditing and Audit Reporting. - Regression Testing. - Simulation, Regression, Drill Activities. - Survey and Questionnaire (Open and Closed ended questions) Scenario 1: The following simple matrix example shows the overall effort for various HSE/Cyber Security incidents. (Unbiased Reporting or Safeguarding Organization from Reporting Bias) No Incident No Incident Category Incident Assigned to Data Collection Data Accuracy Lessons Learnt QA/QC RM Approval Status 1 1 Tier 2 HSE/Cyber Security Yes Yes Updated V1.0 Yes Yes PASS 2 2 Tier 3 HSE/Cyber Security Yes Yes Updated V1.0 Yes Yes PASS 3 3 Tier 4 HSE/Cyber Security Yes Yes Updated V1.0 Yes Yes PASS Safeguarding Organization from Reporting Bias: Communicating about safety and cyber security incidents is key to a safe and healthful workplace. We must take the time to discuss safety issues with employees of all levels to get a thorough, unbiased gauge of the conditions. Everyone participation, evaluation, and feedback should always be encouraged. Scenario 2: The following simple matrix example shows the overall effort for various DR - Disaster Recovery Drills. (Unbiased Reporting or Safeguarding Organization from Reporting Bias) No Simulation Disaster Recovery Function Moderator Lessons Learnt DR Procedure Document QA/QC RM Approval Status 1 1 DR Drill 1 IT Yes Yes Updated V1.0 Yes Yes PASS 2 2 DR Drill 2 IT Yes Yes Updated V1.1 Yes Yes PASS 3 3 DR Drill 3 IT Yes Yes Updated V1.2 Yes Yes PASS Safeguarding Organization from Reporting Bias: DR Drill simulation is key to a safe and healthful workplace for longer run. We must take the time to simulate DR Drill activities and ensure our learnings updated with high accuracy, unbiased gauge of the conditions. Everyone participation in simulation activities, evaluation, and feedback should always be encouraged. With respect to Safeguarding Organization from Reporting Bias with above recommendations or practices, the greater performance along with high quality will be achieved. Reference: https://diversity.ucsf.edu/resources/unconscious-bias https://en.wikipedia.org/wiki/Bias Thanks and Regards, Senthilkumar Ganesan, Email: [email protected] Mobile: +91-7598124052 Bias.docx