Prasoon Bhargav
Fraternity Members
-
Joined
-
Last visited
Everything posted by Prasoon Bhargav
-
Dear All, We have extensively discussed applicability of Six Sigma tools and techniques in our workshops, however, when I discuss Six Sigma application in sports, a significant percentage of participants find it unusual. Here is an example: Author Steven Falk wrote "Six Sigma Tennis" upon returning to Stanford Tennis after recovering from a Traumatic Brain Injury (TBI) to share his successful methodology with tennis enthusiasts, students, and instructors. Please refer to links below to learn more http://www.prnewswir...s-90204382.html http://www.stevenfal...igmaTennis.html http://www.ereleases...ma-tennis-39832 Regards, Shantanu Kumar
-
Dear All, Please see below a query posted by a past participant. Please feel free to respond to this query. Regards, shantanu kumar --------------x--------------------------x-----------------------x--------------------------x--------------------------x---- Hi Shantanu, Hope you are doing well. I was trying to understand p-charts. Consider a case where in the output is varying and defectives are identified. Data for the same is as follows. When I tried to plot a p-chart for the same in Minitab, the UCL line varies as shown because of varying output, but a value of UCL (0.05439) is highlighted; Similarly for LCL (0.00675). How is this figure arrived at? Defective Volume 15 500 20 528 13 465 12 470 Warm Regards, Krishnan S
-
I am posting a question asked by Shijoy Varghese Shijoy Varghese asks: 1) When I create the current state value stream how do I eliminate the decision boxes as there should be no decision boxes in the current sate VSM 2) When I calculate the wait time in the current state VSM, lets say I have 100 invoices pending in the first step to process, it takes 1 minute to process one invoice, which means rest 99 are waiting, how to calculate that wait time as all of them wait differently( wait time for 50th and 100th invocie would be different) 3) Do I have to put all the detailed steps in current state VSM ?
-
Hi All, Good questions & responses by Sujeet and Pankaj. If you wish to evaluate whether download time is affected by shift, you may do the following: 1. CTQ-Download Time/Size of File---suggested by Sujeet---I also feel that it is a better CTQ 2. Compare average download time/size of file across shifts. Please treat data for different shifts as different samples (suggested by Pankaj and I completely agree). If there are 3 shifts, you should use ANOVA to compare average download time/size of file across shifts. Considering the data to be independent, steps for ANOVA are: a. Normality test b. Test for equal variances----Levene/Bartlett c. ANOVA - One way 3. To determine the minimum sample size required for ANOVA, you may choose to use Minitab>STAT>Power and Sample Size>One-Way ANOVA 4. If data are not normally distributed, let me know and I will list down basic steps to deal with Non-Normal data. Regards, shantanu kumar
-
Dear Arvind, You can use the following functions in excel fdist(x,numerator degrees of freedom,denominator degrees of freedom) chidist(x,degress of freedom) Note: 'x' represents the calculated statistic value, in case of Fdist, it is the F stat value and for Chidist, it is the Chi-stat value. Regards, shantanu kumar
-
Letting people put easier assignments in DMAIC format so that they atleast practice the tools soon enough.---- I agree. We can ask them to follow the roadmap however for advanced tool practice, they can attend FBB. Not insisting on validation from seniors within company and going by whatever they say.-------This may result in plagiarism and loss of reputation. This may become an easy way out. We may also like to think about Practice Project completion certificate based on a case study examination----6-8 hour examination.
-
Ok. Thanks Regards, shantanu kumar
-
Hi Ravi, You can read up on Non-Parametric tests and Data Transformation. We will discuss Non-Parametric tests and Data Transformation in detail during the BB workshop. To prepare for BB, I would suggest that you revisit the GB material and Basic Statistics. I will suggest that you list down your Six Sigma queries and e-mail me. I will pick up the queries during BB workshop. Regards, shantanu kumar
-
Dear RaviShankar, We will discuss analysis of non-normal data during the BB program. We can of course pick up your queries during the workshop. Regards, shantanu kumar
-
Hi All, Sorry. Forgot to mention the references. Here are the references Data Analysis Using Regression and Multilevel/Hierarchical Models by Jennifer Hill, Andrew Gelman Linear least squares computations By R. W. Farebrother Applied regression analysis, linear models, and related methods By John Fox Numerical methods for least squares problems By Åke Björck Weisberg, S. 1985. Applied Linear Regression, 2nd ed. New York: John Wiley and Sons. Regards, shantanu kumar
-
Dear All, Apologies for the late response. Shalini, Sanjay and Srinivas have provided answers to most questions. It is slightly tough to explain these concepts in a post however I am still trying. To know more about these concepts, you can attend the MBB workshop. Regards, shantanu kumar Q1: What are the assumptions in Ordinary Least Square Regression? Answer: The assumptions in Ordinary Least Square Regression are: Model is linear in parameters The data are a random sample of the population The errors are statistically independent from one another The expected value of the errors is always zero The independent variables are not strongly col linear The residuals have constant variance The errors are normally distributed And of course the independent variables are measured precisely Q2: What does VIF signify? Are high values of VIF desirable? Answer: The easiest way to understand what VIF signifies is to understand how it is calculated. Let's say that we have four independent variables X1, X2, X3, X4 and one dependent variable Y. To calculate VIF of X1, we will first regress independent X1 on the remaining independent variables. We will get a Rsquare value and the use the following formula VIF (X1) = 1/(1- Rsquare of X1) VIF =1 would mean 0% variation explained by remaining independent variables in X1.There is no Multicollinearity - IT IS GOOD VIF=5 or more would mean 80% or more of the variation explained by remaining independent variables in X1. - IT IS NOT GOOD- High Multicollinearity Therefore VIF of X1 will be high when Rsquare of X1 when regressed on X2, X3, and X4 is high. Therefore if remaining variables are strongly correlated with X1, VIF will be high. Multi-Collinearity refers to independent variable (predictor) that is correlated with other Independent variables (predictors). We will follow the same procedure for the remaining independent variables (predictors). High values of VIF are undesirable as it indicates multicollinearity. If independent variables are strongly correlated to each other, the regression coefficients will be imprecise. Q3. What does Durbin Watson statistic help us infer? Answer: As mentioned earlier, in OLS Regression, one of the assumptions is Errors(residuals) are independent of each other. If Errors(Residuals) are correlated, in OLS regression, predictors may appear to be significant when they aren't. Durbin-Watson test for the presence of autocorrelation in Errors (residuals) by determining whether or not the correlation between two adjacent error terms is zero. We compare Durbin-Watson statistic to lower and upper bound in Durbin Watson Table. If Durbin Watson Statistic < lower bound, we infer positive auto-correlation in residuals If Durbin Watson Statistic > upper bound, we infer no positive auto-correlation in residuals If lower bound<Durbin Watson Statistic<upper bound, we consider the test to be inconclusive If 4-Durbin Watson Statistic<lower bound, we infer negative auto-correlation in residuals If 4-Durbin Watson Statistic>upper bound, we infer no negative auto-correlation in residuals If lower bound<(4-Durbin Watson Statistic)<upper bound, we consider the test to be inconclusive Note: Durbin Watson statistic should be used when data is in meaningful order Q4. What is the difference between R-sq, Adjusted R-Sq, and Predicted R-Sq? Answer: R square is the coefficient of determination. It indicates how much variation in the response is explained by the model. Rsquare= 1-(SSError/SSTotal) R-Square Adjusted: In our effort to increase Rsquare value, we add unnecessary predictors in our model. Rsquare adjusted accounts for the number of predictors in the model. We should use it for comparing models with different number of predictors. R square Adjusted= 1-(MS Error/MS Total) Predicted R-Square: It is calculated from PRESS (Predicted Residual Sum of Squares). Larger Values of Predicted R square suggests models of greater predictive ability. Predicted Rsquare = 1- (PRESS/ (SS Total) Predicted R-squared can prevent over-fitting the model and can be more useful than adjusted R-squared for comparing models because it is calculated using observations not included in model estimation. Over-fitting refers to models that appear to explain the relationship between the predictor and response variables for the data set used for model calculation but fail to provide valid predictions for new observations. Q5. What does PRESS assess? Answer: Predicted-Residual-Sum-of squares procedure, or PRESS procedure as described by Weisberg (1985). Models are repeatedly estimated using data sets of n -1 observations, each time omitting a different observation from calibration and using the estimated model to generate a predicted value of the predictand for the deleted observation. Lower values of PRESS are desired. Lower values of PRESS would mean High Predicted Rsquare. Q6. What do we mean by unusual observations? Answer: Unusual Observation is a single observation that can have a large effect on results. Data can be unusual in the following ways: Outlier: observation with a large residual (i.e. far from regression line). Leverage - explained below Q7. What do Leverage values, Cook's Distance and Mahalanobis distance help us identify? Answer: Leverage values are one or more cases whose X values give them more potential to influence the results than the others. Observation with large leverage values may exert considerable influence on the fitted value, and thus the regression model. Leverage values fall between 0 and 1. As a rule of thumb, it is advised that we investigate observations with leverage values greater than 3c/n, where c is the number of model (including the constant) and n is the number of observations. Cook's Distance: A measure of how much the residual of all the cases would change if a particular case were excluded from the calculation of the regression co-efficients. A large Cook's Distance indicates that excluding a case from computation of the regression statistics changes the coefficients substantially. measures the influence of a particular observation on the entire model lowest possible value is 0 higher value means the observation is more influential Mahanlanobis Distance: A measure of how much a case's values on the independent variables differ from the average of all cases. A large Mahalanobis distance identifies a case as having extreme values on one or more of the independent variables Key SSTotal -Sum of Squares Total SSE - Sum of Squares Error MSTotal - Mean Square Total MSE - Mean Square Error PRESS - Predicted Residual Sum of Squares OLS - Ordinary Least Square Regression
-
Hi Shalini, Good response on Adjusted R-Sq and Predicted R-Sq. I will post answers to all questions next week. Regards, shantanu kumar
-
Dear All, These are few frequently asked Master Black Belt interview questions on Ordinary Least Square Regression Basics. Let's get answers to these questions What does VIF signify? Are high values of VIF desirable? What does Durbin Watson statistic help us infer? What is the difference between R-sq, Adjusted R-Sq, and Predicted R-Sq? What does PRESS assess? What do we mean by unusual observations? What do Leverage values, Cook's Distance and Mahalanobis distance help us identify? What are the assumptions in Ordinary Least Square Regression? Everybody is invited to post answers to these questions. Regards, shantanu kumar
-
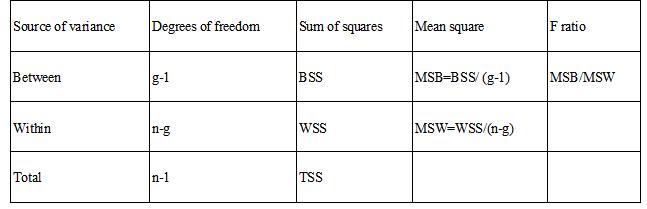
Why is ANOVA called Analysis of Variances when it compares means of more than two samples? Answer: To determine whether means of several groups are equal or not or whether the samples belong to the same population or not, ANOVA compares the variance of the group means(between groups), with the variance of values within the groups (within group) Mathematically in a balanced ANOVA design, a. Calculate the variance of each group and then calculate the mean of the variances - this will give you the ‘error variance' ---------(MSW) b. Calculate the arithmetic mean of each group and then calculate the variance of the arithmetic means of the groups - this will give you ‘variance of sample means' c. Multiply the ‘variance of sample mean' by sample size of one group-----(MSB) d. F= (sample size*variance of sample mean)/ error variance OR MSB/MSW ANOVA Table What does the Sum of Squares (SS) represent? The sum of squares between groups (BSS) measures the variation between the group means The sum of squares within groups (WSS) measures the variation of values within each group What is MS and what does it represent? Mean Squares Between = Sum of Squares between / (no of groups-1), Mean Squares Within= Sum of Squares within / (total observations - no of groups). How do we get F and what does it mean? It is simply the ratio of two variance estimates. F = (sample size*variance of sample mean)/ error variance OR Mean Squares between groups/ Mean Squares with group. How do we get the p-value? p value in ANOVA is F distribution's probability density function of x= F statistic with numerator df between group and denominator df within group. To find the p-value, you can use MS-Excel by inserting the function ‘fdist (F, df between groups, df within group)'. In Minitab, follow this path - Calc>>Probability distribution>>F distribution. Comparisons or Post Hocs Why do we use multiple comparisons? ANOVA only indicates whether there are differences between one or more pair of treatment means. It doesn't indicate which pairs are different. Multiple Comparisons are used to identify significant differences between specific factor levels What is the difference between Tukey and Hsu's MCB? Tukey's method or the Tukey-Kramer method is used to compare all possible pairs of treatments while controlling the family error rate. HSU's method compares the best treatment (the one with the lowest or highest mean) to all other treatments while controlling the family error rate. What is the difference Tukey and Fisher comparisons? Fisher's method is used to compare all possible pairs of treatments using a specified error rate for individual tests. It doesn't control the family error rate. Therefore it is advised that we use Fisher's method with appropriate Bonferroni corrected alpha if only a subset of all possible comparisons is of interest.
-
Hi Ria, I am currently compiling frequently asked Green Belt interview questions. I will try to publish it by December'09. Regards, shantanu kumar
-
Dear All, These are few frequently asked Black Belt interview questions on ANOVA Basics. Let's get answers to these questions. 1.ANOVA Table Why is ANOVA called Analysis of Variances when it compares means of more than two groups? What does the Sum of Squares (SS) represent? What is MS and what does it represent? How do we get F and what does it mean? How do we get the p-value? 2.Comparisons or Post Hocs Why do we use multiple comparisons? What is the difference between Tukey and Hsu's MCB? What is the difference Tukey and Fisher comparisons? Everybody is invited to post answers to these questions. Regards, shantanu kumar
-
Solutions keeping Transformations and Non-Parametric Tests aside. Question 1: The groups have unequal variance; the sample sizes are significantly different. Can we carry out One-Way ANOVA? Solution: In this case, we can use Welch Statistic instead of ANOVA F-statistic. The Welch statistic is more powerful than the standard F when sample sizes and variances are unequal. Of course Brown-Forsythe statistic can be used in this situation however Welch Statistic is preferred over all other options. Question 2: The groups have unequal variance; the sample sizes are equal or almost equal. Can we carry out One-Way ANOVA? Solution: If the group sample size is equal, tend to follow normal distribution however groups have unequal variance, ANOVA is robust to this violation when the groups are of equal size. The F statistic is robust to unequal variances when sample sizes are equal or nearly equal. The sample size should be at least more than 5, and preferably more than 30. Question 3: Let's say we did carry out One-Way ANOVA for groups with unequal variances. Can we still use comparisons like Tukey, Bonferroni etc? Solution: When the groups have unequal variances, the multiple comparisons or post hoc test are different. Tamhanne's T2, Dunnett's T3, Games-Howell, Dunnett-C are the comparisons which don't assume equal variances. Please note that Post hoc test or comparisons results are valid to the extent that the standard F statistic is robust to violations of assumptions. If both variances and sample sizes are unequal, F-statistic is not robust. Question 4:The group sample sizes are equal, symmetric, equal variances, the data is continuous but non-normal. What should we do? Solution: This has been a debatable topic for years. In general, it should be borne in mind that when true statistical randomisation occurs, then violation of the assumption of normality is acceptable. The One-Way ANOVA F- test is fairly robust if the distribution is symmetrical. The one-way ANOVA's F test will not be much affected even if the population distributions are skewed, but the F test can be sensitive to population skewness if the sample sizes are seriously unbalanced. If the sample sizes are not unbalanced, the F test will not be seriously affected by light-tailedness or heavy-tailedness, unless the sample sizes are small (less than 5), or the departure from normality is extreme (kurtosis less than -1 or greater than 2). Note: If the data aren't normally distributed, Bartlett test for variances, Hartley's test for variances are not preferred, as they are quite sensitive to non-normality. You can use Levene's Test. Finally, we do have the option of Transformations and Non-Parametric Test, in case of violation of assumptions. References Brown, Morton B. and Forsythe, Alan B. (1974), Robust Tests for Equality of Variances, Journal of the American Statistical Association, 69, 364-367 Bartlett, M. S. (1937). Properties of sufficiency and statistical tests. Proceedings of the Royal Statistical Society Series A 160, 268-282. Levene, H. 1960. Robust Tests for the Equality of Variance. In: Contributions to Probability and Statistics, I. Olkin, eds. Palo Alto, Calif.: Stanford University Press. Welch, B. L. 1951. On the Comparison of Several Mean Values: An Alternative Approach. Biometrika, 38:, 330-336.
-
Dear Six Sigma Practitioners, We are aware the following underlying assumptions of One- Way ANOVA The k samples are normally distributed. The samples are independent of each other The k samples are all assumed to come from populations with the same variance Within each sample, the values are independent In an ideal world, all assumptions are met however more often than not, assumptions of normality and homoscedasity are not met. So we use various transformations to transform data to meet assumptions and then carry out the hypothesis test. If data transformation doesn't work , then we move to Non-parametric tests. I am listing down a few interesting situations that we may come across while carrying out One-Way ANOVA. The groups have unequal variance; the sample sizes are equal or almost equal. Can we carry out One-Way ANOVA? Let's say we did carry out One-Way ANOVA for groups with unequal variances. Can we still use comparisons like Tukey, Bonferroni etc? The group sample sizes are equal, symmetric, equal variances , the data is continuous but non-normal. What should we do? The groups have unequal variance; the sample sizes are significantly different. Can we carry out One-Way ANOVA? Let's seek solutions keeping Transformations and Non-Parametric Tests aside. Everybody is invited to suggest solutions Regards, shantanu kumar