

Akkul Dhand
Members
-
Joined
-
Last visited
Everything posted by Akkul Dhand
-
Yes, AI can absolutely reveal the operational assumptions that we did not realise we were running on. A clear example from my world is the belief that SLA breaches happen only because volumes spike unpredictably. Everyone accepts this as the truth. Managers plan around it, teams repeat it, and it quietly becomes part of the culture. If I were to apply an AI workload analytics agent to our historical data, I am almost certain it would tell a very different story. AI does not buy the human narrative of random spikes. It would start stitching together patterns across months of transactions, client behaviour, payroll cycles, renewal periods, public holidays, cut-off times, and even the way we schedule work internally. What feels chaotic to us would probably come out looking like a painfully predictable pattern. For example, the Monday surge that we keep treating as bad luck, would likely match a Friday submission pattern. The month-end pressure would line up with contract expiry cycles. The worst SLA failures might correlate with a few specific events that we have never connected, simply because humans are not good at holding that many signals in their heads. The bigger realisation here is that the assumption itself, that workload spikes are unpredictable, survives only because we do not analyse enough data at once. AI would surface the blind spots, challenge the narrative, and show that our problem is not chaos. There is poor visibility and weak forecasting. This is exactly where AI changes the conversation. It forces you to compare what you believe is happening with what is actually happening, and that shift alone is enough to reshape how you plan, staff, and manage performance.
-
In our current environment, a Global Capability Center that oversees and manages high-volume legal, compliance, and digital operations for UK clients, the culture is shaped by accuracy, documentation, and effective cross-team coordination. AI does more than automating tasks in this context; It influences how people think, collaborate, and make decisions daily. How AI Can Influence Culture, Both Positively and Negatively Transparency AI dashboards significantly increase visibility. Everyone can see volumes, turnaround times, backlog, and quality trends in real time. However, when this transparency is not well explained, it can feel like monitoring, and employees may often interpret it as “the system is watching everything I do,” which undermines openness and honest communication. Accountability AI strengthens objective audit trails and reduces human bias in quality reviews. There is a chance that people may begin shifting responsibility to the system, and when individuals say “the system recommended it” instead of owning the decision, it weakens the culture of personal accountability that our work requires. Learning and Capability Building AI-powered facilitates onboarding and supports continuous learning. At the same time, there is a real danger of people relying too heavily on it. We have observed instances where analysts have accepted AI-flagged recommendations without fully reading the context because “it is usually right”, leading to declining judgment skills, especially in complex cases where human reasoning is crucial. Innovation AI enables rapid experimentation by helping teams in simulating staffing, turnaround times, and process changes. The challenge here is that overuse can make people passive, and instead of proposing ideas, they may wait for the system to generate recommendations, slowing down meaningful innovation. To Strengthen Culture, leaders should take the following steps, 1. Set clear AI engagement rules Leaders need to make clear what AI will be used for and what it should not be used for. Clarity builds trust and reduces fear. 2. Reinforce human accountability Decisions must be guided by a simple principle: AI can advise, but humans must make the final decision. This keeps judgment, ownership, and independent thinking intact. 3. Position AI as an assistant rather than a coach AI should be part of the review and learning cycles rather than being the ultimate authority. For example, AI can identify and flag an issue, the analyst can validate it, and the manager can provide guidance and context. 4. Create psychological safety around challenging AI If people are worried about being penalised for challenging AI outcomes, the culture rapidly deteriorates. Leaders should highlight and applaud situations where analysts correctly override AI recommendations, demonstrating that critical thinking is valued. 5. Train managers first Managers should understand how AI works, including its limitations and biases. If they do not, they may misuse it and misguide their teams. Healthy adoption requires the ability to lead. 6. Tie AI initiatives to team-driven innovation Leaders should run monthly “AI and Operations Improvement Sprints”, led by the leaders themselves, in which teams propose ideas and test them with AI tools. This ensures that innovation remains AI-supported, but led by humans. AI can help strengthen transparency, learning, and innovation, but only when leaders intentionally shape how it is used. In the absence of guardrails, AI can weaken accountability, reduce skill depth, and undermine psychological safety. Ultimately, cultural impact depends on the leadership philosophy and behaviours that direct the technology, rather than technology being the guide.
-
When AI Fails in Customer Service: How to Respond and Resolve? Let me walk you through a real-world example of how AI failure in a Global Capability Center (GCC) can become a defining moment not just for recovery but for service maturity, especially in a highly regulated industry like banking. Picture this: The GCC for a multinational bank is managing backend operations – KYC validation, fraud investigations, compliance audits, and dispute resolution. When the customer-facing AI chatbot receives a fraud complaint at 2:00 AM ET, and AI incorrectly classifies it as a billing dispute and misroutes the case. The team starts processing what they believe is a refund request. Meanwhile, around 8 AM ET, the customer accuses the bank of disregarding the fraud alert in a tweet. Within hours, the issue escalates from an operational error to a public relations and regulatory risk. Let us move to the steps for proactively preventing failure, limit its impact, and rebuilding trust, in addition to recovering from it. 1. Start by Mapping the Real Failure Risk Most AI recovery plans focus on logic errors or misclassifications. However, in a regulated industry, the greater risk is non-compliance. Think of AI as the first line of defence, but the regulatory clock starts when the event, such as a fraud report, occurs, not when AI classifies it correctly. That means: A fraud case misclassified as a refund still needs to trigger the 24-hour compliance deadline. AI must be built with dual workflows: one for customer resolution and one for regulatory actions. Misclassification should not delay the regulatory response. We can implement this by layering in a compliance trigger. Regardless of how AI routes the case, if certain keywords or metadata patterns emerge, the compliance workflow initiates. This protects the bank even when the AI makes a mistake. 2. Build Cross-Timezone Handoff as a Capability, not a patch. AI failure does not wait for shift overlap. A key design flaw I have seen in many GCCs is the assumption that escalation implies someone is online to take the escalation. Here is what happens: A pattern of misrouted fraud claims is detected midday. The AI product team is offline. The customer complaint escalates publicly before the AI team is even aware. This is where we create a 24/7 AI Command Framework with clear authorities, escalation cadences, and asynchronous documentation. If a critical AI failure is detected: The incident is noted & tagged in a shared triage tracker. Slack messages are pre-drafted and queued for the AI team. Compliance, customer experience, and operations lead their own decision-making for interim fixes. The goal is to prevent the issue, limit the impact, and ensure a clean handoff rather than wait for someone to wake up. 3. Triage Like a Hospital Emergency Room Not all AI failures are equal. A misrouted fraud ticket and a misrouted inquiry both show up in the queue, but only one can trigger a regulatory breach. Therefore, it is necessary to create a severity matrix: Critical: Fraud claims, security blocks, regulatory deadlines (response within thirty minutes) High: Disputes, refunds, delayed reversals (response within two hours) Medium: KYC document issues, verification mismatches (response within eight hours) Low: Routing errors without impact (document and route for AI retraining) This helps allocate the right skill sets, resources, and recovery actions based on the actual customer and compliance risk, not just AI logic errors. 4. Let the AI Catch Itself When Possible One of the most underrated tools in AI error recovery is the AI itself. Most frameworks follow this pattern: AI fails, a human fixes it, and AI gets retrained later. So, we add guardrails so the AI could self-correct or stop itself mid-action. For example: If the confidence score is below seventy percent on any fraud-related request, do not route autonomously. Queue for manual review. If five similar misroutes happen within six hours, automatically disable that routing logic and notify quality assurance. Before confirming refund classification, the AI should check whether the customer has an open fraud case. If so, block and escalate. This turns AI from a static responder into a learning, risk-aware system. 5. Do Not Just Fix the Case. Rebuild the Trust This is the most overlooked aspect. The AI might fail. The agent might fix it. But unless you close the loop with the customer, you lose trust. In the framework, trust recovery needs its own playbook: Acknowledgement: This case was incorrectly routed by our automated system. Transparency: It did not affect your account or transaction history. Compensation: We have credited twenty-five dollars to your account for the inconvenience. Assurance: The issue was resolved in a certain number of minutes. We have adjusted our systems to prevent recurrence. Follow-Up: A call or email within forty-eight hours to confirm customer satisfaction You would be surprised how many customers will go from angry to appreciative once this is implemented. 6. What Gets Measured Gets Improved, But Measure the Right Things Yes, track the misclassification rates and average recovery times, but also start tracking outcomes: Customer Effort Score: How many times did the customer contact us after AI failed? Repeat Contact Rate: Did our fix resolve the issue? Cost of Failure: Agent hours, expedited handling cost, goodwill credit per error. This helps make the case for better AI models and stronger resourcing. 7. Prevention Is the Best Cure Before deploying any new AI logic, run it against three months of real case data. You may also use canary deployments: New AI routing only goes live for five per cent of tickets initially. Real-time monitoring checks for error patterns If the failure rate exceeds the threshold, the rule is paused, not debated. Let humans confirm AI classifications for fraud, disputes, and compliance-related cases. These are not the places to be clever, just places to be sure. Closing Thought The role of the GCC is no longer just operational support. It is strategic risk management, customer trust recovery, and AI performance enhancement. In a world where AI powers the frontlines, the GCC becomes the resilience engine. It is not about perfection. It is about recovery with accountability, speed, and grace. If done right, even an AI failure becomes a customer loyalty moment.
-
How can AI re-invent compliance? Most organizations treat compliance as a catch-up exercise, reacting only when audits or regulatory reviews flag problems. A few weeks before the annual filing deadline, if the audit team discovers a significant revenue recognition issue, what follows is familiar to every CFO: late nights, forensic reviews, restated financials, and tense board conversations. The actual cost is not just the penalty or audit fees; it is the erosion of stakeholder confidence. AI provides real-time monitoring, pattern detection, and predictive alerts, taking compliance from a defensive posture to a proactive and strategic capability. The AI Opportunity in Financial Reporting Compliance breaches in financial reporting typically surfaces only after the books have closed and the statutory filings have been prepared and recorded, making corrections not only costly, but damaging to the organization’s reputation. AI can potentially shift this dynamic by acting as a continuous sentinel, by identifying risks in real-time and improving the organization's ability to manage such issues before they escalate. Three Use Cases for Proactive Compliance 1. Real-Time Anomaly Detection AI can monitor ERP and general ledger systems to analyse transactions in real-time. Instead of spending weeks evaluating journal entries during the year-end close, the system can quickly identify and highlight potentially suspicious activities. Example: A vendor regularly sends monthly invoices ranging between ₹2 to ₹3 lakhs, however, within the span of a week, they send three invoices, each ₹4.8 lakhs and just under the ₹5 lakh approval limit. An AI system that analyses past invoice patterns will recognize and flag this as suspicious and notify the accounts payable team to investigate threshold manipulation or invoice splitting ahead of the month-end. The system also detects cash and accrual mismatches, aggressive late revenue recognition, and journal entries during the late periods that improve results. 2. Trend Deviation Alerts An AI algorithm analyses current financial ratios and accounting methods in the context of the company’s history, and the company’s available industry peers. For instance, the last three years the provision for doubtful debts has remained at 2.1 percent of receivables. This quarter, it has declined to 1.2 percent even though the receivables aging report shows deterioration. In your industry, comparable companies continue to hold provisions between 2.0 and 2.5 percent. Such gaps are seamlessly and automatically brought to the AI dashboard, giving the CFO the opportunity to defend the assumption around provisioning prior to the close of the quarter, not as an explanation to the auditors. 3. Regulatory Deadline and Reconciliation Tracking AI can go beyond simple pattern recognition by checking compliance with procedural requirements that often get overlooked during hectic times. For instance, an AI system can track reconciliations daily and warn the tax team when GSTR-2B reconciliations exceed the ₹50,000 threshold and when tax reconciliation items are pending as the deadline for filing approaches. Reconciliation of input tax credit for GST and TDS deposits, as well as foreign transaction reporting under FEMA and certain Companies Act requirements can also be tracked and alerted to the user. Implementation Guardrails While AI does offer significant potential, deployment requires safeguards to ensure accuracy, fairness, and practical utility. Explainability Every alert must provide an explanation and justification. If a flagged transaction takes place, users must know the reason. For example, "Vendor X invoiced three times within seven days, which is a remarkable historical frequency increase of 300 percent." Providing a reason builds trust and allows the finance team to assess if the alert is a genuine risk or a benign business change. Materiality Thresholds Not every deviation calls for an action. Calibrations need to be set to ensure only those transactions get flagged, which cross pre-set materiality limits, either in percentages or absolute value. Proper calibration is vital to prevent alert fatigue. Human Oversight Every alert must be reviewed and approved by the financial controllers or compliance officers, ensuring that the final responsibility remains with qualified professionals. Bias Audits Evaluate models to ensure they are not unfairly targeting certain vendors, cost centres, geographic areas, or transaction types. Regular checks of assigned fairness are vital to maintaining trust. Historical Validation Models must be run through two to-three years of historical financial data prior to deployment. This sets the accuracy benchmark, false positive rate, and measure of reliability. Data Quality Requirements AI-based systems require clean, structured, and consistently formatted data. Organizations must assess whether their ERP data is standardized to the extent that it supports AI monitoring. Many a time, this means making an investment in data governance and master data management for AI to start delivering value. What AI Cannot Do It is equally important to understand AI’s limitations. • New kinds of transactions that the system has never faced are still difficult to classify: a first-time restructuring or a new business model requires human judgment. • Professional judgment about nuances in accounting standards or interpretations remains with the professionals. • Early deployments may return false positives; hence, teams must prepare themselves for a calibration period. • Integration with legacy ERP systems may present technical difficulties and cost. Implementation Realities Implementation requires upfront investment in data infrastructure, integration, and change management. Organizations should expect three to six months for pilot deployment in limited scope such as accounts payable. Thereafter, the model will require maintenance and threshold adjustment. Teams also must be trained to trust and respond to AI alerts instead of dismissing them as system errors. Culturally, this is the larger challenge. Finance teams may resist daily alerts, perceiving AI as a question of their competencies, having, until then, been used to periodic reviews conducted quarterly. Change management is as important as the technology itself. Why It Matters This approach transforms financial reporting compliance from reactive firefighting to initiative-taking foresight. The company Boards and CFOs will gain visibility into emerging risks on a daily or weekly basis rather than discovering problems during audit season or regulatory inspections. In India, where the Companies Act 2013 and SEBI regulations place increasing personal liability on independent directors and CFOs, AI-enabled compliance shall strengthen governance and reduce exposure. Broadly, proactive compliance reduces penalties, avoids restatements, shortens audit cycles, and builds investor confidence. The question is no longer whether AI can make compliance proactive, but, how quickly organizations can implement it effectively, is the real question.
-
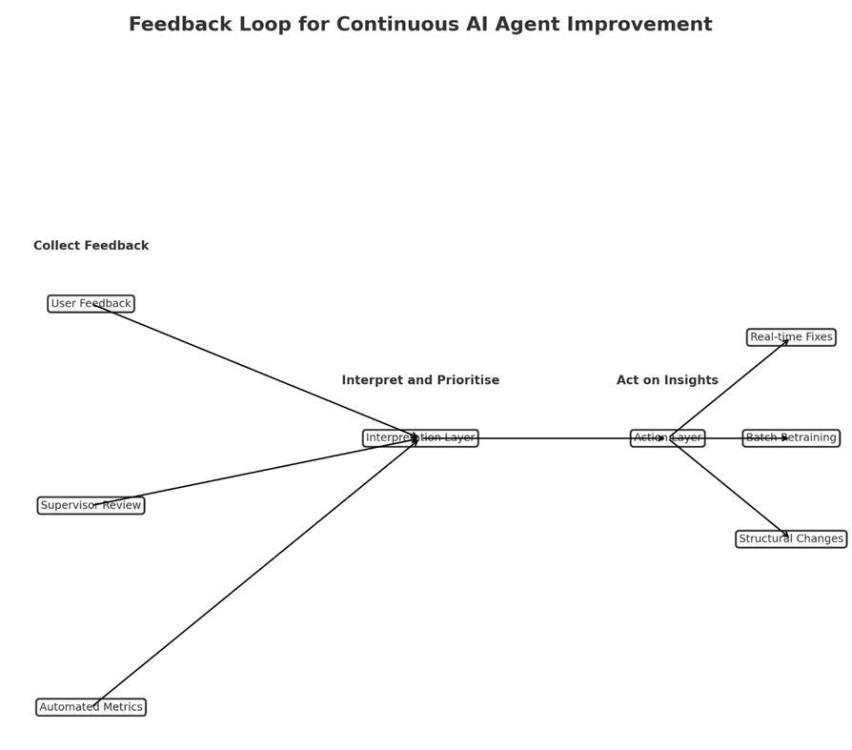
How I Would Build a Feedback System for an AI Customer Service Agent? It’s like hiring a new customer service rep. - you would not throw them in front of customers on the first day and hope for the best, instead you would watch how they perform, collect feedback from customers and supervisors, and help them improve. An AI agent needs the same kind of ongoing training. Three Ways to Collect Feedback Ask Customers Directly but Keep It Simple: After the AI helps with a real question, show three quick buttons: thumbs up, neutral face, or thumbs down. Include a small text box so customers can add a quick note such as “Did not understand my mortgage question” or “Gave me the right answer but sounded robotic.” The key is to ask only after meaningful conversations, so customers are not continuously prompted after every single interaction. Have Human Experts Check the AI’s Work Once a week, experienced supervisors can review a sample of conversations, focusing on ones with poor ratings, long resolution times, or high-stakes topics like compliance. They will spot details that metrics miss, such as “The AI gave correct information but did not recognise that the customer was frustrated about a fee.” Reviewing a sample, rather than every conversation, keeps the process manageable. Track the Numbers Monitor essential metrics such as first-time resolution, the number of cases escalated to human agents, and average resolution time for each case. Occasionally, you may send test questions where you already know the correct answer to ensure the AI is still performing well. Making Sense of the Feedback Collecting feedback is easy, making it useful takes work. Start by grouping similar issues together, such as “Does not understand regional accents,” “Too formal when customers are upset,” or “Provides incorrect information.” Prioritise by severity. A calculation error is far more serious than sounding overly formal. Look for patterns, for example, whether accuracy drops on Mondays when there is a backlog from the weekend. Three Speeds of Improvement 1. Quick fixes can be made in a day or two, such as updating outdated information. 2. Regular updates can happen once a month, retraining the AI on the most common issues identified in the feedback. 3. Big changes, such as adding advanced document-reading capabilities such as OCR, will take longer and require more planning. Avoiding Feedback Overload Too much feedback can overwhelm the team; focus on the interactions that reveal the most. Address urgent issues immediately and save routine improvements for the monthly review. Once an issue has been resolved and stays fixed for a few months, stop monitoring it closely and turn your attention to new challenges. Keep People Involved Let customers and employees know their feedback matters. If you improve the AI’s ability to answer product questions based on someone’s suggestion, say so: “We have improved how our AI handles product inquiries based on your feedback.” When employees see that their input leads to real improvements, they will continue offering valuable suggestions. The Bottom Line Maintaining an AI agent is like maintaining a car. You make small adjustments as needed, schedule regular check-ups, and only conduct major repairs when something fundamental needs to change. The goal is steady improvement, so the AI gets better every week without frustrating customers or overwhelming the team.
-
The Swiss Cheese model is a risk analysis and management model developed by James Reason. The model illustrates how accidents or failures can occur due to a combination of various factors. Think of a stack of Swiss cheese slices with the slices representing layers of defence, such as safety procedures, training or system design within a process or an organisation, and the holes representing the potential weaknesses or failure points in those defences such as human errors, system malfunction or a procedural flaw. In isolation, the holes may not create an issue; however, when they line up, they create a clear path for failure. Used in various industries such as healthcare, aviation, engineering, etc., the model helps 1. Analyse past accidents and identify areas for improvement. 2. Spot individual failures as well as systemic vulnerabilities 3. Understand that a single safeguard is never enough 4. Focus not only on adding additional layers, but also improving the quality of the existing ones (i.e. shrinking the holes) In my organizational processes, the cheese slices or the layers of defense are, 1. Process Documentation - Standard Operating Procedures for clarity on what needs to be done and how. 2. Technology and Tools - CRM, project trackers, automated reporting. 3. People Structures – Skilled team members and role clarity. 4. Audits & Reviews -Regular Check-ins, internal audits and client feedback loops 5. Training & Capability Building - Internal or external training programs, onboarding procedures, or process trainings. 6. Governance Frameworks - Approval systems, decision rights or escalation ladders And the holes i.e. the weak spots are, 1. Process Documentation: Outdated or poorly communicated procedures 2. Technology & Tools: Incorrectly implemented or data not updated 3. People: Poor Delegation, lack of ownership or unclear roles 4. Training: Theoretical but no practical implementation, old training systems or irrelevant modules 5. Governance - Micromanagement, or too much red tape, or unclear escalation If the holes line up, there can be client delivery issues, missed deadlines, and miscommunication, leading to business losses. However, by using Business Excellence principles, pitfalls can be avoided, as below, 1. Map your defences – Document all the defence mechanisms in the workflows by assessing where you rely on people, where on technology and where the decision-making is slow. 2. Identify and Prioritize risks – Run a FMEA analysis to spot where the holes might align, which layers are the weakest and which ones overlap. 3. Close the gaps – Use the PDCA, DMAIC to tighten each layer (shrinking the holes) such as, · Improve SOPs - standardise, train, test understanding, periodic reviews · Review CRM or reporting dashboards for data accuracy · Audit the impact of training, not just attendance 4. Design for resilience – Set up redundancy where needed by implementing backup approvers, escalation triggers, or multiple checkpoints so that even if one layer fails, another catches it. 5. Imbibe a culture of prevention – Encouraging teams to look beyond firefighting and ask what hole in our process allowed this to happen, and how can we patch the holes? For Eg: During any transition, · One layer is the communication plan. · Another is the handover process · Third is the data access and permissions · And fourth is internal task tracking If the comms aren’t clear or the handover isn’t fully documented or someone forgets to update access – that’s a failure chain. Final thoughts The Swiss Cheese model helps us see failure as a whole system and not just someone’s screw up. When combined with Business Excellence tools, you not only patch holes but build stronger and smarter slices.
-
In project management, Conformity Bias can have a big impact on decision-making. This happens when people value the group’s agreement more than their own opinions, which limits creativity and new ideas. How conformity bias affects decision-making: Team members may hold back their thoughts or worries because they fear social consequences or want to fit in. This results in a lack of different viewpoints that are needed for better decisions. People might go along with the main opinion without really considering other options, which can lead to bad project outcomes. It can stop the team from exploring new ideas, block creativity, and prevent them from adapting to changes in the project or market. When decisions are made under pressure to conform, people feel less responsible for the results, leading to a culture where mistakes are repeated without the lessons learned. Project managers can take steps to reduce the effects of conformity bias and encourage independent thinking by: Cultivating an environment where team members feel comfortable sharing their ideas. Clarifying and ensuring that all opinions are valuable by encouraging constructive criticism. Designating a "devil’s advocate" to challenge prevailing beliefs, spark discussions and take into account different perspectives. Using anonymous surveys or voting to get honest feedback without fear of judgment. Building diverse teams with people from different backgrounds to bring in a variety of viewpoints, preventing groupthink. Educating and training the team about biases, including conformity bias, so they can recognize and address them. Setting clear decision-making criteria based on project goals, ensuring discussions are supported by objective standards rather than just the group’s opinion. By understanding the effects of conformity bias and taking steps to reduce it, project managers can create an environment that improves decision-making and outcomes.
-
When it comes to Lean projects, Gantt charts might still have an advantage as they can be used to plan out long-term and structured projects as well as provide a detailed view of the resources and timelines, however, Kanban boards may be more effective when the focus is on flexibility, continuous improvement, and managing workflow efficiency. A comparison between Kanban and Gantt charts is shown in the table below: Feature/Aspect Kanban Gantt Chart Flexibility Highly flexible; adapts to changes easily in real-time. Less flexible; focuses on pre-planned schedules and milestones. Visual Workflow Displays tasks visually on a board, focusing on WIP and task flow. Displays tasks in a timeline format, focusing on start/end dates. Task Prioritization Tasks are pulled based on priority and availability; flow-based. Tasks are scheduled in advance with set deadlines; time-based. Focus on Continuous Improvement Encourages constant evaluation of processes for optimization. Less emphasis on ongoing improvement; focuses on following a structured plan. Real-time Progress Monitoring Always reflects the current state of tasks; real-time updates. Requires periodic updates; progress tied to pre-set deadlines. Managing Uncertainty Handles uncertainty well by adapting to changing priorities and demands. Struggles with uncertainty; changes in scope may require rescheduling. Complexity and Dependencies Works well for simpler projects with fewer dependencies. Ideal for projects with multiple dependencies and long-term planning. Resource Allocation Focuses on team capacity and flow, not specific resource scheduling. Provides detailed timelines for resource allocation and scheduling. Ideal For Ongoing, incremental work or projects requiring flexibility. Structured, deadline-driven projects with defined milestones. The above table displays the advantages and disadvantages of Kanban boards and Gantt charts. While Kanban boards might be beneficial when the emphasis is on flexibility, workflow management, and continuous improvement, Gantt charts are can be used while planning large, complex, and structured projects with fixed timelines. Ultimately, the choice between them should be guided by the needs and nature of the project as well as the working style of the team involved.
-
Taproot Analysis is a systematic incident investigation process designed to help organizations identify the underlying causes of problems and address the root causes. Originally developed for investigating incidents and accidents, this technique uses detailed forecasting, checklists and root cause trees guiding users through an investigation and ensuring that all the contributing factors are considered. Tools in a TapRoot Analysis 1. SnapChart: A visual representation of the timeline of events that led to the incident to discover what happened. It is also an information collection tool and a central repository for the data collected. 2. Root Cause Tree Diagram: A decision tree that helps investigators pinpoint the root cause by looking into categories like performance, procedures, equipment failures and management system failures. 3. Corrective Actions Helper Module: This is used to help investigators verify that they are addressing the real causes of the incident and develop corrective actions for the root causes by applying best practices. TapRoot vs Other RCA Techniques 1. Fishbone Diagram: is a tool used to document and identifiy the potential causes of a problem and uncover the root causes. It is best for quick brainstorming sessions and visualizing the potential causes. 2. Five whys (5whys): is a problem-solving methodology that explores the underlying cause-and-effect of a particular problem. It is a simple interrogative technique in which you repeatedly ask “Why” to peel away the layers of a problem and get to its root cause. It is ideal for quick problem-solving when time is limited, and the problem is not complex. TapRoot Vs Fishbone Diagram Vs 5 Whys: All three techniques are effective tools for root cause analysis but differ in structure, application and depth of analysis. Let’s compare these in the table below, Feature Taproot Analysis Fishbone Diagram 5 Whys Approach Systematic and structured Visual cause-and-effect representation Iterative questioning method Depth of Analysis In-depth, considers multiple causes Surface-level categorization of causes Limited to five levels of questioning Identification of Causes Identifies multiple root causes Typically identifies one or few causes Often identifies a single root cause Complexity More complex, requires training Simple and easy to create Very simple and quick to implement Time Requirement More time-consuming due to thoroughness Quick to create Quick to implement Actionability Provides specific, actionable solutions May yield general corrective actions May not yield actionable solutions Focus Systemic issues and human performance Individual problems and their causes Immediate causes leading to the problem Best Use Cases Complex problems needing detailed analysis Quick brainstorming sessions Simple problems or initial problem exploration Examples 1. Taproot Analysis can help the investigators analyse the sequence of events that lead to a failure, which helps to identify multiple causal factors through its structured process and Root Cause Tree. The 5 Whys analysis might only uncover a few causes, and Fishbone diagrams may not effectively capture the interrelationships between various factors. 2. Taproot emphasizes on evidence collection and analysis through tools like SnapChart, which helps eliminate opinion-based conclusions and ensure that corrective actions are based on solid data. In comparison, the 5 Why analysis may lead to subjective interpretations, and Fishbone diagrams might not provide sufficient detail for a thorough analysis. 3. Taproot analysis can help identify the root causes and facilitate the development of corrective actions as it is a multi-step process. This ensures that solutions address both specific incidents and broader systemic issues. The 5 Whys might result in superficial fixes, while Fishbone diagrams may generate general ideas without actionable steps. 4. Taproot’s focus on human factors explores how human interactions can contribute to errors. It can identify training gaps or procedural deficiencies that lead to mistakes, which may not completely be addressed by simpler methods like the 5 Whys or Fishbone diagrams.
-
The ADKAR Model is an organizational change management framework developed by Jeff Hiatt, founder of Prosci. The framework emphasizes on the outcomes an individual needs to achieve for change to be successful, which are, 1. Awareness: Understanding the need for change. 2. Desire: Supporting and participating in change. 3. Knowledge: Acquiring information and skills required to implement change. 4. Ability: Translating knowledge into action through practical application. 5. Reinforcement: Ensuring change is sustainable through support and encouragement. The ADKAR Model focuses on individual change, i.e. guiding individuals through a particular change and addressing roadblocks or barriers along the way. Integrating ADKAR into DMAIC Integrating the ADKAR Model with the DMAIC methodology in a Lean Six Sigma project enhances the effectiveness of change management by addressing process improvement and people’s responses to change. Every phase of DMAIC can be matched with ADKAR components to ensure that the solutions are implemented in such a way that takes care of the human factors as well. Let’s see how we can integrate the two: Define Phase: During this phase, you identify the problem, define the scope of the project and set the goals. At this stage, the focus should be on creating Awareness of the need for change among the stakeholders and cultivating their Desire to support the project, which can be achieved by clearly outlining the benefits of the change and why is it required for the business. How to Integrate? Holding meetings to explain the project’s importance and gathering inputs to engage the stakeholders, will make them feel involved and willing to support the initiative. Measure Phase In the measure phase, stakeholders should continue to gain Awareness of the problem through the data collected, and their Knowledge about the process and its performance should begin to develop. How to Integrate? Sharing findings with the team will increase their understanding of the current state and highlight the inefficiencies and gaps, to improve their knowledge about the changes that will be needed. Analyse Phase During the Analyse phase, the focus should be on deepening the stakeholders’ Knowledge and understanding of the issues and possible solutions to ensure that everyone is equipped to work on meaningful improvements. How to Integrate? Provide a detailed analysis and training on the identified issues so that the team members are informed on why the change is necessary and how these changes will address the root causes. Improve Phase During the Improve phase, the focus should shift to building Ability, so that the people involved in the project have the necessary skills, tools, and the confidence to implement the improvements effectively. How to Integrate? Provide training sessions, workshops, or hands-on practice to ensure that the team is able to carry out the process improvements successfully. Control Phase In the control phase, the focus should move to Reinforcement, ensuring that the changes stick. This might involve setting up systems for continuous feedback, rewards for maintaining the improvements and regular check-ins to ensure the new processes are being followed. How to Integrate? Implement performance dashboards, provide ongoing support and celebrate successes to reinforce the new processes and prevent slipping back to old behaviors. In conclusion, DMAIC provides a structured, data-driven framework for solving process issues, and ADKAR addresses the human side by ensuring that individuals are not only aware of the need for change, but are also motivated and able to execute it. Together, they ensure that process changes are effective and sustainable because they consider and address both technical and people solutions, reducing resistance to change, thereby ensuring smoother transitions in Lean Six Sigma projects.
-
Gamification, is the incorporation of game-like elements, such as point systems, badges, challenges and rewards into activities that are not games. This is done to make such activities fun, engaging and motivating for the user. Currently, gamification is being used in schools, corporates and e-training programs to keep learners/employees engaged and encouraging them to complete tasks. A very simple use of the same is Rewards & Recognition program within a company, when employees exhibit certain behaviours, they are rewarded and recognized giving them a sense of fulfilment and thereby motivating them to do or achieve more. In Lean Six Sigma (LSS) trainings, gamification can significantly enhance the effectiveness by making them more engaging, interactive and enjoyable. This allows for increased participation, greater retention of knowledge and show or create scenarios for application of concepts learned. Below are some use-cases for the same: 1. Badges Award badges for completing DMAIC phases, or offer "Kaizen Expert" badges for virtual events or "Waste Eliminator" badges for waste reduction. This can be incorporated within Accredible or even use Credly, which is a similar platform. 2. Simulations Simulated case study challenges or time-based DMAIC simulations can be built to train learners. Virtual Reality Simulators can also work well if incorporated into the same, providing immersive experiences on lean six sigma approaches and techniques. 3. Boss Fight Scenarios Conclude each module with a complex, multi-faceted problem (the “boss fight”) that integrates several LSS tools to reinforce cumulative learning. 4. Process Improvement Tournaments Virtual tournaments (similar to hackathons) can be introduced which carry certification, allowing proof of work/concept. This will also enable higher career prospects for the learners. To make gamification easier, a variety of tools, platforms, and services can be leveraged or similar features can be incorporated into the current LMS being used. Here are some of them: 1. Learning Management Systems (LMS) with Gamification Features Moodle: This open-source LMS offers gamification plug-ins like “Level Up!” and “Stash” for progress tracking, points, and leaderboards. 2. Gamified Learning Platforms Kahoot!: You can create quizzes related to LSS topics and have participants compete in real time, with points and leaderboards to make learning fun. 3. Simulation and VR-Based Learning Tools SimulTrain: A project management simulator that offers real-time simulation for problem-solving in process optimization. It can also be customized for Lean Six Sigma applications. iObeya: A Lean visual management platform that can be gamified by incorporating process simulation, team collaboration, and real-time problem-solving. Teams can work on shared virtual boards in real time. Uptale: This VR platform can be used to create immersive training environments where participants interact with simulated production lines, identifying waste and inefficiencies using Lean Six Sigma principles. 4. Challenge and Task Management Tools Trello with Gamify Add-On: Trello is a task management tool that can be gamified with the “Gamify” add-on, turning task completion into a points-based game. Trello boards can be used to assign tasks like completing a DMAIC project or running a Kaizen event. Asana with Karma Points: Asana is another task management platform that offers “Karma Points” for task completion, which can again be linked to Lean Six Sigma project milestones. 5. Game-Based Learning and Project Management Simulators Smartsims: A business simulation platform where learners can apply Lean Six Sigma tools in virtual manufacturing or service environments. The simulation is interactive, with real-time feedback based on performance. Process Playground by MoreSteam: Offers simulation-based Lean Six Sigma training. You can set up virtual scenarios for learners to apply LSS concepts like DMAIC, waste reduction, and process improvement in a simulated environment. 6. Virtual and Live Workshops Miro: Miro is an online whiteboard tool that can be gamified for live training workshops. Teams can compete to complete process maps, run simulations, or solve Lean problems in real-time. Mentimeter: A live polling and interactive quiz tool that can be used to engage participants during virtual Lean Six Sigma workshops. Use it to create interactive quizzes, challenges, and surveys during and after training. 7. Kaizen Tools KaiNexus: A platform designed for managing continuous improvement projects and Kaizen events. It can be used to gamify the Kaizen process by tracking participation, rewarding contribution, and measuring project success. Planview: This software allows you to manage Lean Six Sigma initiatives and gamify continuous improvement by setting up challenges, tracking KPIs, and rewarding milestones. 8. Custom-Built Gamification Platforms The Game Agency: Specializes in creating custom-built learning games. You can work with them to develop Lean Six Sigma-specific simulations, case studies, and challenges that align with your training goals. Gametize: A gamification platform where you can build customized games and challenges. This platform could be used to design interactive Lean Six Sigma scenarios, complete with quizzes, rewards, and leaderboards.
-
Management by Metrics is an approach that emphasizes the use of specific, quantifiable metrics to guide decisions, measure performance, or manage people and processes within an organization. The approach is rooted in the belief that “what gets measured, gets managed”. Originally, the “Management by Metric” approach was about using metrics as a tool to guide decision-making, identify areas of improvement and track progress, but when the focus shifts to ‘Managing the Metric”, the emphasis moves away from the actual performance or quality, and towards ensuring that the numbers in the reports look good. “Manage the metric”, as a concept arises when an organization’s focus shifts from genuinely improving processes, services or products based on meaningful metrics to simply manipulating or tweaking the metrics to present enhanced results. This shift or transition can lead to a cycle where organizations become overly fixated on the metrics, often at the expense of broader strategic objectives and customer satisfaction. Impact on Customer Satisfaction When an organization’s focus shifts to “Manage the metric”, the focus shifts from providing and generating genuine value, to ensuring that the performance numbers look good often resulting in shortcuts or superficial fixes that can damage customer experience. In this approach as the metrics are prioritized over meaningful outcomes, they risk losing sight of customer needs. For example, a customer service team’s performance is judged solely on the number of calls handled per hour. Due to this, the team might just rush through the interactions without truly resolving customer issues, but rather employing quick temporary fixes. This might make the metrics look good, but the customer is left unsatisfied. This eventually erodes customer loyalty and trust over time, which is crucial for long-term success. Example: Wells-Fargo Fake Accounts Scandal: During the early 2010’s, Wells Fargo implemented an aggressive sales strategy, to push employees to open new accounts for customers. As the targets were high and unrealistic, millions of fake bank and credit card accounts were created by the employees, without the customers' consent. While the number of new accounts grew, many customers weren’t aware that multiple accounts existed in their name, only to find out once the charges showed in their account. This scandal caused enormous harm to customer trust and Wells Fargo was fined heavily, losing thousands of customers who felt exploited and deceived. Impact on Business Growth The growth of a business is heavily reliant on delivering consistent value to their customers. When quality is sacrificed for the sake of hitting metrics, it can have a detrimental effect on the company’s overall trajectory. If teams are only concerned about hitting the targets without a focus on actual performance, the quality of products or services can decline, leading to high customer churn rates, negative reviews and damaged reputation, all of which stifle growth. Example:Blockbuster’s Failure and Netflix’s Rise: With a focus on revenue metrics tied to in-store rentals and late fees, blockbuster ignored the shift towards digital content. At one point, when Netflix approached them to sell the business, Blockbuster declined, focusing on its traditional video-rental model and improving the underlying metrics. In contrast, Netflix prioritized innovation and convenience, leading to its rise as a streaming powerhouse. Preventing the shift to “Manage the Metric” 1. Define Clear Metrics: The first step to prevent a shift to “Manage the Metric” is defining clear, relevant, attainable and measurable metrics in alignment with the organization’s goals and objectives. These metrics should align with strategic objectives and provide insights into customer value rather than just operational efficiency. 2. Use Outcome-Based Metrics: Shifting from output-focused metrics eg: number of calls answered, to outcome-based metrics such as customer satisfaction scores or retention rates, helps ensure that the focus remains on delivering value rather than merely meeting targets. 3. Drive a Culture of Continuous Improvement: Build a culture where employees are encouraged to question metrics and suggest improvements. This can help prevent an overreliance on metrics and also boost employee engagement driving a culture of continuous improvement. At PLS, Improvement Ideas’ generation is part of the performance criteria where employees get a few points on ideas generated and more points on ideas implemented; a total of 10% of performance criteria is based on this. 4. Regularly Review Metrics: Establish an annual or a biennial audit and review of the metrics to assess their effectiveness and relevance in the changing business environment. As the needs of the businesses evolve, so should the metrics used to measure success ensuring that metrics are aligned with the organizations goals and customer expectations. In conclusion, while metrics are essential for tracking progress and guiding decision-making, the shift from "Manage by Metric" to "Manage the Metric" can impact customer satisfaction and business growth. While superficial achievement of metrics may provide short-term wins, but it can result in customer dissatisfaction, damaged reputations, and missed opportunities for long-term growth. To prevent this, organizations must define clear, outcome-based metrics aligned with strategic goals, regularly review these metrics, and build a culture of continuous improvement. By focusing on delivering real value to customers, rather than just meeting numerical targets, businesses can ensure sustained growth and customer loyalty. Balancing the need for measurable outcomes with genuine performance improvements is key to avoiding the pitfalls of "Managing the Metric."
-
Persona Profiling is a technique of building a fictionalized and representative description of a business’s ideal customers based on actual research data. The profiling process entails gathering demographic, psychographic, and behavioural information to create personality archetypes that represent different segments or groups within the target market. The key elements of a persona profile may typically includes, Photos or illustrations to humanize and make the persona memorable. Demographics including name, age, location, etc. Other Basic Information such as bio, job title and education Psychographics such as personal values, personality, traits and archetypes Goals that the persona aims to achieve Skills, areas of expertise and technology proficiency Personal preferences such as favorite channels, preferred apps, trusted resources, etc. These persona profiles aren't just based on stereotypes, but they are built using real customer data, providing a deep understanding of individual customers. Benefits of Persona Profiling By incorporating the persona profiles into Lean Six Sigma projects, teams can ensure that their efforts are in line with the needs and expectations of the customers, leading to effective and customer-centric solutions. Let's have a look at how; Enhanced Customer Focus: By keeping the customer at the center of all decision-making processes we are able to understand the needs, pain points and motivations of different customer segments. Additionally, persona profiling can aid in idea generation and prioritizing features by keeping the focus on the customer throughout the project lifecycle. Relevant Data Collection: Data collection becomes targeted and meaningful when persona profiles guide the process. Teams can design and carry out data collection activities that are in line with the specific characteristics of each persona, leading to insights relevant to the project goals. Problem Identification: A deeper analysis of customer experiences can be done by incorporating persona profiling into LSS projects, which can help identify root causes of customer dissatisfaction or inefficiencies. By understanding how different personas engage with a process or a product, teams can uncover specific issues affecting each customer segment. For example, if a persona indicates frustration with longer wait times, the project can focus on streamlining processes that contributes to delays. Teams can also prioritize their efforts based on which customer segments are most impacted by specific issues, ensuring efficient resource allocation and focusing on improvements that will have the maximum impact on customer satisfaction. Tailored Solutions: By integrating persona profiling within LSS projects, we can develop customized solutions to meet the specific needs of different personas. For instance, a persona that values quick services may require process streamlining, while another that prioritizes detailed information might benefit from enhanced communication channels. Being able to customize solutions with such a focus on the voice of the customer leads to effective and widely accepted improvements. Empathy and Engagement: Persona profiling can help cultivate a strong sense of empathy among team members for the customers they are serving. When teams are able to visualize and understand the personas, they can engage deeply with the project and remain motivated to achieve outcomes that genuinely improve customer experiences. Sustainable Improvements: By keeping customer personas in mind throughout the DMAIC process, Lean Six Sigma teams are able to conceptualize improvements that are sustainable in the long term. The persona profiles also serve as a common reference point for all team members, ensuring that everyone is aligned on who the customers are and what they need, leading to a cohesive project execution. Continuous monitoring, improved communication and adjustments based on insights from different personas ensures that the improvements remain relevant as the customer needs evolve. Integrating Persona Profiling into DMAIC 1. Define Phase Customer-Centric Focus: In this phase, persona profiling can identify the key customer segments and their specific needs, ensuring that the project is focused on solving problems that matter the most to the target audience. Voice of the Customer: Persona profiles provide a clearer picture of the VOC by humanizing the data and customer feedback, aiding in setting of precise projects goals in line with customer expectations. For example, a financial services company may identify "FIRE-focused Millenial"* as a key persona to target for a new investment app. 2. Measure Phase Targeted Data Collection: The data collection process can be targeted to gather specific insights from the personas, leading to relevant and actionable data. Identifying Key Metrics: Persona profiles can help pinpoint which metrics are the most important to different customer segments. These might include satisfaction scores, response times or effectiveness of specific service touchpoints. For example, they key metrics for "FIRE-focused Millenial" may include time to open an account, mobile app rating, investment portfolio performance etc. 3. Analyse Phase Root Cause Analysis: By analysing data through the lens of different personas, teams are able to uncover pain points and inefficiencies affecting the different customer groups Prioritization of Issues: Profiling helps prioritize issues based on which customer segments are the most affected, ensuring improvements are made where they will have the maximum impact on satisfaction. For Example, analysing the account setup process, investment options and FIRE goals can help the team to address critical issues and that the solutions meet the target audience's needs. 4. Improve Phase Tailored Solutions: The improvement strategies can be tailored to address the unique needs of the different personas. Prototyping and Testing: Solutions can be tested with specific personas in mind, allowing for effective prototyping and refinements based on the feedback from representative customer groups. For example, the improvements may focus on streamlining the account opening process or providing personalized investment recommendations based on risk tolerance and FIRE goals or offering educational content on FIRE strategies or enabling seamless mobile access to account information and tools. 5. Control Phase Ongoing Monitoring: Post the implementation of improvements, ongoing monitoring can be put in place and tailored to measure the impact on different personas ensuring that the improvements continue to meet the expectations of all key customer segments. Sustaining Gains: By keeping the focus on the customer as the business evolves, ensuring continuous alignment with customer needs and preferences can help sustain the gains. For example, increase in percentage of income saved towards FIRE goals or continued usage of the mobile app and educational resources can be the success criteria for the "FIRE-focused Millenial" persona. References & Glossary 1. FIRE is the acronym for Financial Independence Retire Early movement. 2. https://www.robertacinus.it/en/blog/marketing/customer-personas-profiling-the-basic-step-to-boost-your-marketing-strategy/ 3. https://persona.qcri.org/blog/elements-of-a-persona-profile/
-
Post-purchase rationalization is a type of cognitive bias where someone who has purchased an expensive product or service overlooks any faults or defects in order to justify their decision and maintain a positive self-image about their choices. It is also known as 'Buyers Stockholm Syndrome' because the buyer develops a psychological attachment to the product, similar to how hostages develop a bond with their captors in the Stockholm syndrome, or 'Choice-supportive Bias' which is a tendency to retroactively ascribe positive attributes to a selected option. For Example; if someone buys an expensive gadget that doesn't live up to their expectations, they may focus on the features that they like and dismiss any flaws to feel better about their decision of purchasing the gadget. This also helps in reducing cognitive dissonance, or mental discomfort they might feel about the decision. Effect on Customer Satisfaction Metrics In the context of Lean Six Sigma, post-purchase rationalization can significantly contribute to skewed customer satisfaction metrics by portraying misleading impressions of how satisfied customers truly are with a product or service. Here's how it may affect the data, Inflated Satisfaction Scores: Customers experiencing post-purchase rationalization may report higher satisfaction levels than they actually feel, by downplaying any dissatisfaction they may have. This can lead to inflated satisfaction scores, making it seem that the product or service is performing better than it really is. Biased Feedback: When customers rationalize their purchase, and provide overly positive feedback, this can distort the voice of the customer, making it harder to identify areas of improvement. Masking Underlying Issues leading to missed improvement opportunities: Lean Six Sigma relies on data to identify defects and opportunities for improvement. If post-purchase rationalization causes underreported problems or overemphasized positives, it can lead to missed opportunities for improving the product or service. Misleading Loyalty metrics: Customers who rationalize their purchases are more likely to exhibit wavering loyalty over time, even when satisfaction scores in the short-term remain high. Identifying post-purchase rationalization Longitudinal Analysis: Tracking satisfaction metrics over a longer time period to see if their is a decline after the initial purchase. This indicates rationalization. Customer Journey Mapping: Comparing pre-purchase expectations with post purchase satisfaction to spot gaps and rationalization. Sentiment Analysis: Utilize sentiment analysis through social media mentions and online customer reviews can uncover how customers feel about their purchases and analyse open-ended feedback to inconsistencies between the same. Behavioural Analysis: Customer behaviours, such as return rates and post-purchase engagement can provide insights into the effectiveness of rationalization. High return rates or low engagement may suggest that customers are not satisfied despite their rationalizations. Additional Strategies to Rectify Post-purchase Rationalization Encourage transparent information relay in your communications and product information and communicate the value of honest feedback so the customers feel more informed and less likely to rationalize poor experiences. Monitor behavioral data such as tracking returns, product usage where possible to adjust your understanding of customer satisfaction. Repeat purchases is another metric that can be tracked to understand customer behavior. In conclusion, post-purchase rationalization can distort customer satisfaction metrics by causing customers to overlook flaws in a product or a service and report inflated satisfaction. This bias can lead to missed improvement opportunities as well as inaccurate data. To address this, businesses can analyse customer behaviours over longer time periods, engage in sentiment analysis and encourage true feedback to gain a clarity on their customer satisfaction scores.
-
What is Survivorship Bias? It is a type of cognitive sample selection bias where the focus is concentrated on data points or entities that passed a selection process, while overlooking others that did not. It leads us to draw incorrect conclusions since we are only focusing on the winners. For Example; an organization might study only successful businesses to identify winning strategies, but may ignore many other companies that implemented similar strategies, but failed. By focusing only on the survivors, incorrect conclusions may be drawn about the success of a strategy instead of also looking at other companies who might have failed just as often. Negative impact on decision-making Survivorship bias in an organization may lead to several issues, 1. Overestimating the success of certain strategies: Excluding companies from performance studies because they no longer exist causing the result of these studies to skew higher because only companies that were successful enough were included in the study. 2. Ignoring Key lessons from failures: Failures often contain lessons about what does not work. If we only analyse the survivors, crucial insights might be missed that could prevent repetitive mistakes. 3. Misallocation of resources: Allocation of resources in a seemingly promising technology, may not have a similar result as it did previously. This may occur if we study only those companies who were successful in the use and implementation of that technology. This can also lead to wasted time, effort and money on initiatives that are unlikely to succeed. 4. Creating a false sense of security: Leaders and decision makers might believe that their choices are fool proof, giving them a false sense of confidence, because these choices are modelled after successful examples. How to avoid Survivorship Bias? Avoiding survivorship bias involves consideration of both success and failures by ensuring that decisions are based on a complete picture. Study failures as well as successes to understand what went wrong and why, which in turn will provide a balanced perspective. Gather Comprehensive Data from multiple sources looking at both failed and successful ones. Involve Diverse Perspectives by brining in people with different backgrounds and experiences. Promote rational decision making by encouraging a culture of critical thinking and challenging the assumptions. Welcome both positive and negative feedback to highlight potential risks. Conduct experiments through pilot projects along with randomized trials to compare outcomes. Document and Review all outcomes to identify patterns, thereby, engaging in balanced decision-making.
-
Diagnostic analytics is a subset of data analysis focusing on understanding the reasons for the occurrence of a particular event. While descriptive analytics tells you the ‘what’ diagnostic analytics digs deeper to explain the reasons behind those outcomes – ‘the why”. This involves gathering data, analyzing it, identifying causes, and testing hypotheses. How It Fits into Problem Solving In the problem-solving domain, diagnostic analytics can assist when you are trying to figure out the underlying reasons for an issue, post identifying a problem. It helps decision-makers understand the factors contributing to a situation so they can address the root causes and not just the symptoms. This approach provides important insights that guide decisions and help prevent similar issues in the future. Here are a few examples: Sales: If a company sees a decline in sales, diagnostic analytics can help investigate factors like market changes, shifts in customer behavior, or the impact of competitor action. It can also assess the effectiveness of marketing strategies and staff performance. By examining these aspects, the company can pinpoint the exact reasons for the drop in sales. Transportation: When a transportation team experiences an uptick in delays, diagnostic analytics can help them analyze traffic patterns, vehicle maintenance issues, driver schedules, weather conditions, and route changes. By looking into these areas, transportation managers can figure out the reasons causing such delays. Human Resources: If a company notices a rise in employee turnover, the HR department can use diagnostic analytics to dig into potential reasons like job satisfaction, feedback from exit interviews, changes in remuneration, management practices, workload, or trends in the job market. This helps them understand why employees are leaving and what steps can be taken to improve retention. In short, diagnostic analytics turns raw data into useful insights, making it easier to make informed decisions and achieve better outcomes in the future.
-
The Concept of 'Audit by Design' 'Audit by Design' is a proactive strategy integrating audit concepts and practices into business systems at the outset rather than treating them as a stand-alone, periodic activity. This entails that control measures, risk management, and compliance are essential to business operations. Enhancing Business Excellence with 'Audit by Design' Businesses can promote continual improvement, improve compliance and risk management, increase operational efficiency, and build a culture of transparency and accountability, resulting in business excellence. Here’s how it works: Continuous Monitoring and Improvement: When audit principles are integrated with business operations, real-time oversight is possible, enabling faster identification and resolution of issues. For example, an E-commerce, D2C or retail company integrates automated compliance checks and real-time data analytics into its inventory management system, immediately notifying management in case of inconsistencies or compliance issues, allowing for prompt corrective actions. Risk Management: Businesses can effectively identify, evaluate, and manage risks by integrating audit procedures into routine activities. For example, a financial institution integrates risk assessment tools into its workflow, and each loan application is automatically evaluated against predefined risk criteria using real-time scoring and audit trails, lowering the chance of defaults and financial losses (NPAs). Transparency and Accountability: By employing clear & specific documentation and frequent reviews, audit processes integrated into routine business operations guarantee that all stakeholders understand their roles and how the organisation performs compared to the established benchmarks. Operational Efficiency: Business goals can be efficiently and effectively achieved when audit procedures are integrated with regular business activities. This enables minimal business disruption compared to the traditional approach to periodic audits. For example, A logistics company implements real-time tracking of shipments and automated compliance checks in its supply chain management system, reducing the need for periodic, manual audits. This ensures timely delivery of goods while maintaining high compliance standards. The Audit by Design strategy ensures that all regulatory obligations are consistently fulfilled across the organisation, reducing the likelihood of non-compliance and associated penalties. Adaptability in a Rapidly Changing Regulatory Environment The ‘Audit by Design’ approach is highly recommended in a regulatory environment that is evolving quickly. Here’s how it works: Agility and Responsiveness: Embedded audit principles allow quicker adaptation and modification of audit processes without overhauling the entire audit framework. Reduced Compliance Costs: Continuous monitoring reduces the need for corrective actions and the associated costs often arising from non-compliance issues. Enhanced Risk Mitigation: “Well begun is half done”—Aristotle's proverb demonstrates the validity of the ‘Audit by Design’ concept, which proactively identifies and notifies businesses of risks, enabling preparedness for regulatory changes and prompt actions during mitigation efforts. Competitive Advantage: A corporation can gain a competitive edge by consistently complying with regulatory requirements and managing risks effectively, ensuring reliability and stability, which is desirable to investors, clients, and other stakeholders. Conclusion The principles of Audit by Design can be effectively integrated into business processes to improve business excellence by encouraging ongoing attempts at improvement, efficient risk management, and consistent regulatory compliance. This strategy is crucial for preserving competitive advantage in a fast-changing market, cutting costs related to compliance, and maintaining agility.
-
Hello I developed an FTE forecasting model utilizing the following variables: Activity AHT (Average Handling Time) Volume Net Available Hours To calculate the total workload, I multiplied AHT by Volume. I then divided the total workload by Net Available Hours to determine the required FTEs. Subsequently, I ran a simulation using the higher value between the MEAN and MEDIAN of the AHT's minimum and maximum values. I defined Total FTE as the Forecast, calculated in the previous steps. Q1. Is this the correct approach? Q2. How can I maximize the accuracy of the calculations? Q3. If I need to optimize the forecast, what should I use as the decision variables? Should it be Net Available Hours or another?

