

Vishal Melwani1
Members
-
Joined
-
Last visited
Everything posted by Vishal Melwani1
-
Vishal Melwani1 replied to Vishwadeep Khatri's topic in We ask and you answer! The best answer wins!Freemium model is one of the latest trends companies have come up with to introduce new products/ services in the market by offering basic features at zero cost and charging a premium for more advanced services. Freemium models help companies cut down on CAC (Customer Acquisition Costs) since there is very limited money spent on advertising the go with the approach of "Proof lies in the pudding". Customer are already using some features for free and have a good idea on the premium model. Some examples of Freemium model include: Google Drive: Limited storage space for free; paid version gives you more storage. Spotify: Listen to music interrupted with ads, inability to skip songs in the free version. The paid version lets you listen to songs break-free and ability to customise playlists. OTT Platforms: Some offer free viewing of limited TV shows and movies and the paid version unlocks many more. Dating apps: Swipe right on limited profiles for free. Paid version gives you unlimited swipes with ability to initiate conversations. Zoom: Free version gives you 45 mins of meeting time. Paid version has no time limit. There are many such examples of Freemium models in our day to day life. Like any other industry, Lean Six Sima can be applied in the Freemium model as well. By understanding each product delivery model in detail and mapping out the end to end process map, wastes can be minimised and defects can be reduced. This will enable cut down company costs even more, thus delivering a better RoI for them. Another thought is offering customers a taste of Lean Six Sigma principles by performing free consulting assignments for them and help them streamline a part of their process. As customers see the value brought by the 'pilot' approach, they would pay to have a full fledged Lean Six Sigma program deployed in their organisations.
-
Vishal Melwani1 replied to Vishwadeep Khatri's topic in We ask and you answer! The best answer wins!During the course of a DMAIC project, we establish current process performance, or baseline, at the Define stage. This tells us where the process is at the start of the project or what the current baseline metric is. With the baseline established, we establish a project goal. The goal is typically one that is stated by the customer or by internal stakeholders. The DMAIC project aims to meet the defined project goal. At the Improve phase, we identify potential solutions that will help us achieve our project goal. Process Benchmarking helps us get more out of our project by meeting industry standards or best process performance. Simply put, benchmarking is our final goal and is determined by understanding best practices at the market or even within the organisation. Let's take an example of a cycle time reduction project in an insurance process: Insurer ABC takes on an average 60 days to resolve a claim. This has been deemed high since it leads to customer complaints, customer churn, loss of revenue, etc. A GB project was taken to reduce the overall claim process cycle time from 60 days to 45 days since it was observed that customers usually start following up post 45 days of claim submission. The project started and solutions were identified at the Improve phase that would help achieve the goal of 45 days. However, when a study was conducted, it was observed that the average time taken by top Insurers in the same geography was around 30 days. These Insurers had the highest customer retention and minimal complaints. Therefore, while the project goal of 45 days could have been met, in order to achieve best-in-class solutions at an industry level, the Project Lead added more solutions that would help him meet the goal of 30 days.
-
Vishal Melwani1 replied to Vishwadeep Khatri's topic in We ask and you answer! The best answer wins!The methodology of creating new products/ services in developing countries, rather than developed countries is called Reverse Innovation. This, slightly contronversial subject, was introduced by Jeff Immelt (Chairman and CEO of General Electrics), Vijay Govindarajan (Professor of International Business) and Chris Trimble. By applying concepts and innovations in developing countries, the success can then be transferred to the developed countries. Implementing Reverse Innovation is developing countries/ emerging markets, helps them in the following ways: Cost: Solutions implemented in emerging markets generally tend to be less expensive. This helps in creating a wider market for adaptability and usage. Accessibility: Since the cost is low, these markets are able to access the products/ services more easily and that helps in achieving a larger sample size of usage feedback. Prototype: Upon successful implementation in developing countries, these products can be taken to developed countries with a higher degree of confidence of success. Some examples of Reverse Innovation in the Indian market: Tata Nano car Tata Swacch water purifier Pepsico Kurkure Low cost Air Conditioners by multiple brands Vicks Honey Cough The benefits of Reverse Innovation are: Learning opportunities: By running cost efficient prototypes, companies can learn from mistakes made and best practises shared during the journey. This helps them in perfecting the product for future developments. More innovations: Multiple iterations of the product can help companies come up with more innovations that they could potentially prototype in the developing markets. Testing out the market: New products in developing countries help the manufacturers do a thorough testing of the emerging market and apply the concepts in the developed countries. Challenges in deploying Reverse Innovation: High investment cost: Since new products are being developed and even though the market is developing countries, high costs such as customer acquisition, market strategy, infrastructure and distribution. Acceptance of change: Since reverse innovation relies of product disruption, accepting these new products are usually a challenge. Classic example of the Tata Nano car. Conceptually good but the sales weren't as expected by Tata. Environmental hazards: New products generally do not focus on environmental impact, thus carbon emission is high and recycling is not a priority.
-
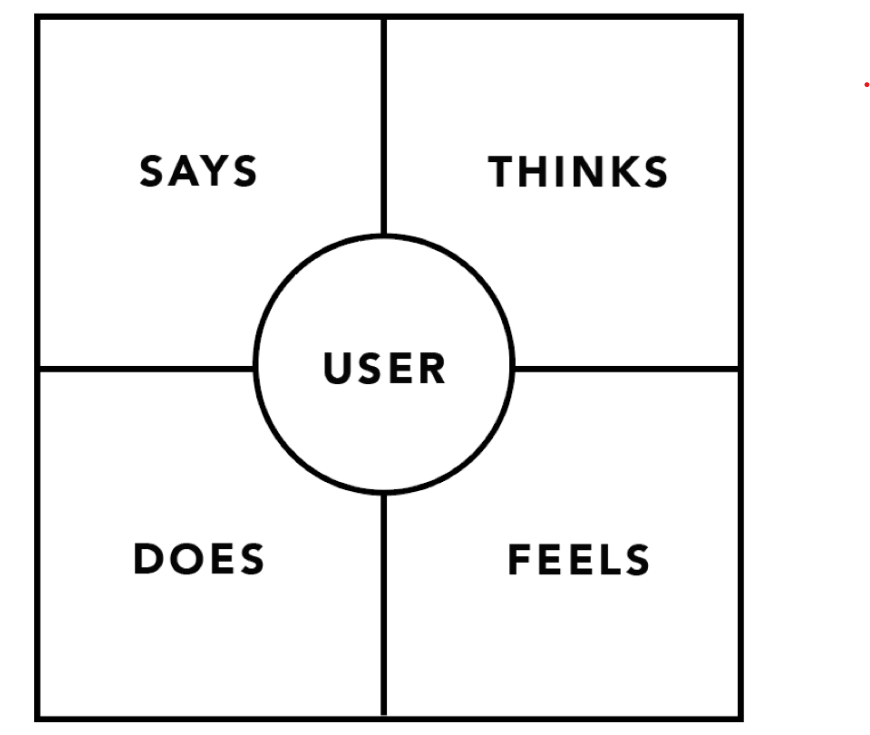
Vishal Melwani1 replied to Vishwadeep Khatri's topic in We ask and you answer! The best answer wins!Empathy Map is one of the key elements of the larger Design Thinking framework. It is essentially a visual tool that uses a collaborative approach in understanding a user's need in detail. It drills down a user's thoughts/ views in to actionable outcomes and priorities. An empathy map contains four quadrants, with the user at its center. Empathy map format: Let's understand how this helps in understanding the user's requirement during the development of a new product. Says: In this quadrant, we write down what the user/ customer is saying out loud or quoted from their verbatim. For example, "I would like my information to be secure", "I want the the user interface easy and friendly" Thinks: Here, we write down what we feel the user is thinking. This can be tricky since this is not verbally stated by the user. However, using our prior experience in the field and by asking probing questions, we can arrive at the user's thoughts. For example, "Why is the payment screen taking so long to come up?", "There are too many ads on the home screen" Does: In this quadrant, we write down the typical actions a user does. Again, this can be best obtained through research/ experience. For example, "Stuck on payment screen", "Finds home page navigation challenging" Feels: This is the most tricky quadrant. Here, we write down what the user's sentiments are. As a product developer, we need to ask ourselves what bothers the user, how does he feel when navigating through the platform, does he get irate at a certain screen, etc. For example, "He is impatient when he has to wait for a page to load ", "He his happy to see a discount percentage upfront" Basis all of this information gathered, we can now write down challenges/ opportunity areas and come up with clear goals/ action plans when developing the new product.
-
Vishal Melwani1 replied to Vishwadeep Khatri's topic in We ask and you answer! The best answer wins!Cross Docking is basically distribution of incoming goods in a more efficient manner when compared to the traditional method of storing them in warehouses. Rather than keeping them stored for weeks or months at a time, these goods are sorted at their cross docking facility as soon as they are received and loaded directly onto the trucks for shipping. This is especially helpful with products that have a relatively short shelf life such as food and medicines. There are essentially two types of cross docking: In Pre-distribution cross docking, the end customer information is known in advance and the goods are arranged to be sent out accordingly. In Post-distribution cross docking, the products are stored until the final customer information is known. For an efficient JIT process, the pre-distribution type is best suited. In a service organization, cross docking will help in: Reducing Turnaround time of end product shipment Reducing overall square feet area of warehouses Improving overall ROI by reducing transportation costs Creating a smooth and efficient process cycle Cutting down on inventory costs Amazon has successfully implemented Cross docking in its FBA (Fulfillment By Amazon) LOB. Here, the freight forwarder receives the PO, unloads the products and segregates them by product destination. The products are then immediately sent to the Amazon Fulfillment center. This has helped Amazon's sellers in eliminating the need for storage & handling and reducing time taken for their products to arrive at the fulfillment center.
-
Vishal Melwani1 replied to Vishwadeep Khatri's topic in We ask and you answer! The best answer wins!Control chart is a very powerful tool to constantly monitor a process performance. By implementing them on either input or output metrics, management can monitor progress and check each time a data point is out of control. There are many types of control chart, depending on whether the data is discrete or continuous. Some of the examples of control charts are X-bar, P chart, U chart, NP chart, etc. The frequency to monitor the process data points depicted on a control chart depends entirely on the frequency at which the data is reported/ analysed/ received. Let's take an example of an invoice processing process. The Turnaround time to complete the processing of each invoice is at an average of 2 hours. Therefore, every 2 hours we should see an additional data point on the TAT control chart. In this case, it is advisable to monitor the process every 2 hours so any anomalies (out of control data point) can be instantly caught and analysed. If this monitoring time is too long, SLA will be missed. If it is too short, it would add no value in monitoring the process. Another example would be at a call centre. The AHT to complete a call is defined at an SLA of 5 mins (including hold time, after call work, etc). For the associates to achieve this, it is determined that at any point, there shouldn't be more than 3 calls in queue. Plotting calls in queue every minute, in a control chart, will help us understand spikes and special/ common causes for high call volume and this should ideally be monitored every minute or two. In case incoming call volume is monitored every one hour, instead of one minute, there would be multiple instances of calls getting dropped and/or expected AHT being missed. Therefore, the frequency to monitor a control chart is dependent entirely on the nature of business and expected SLAs.
-
Vishal Melwani1 replied to Vishwadeep Khatri's topic in We ask and you answer! The best answer wins!Traditional Analytics (also known as Historical Analytics) is the methodology of interpreting patters of data from historic values. The data that is used for analysis is based on information that has already occurred in the business. Using this data helps companies understand their business performance and the variation of their key metrics over time. Data trends from the past makes it easier to understand how the metrics will perform in the future. The larger the date range, the more accurate the output. This prediction modelling helps businesses plan for the future. For instance, historic call volume in a BPO will help companies predict future call volumes and spikes and help in better capacity planning. Real-time Analytics considers data trends that are live. It gives you insights on how the current performance is and show up results that can be stratified in to different segments. For instance, a real-time dashboard depicting current Service Level performance, quality scores etc. While Traditional analytics is static in nature, Real-Time analytics are dynamic. Real-Time analytics helps teams and individuals monitor their current process performance and make changes as per the requirement. For instance, a manager views a real-time dashboard and sees that there are 3 analysts in skill A who are idle and there is a call queue for analysts in skill B, if the skill A analysts are cross-trained, the manager can utilise them in the skill B queue. With real-time analytics, businesses don't respond to issues after they've occurred, as in the case of traditional analytics. They make decisions basis current data output. Challenges in deploying real-time analytics: While real-time analytics is overwhelmingly more advantageous than traditional analytics, industries face some of the below challenges in implementing them: 1. Data sanity - Since data used is real-time, the accuracy of the data becomes of vital importance. If even a single data point is incorrect, it may provide a highly incorrect output. While in traditional analytics, historic data can be re-checked, that is not possible in real-time analytics. 2. Change acceptance - Since traditional analytics has been used for years now, changing leadership mindset in adopting real-time analytics can be seen as a challenge. 3. Implementing right solutions - The output from real-time analytics is to be scrutinised further and fit well in to the business. Traditional model gives us definitive action point. The same is difficult in the real-time scenario. 4. Cost - The cost associated with real-time analytics is much higher than deploying traditional methods.
-
Vishal Melwani1 replied to Vishwadeep Khatri's topic in We ask and you answer! The best answer wins!Modelling and Simulation. Two methodologies that are vital in mathematical, engineering and scientific applications. Let's understand them briefly first and then dive in to some of their key differences. Modelling: The term Modelling can be defined as a representation of a system or a process. The representation can be in the form of physical, mathematical or logical representation. The physical model of the product to be designed is usually a scaled down version of the original form. For example, the model of a house, a car, an aircraft, etc. Modelling is usually done when the original product is to be experienced but can be made available to a wider audience with lesser cost implications. For instance, when we look for a new house that is under construction, the model flat is a good way to experience the apartment before it is ready. A mathematical model usually describes the system with a defined set of variables or equations. For example, if we go on a cross-country road trip and want to budget our trip, we take in to account the cost of fuel for the trip. This can be achieved by a simple mathematical model of knowing the distance and average vehicle mileage and thus calculating the approximate fuel cost. Another example would be to calculate monthly recurring expenses such as electricity, gas, maintenance, etc. Simulation: Taking it to the next step, a model can be used to design a simulation. A simulation is the process of designing a system that studies the characteristics of an actual or hypothetical system. Simulations enable the assessment of a model for optimising system performance or predicting outcomes in a real-world scenario. Simulations are used to train people before applying the learning in the real world. A classic example of simulation is learning to drive a car. Before getting behind the wheel, many car learning centres have a simulation model of the car that connects to a TV screen. This gives the driver the feel of driving a car on the road and helps them prepare better for when they get on the road in real life. Another commonly used instance is a flight simulation. Let's look at some key differences: Modelling Simulation A version (usually scaled-down) of a physical object | An operation conducted using a model Uses the same variables of the original product | New variables are considered basis process variation No performance trend is shown | Shows performance over time Static in nature | Takes in to consideration dynamic variability Changes are made only basis the actual product | Many parameters can be changed to arrive at optimum simulation
-
Vishal Melwani1 replied to Vishwadeep Khatri's topic in We ask and you answer! The best answer wins!In a typical organisation, the strategic goals are primarily towards Financials (profit improvement) and Employees (people improvement). Triple Bottom Line suggests incorporating a third strategic goal - Environment. By incorporating this change, companies can focus on our planet's sustainability as well, as this is an important initiative for the betterment of the planet. The 3 P's of Triple Bottom Line: Profit - Focus on company's financial performance, stakeholder profit, RoI etc. People - Focus on employee benefits, wellbeing, CSR activities, etc. Planet - Focus on reducing carbon footprint, impacting climate change, etc. How to embrace this change? It's not easy to implement Triple Bottom Line, especially since companies are not well equipped with making changes that impact the last P - Planet. Some of the steps organisations can take towards this goal are: Embrace change management - It is vital to arrive at an open mindset to deploy and manage change management in the company, especially something as large as reducing carbon foot print. Small changes equal larger change - Start implementing changes at grass root level. By conducing workshops and awareness sessions to people at the ground level, will create the most impact since they typically constitute 60-65% of the workforce. Assign goals - Start assigning goals such as zero carbon foot print, pollution emission levels, etc. Start with higher goals and break them down in to sub-goals such as number of trucks used for transportation, reams of paper used for printing etc. Companies that have embraced Triple Bottom Line: Apple Inc. - Apple has publicity stated their 2030 goal is to be completely carbon neutral. They have taken steps in this direction by shipping out smaller packaging, introducing watch straps with 100% recyclable material, not shipping chargers with phones, etc. DHL - To reduce pollution, DHL has started implementing bicycle delivery mechanism, as opposed to cars and trucks. Their target is to reduce CO2 emissions by 150 metric tonnes a year Novo Nordisk - This Denmark based Pharma company started implementing Triple Bottom Line before anyone else, in the year 2004. They commit towards the three P's as mentioned before.
-
Vishal Melwani1 replied to Vishwadeep Khatri's topic in We ask and you answer! The best answer wins!Text Analytics (equipped with AI) has come a long way. In the initial days of Text Analytics, there were some major challenges such as converting unstructured data, handling ambiguity, language barriers and different styles/ dialects within a language itself. With the advent of advanced AI such as machine learning, some of these challenges have been overcome and the quality of output now with Text Analytics is much better than what it was at its origin years. As of today, some challenges still exist and addressing these would certainly help us accept the usage of Text Analytics even more. Some of these include: 1. Understanding hidden sentiments 2. Detecting sarcasm 3. Privacy concerns (probably the biggest challenge) 4. Multi lingual conversations 5. Legal complications and unspoken rules.
