

Saurabh N.
Members
-
Joined
-
Last visited
-
Standard operating procedure (SOP) is a step-by-step approach to achieve quality output with increased efficiency and better performance. It’s also used to achieve better repeatability and reproducibility in final output by reducing errors and avoiding potential manufacturing failures. Although standardization is useful in an organization, too much of standardization may not be good for organization which strives for innovation and creativity or organization which require out of box thinking for growth. Dis-advantages of over Standardization. - It discourages creativity and innovation. - Not good for unique challenges in organization. - Restricts out of box thinking. - May not be suitable for some aspects and may have reverse effect. - May Limit growth of an organization. Way to balance between over standardization and creativity. - To Adopt flexible mind set. - To define clear goals and timeline for business. - To follow best practice & control plan suitable for business. - To review the results and choose appropriate action based on goals. It’s important to identify & prioritize the requirements. Prioritize creativity and innovation when business demands growth for certain processes. Prioritize standardization and SOP when business demands consistency for certain processes. Balancing between standardization and creativity can bring stable growth for an organization.
-
Value chain analysis is a process that can strategically increase profit margins and provide competitive advantages for company and purpose of value chain analysis is to give clear path towards profitability of company by determining best strategies within the current market. Process mapping is a planning and management tool that describes the workflow and Purpose of process mapping is to improve the efficiency. It gives insight of process for improvement by identifying bottleneck and delays. Differences between Value chain analysis (VCA) and Process mapping Sr No. Value Chain Analysis Process Mapping 1 VCA helps to improve profit. Process mapping helps improve efficiency. 2 VCA helps understand market competition. Process Mapping help understand process. 3 VCA is used to standardize and optimize the process. Process mapping can be used for improvement of process. 4 VCA is focused on cost. Process mapping is focused on process, quality improvement. 5 VCA is a decision support tool for making strategy. Process mapping is a management tool that describes workflow. 6 VCA described through set of chevrons which represents activities of an organization. Process mapping is represented most with flow chart. Value chain Analysis usages: - - To establish better vendor management. - To reduce cost and delivery time. - To optimize inventory. - To standardize and optimize the process. - To be competitive in market. Process mapping usages: - - To Understand the process. - To analyze improvement of process. - To Plan project. - To solve problem and make decisions. - To create project design. - To understand process from start to end.
-
Lean and Theory of constrain (TOC) differ in certain areas. Lean segments a company into individual parts that can be analyze and improved, however, TOC on other hand focuses on single constrain that can be improved and benefit the company. lean focused on reducing time and inventory to cut waste and removing non-value-added task in process, however, TOC aims to improve throughput, capacity and develops competitive edge. Lean and TOC, both aim to improve the efficiency of company but in a different way. Below is pointwise comparison of Theory of constrain (TOC) and Lean. Sr No. Theory of Constraints (TOC) Lean 1 TOC helps to Increase throughput. Lean helps to Eliminate waste. 2 TOC has Singular focus on constrain. Lean has Broad focus on eliminating waste from process. 3 TOC us useful in Increasing manufacturing capacity. Reduced manufacturing cost. 4 TOC helps Maintaining sufficient inventory to maximize throughput at constrain. Lean helps controlling inventory to reduce waste. 5 TOC creates imbalance to maximize throughput. Lean creates balance to eliminate waste. 6 TOC has Bottleneck oriented approach. Lean has overall system / Process related approach, 7 TOC focuses on waiting time reduction. Lean focuses on cycle time reduction. Example: - Inventory TOC- Focuses on Maintaining a small stock of material that is ready for assembly process ensuring part for assembly is sufficient for a certain duration, this way, in case of unforeseen challenges, there will be some stock to maintain the constraint at maximum capacity in order to increase the throughput. However, Lean Focuses on identifying and eliminating additional inventory (Waste) for enhancing value of company. Although, Lean and TOC methodology differ in certain areas, they use Pull system to keep consistency in timely deliveries and both require continuous improvement.
-
Text analytics is the business focused concept of transforming unstructured text data into structured and usable data. It's considered to be an important part of business intelligence processes as it used to improve product, employee experience and customer satisfaction. Text analysis uses many statical and machine learning techniques, these techniques involve information retrieval from unstructured input data like measure of customer feedback, product reviews etc. and processes into outputs like derived pattern, trends, or focused action. Text analytics is divided into different group. Descriptive Analytics - Unstructured text into trends. Predictive Analytics - Unstructured historical information into trends. Prescriptive Analytics - Unstructured information into data driven strategies or recommended action. Organizations can leverage text analytics to generate useful information from unstructured data which can be used to focus on targeted action to improve customer satisfaction by identifying causes and churn, examining emerging trend, unlocking new opportunities, capturing market with effective marketing. Challenges in Text Analytics Text analytics is challenging due to quality, quantity and complexity of data being captured. Also captured data can be incomplete, inconsistent or may have error. It required lot of storages for significantly high quantity of data with complexity. It is difficult to integrate and combine data in different format such as in form of images, Audio, Video. Text analytics tool must be compatible with data infrastructure and system. Solutions for Challenges Data Pre-processing and Pre-cleaning is essential for text analytics to reduce complexity and improve quality. Data Pre-processing and Pre-cleaning also helps to reduce load on server due on extra storage. Data analysis can be done using algorithm and techniques such as machine NPL, learning, deep cleaning. Various tools such as PythoneR, PyTorch, PacCy are being used to perform these tasks.
-
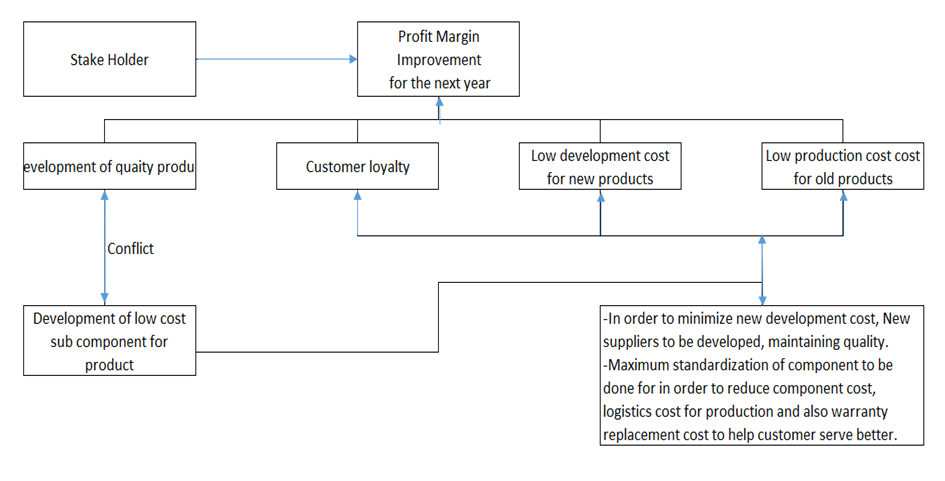
Goal mean diagram is a goal driven approach that visualizes goals to determine the best possible strategy for given situation. This approach is used to determine relationship between goals and stakeholders so that sustainable alignment can be developed for goals with individual priorities set by stake holders. Goal diagram helps us understand the goal easily as indicated in below example. Example:- Goals is a best way to understand what requirement or priorities of stakeholder. It can be read in two directions: - From top to bottom- This direction answers ’How can it be done?’, In example, how profit margin can be improved? By reducing development and production cost. From bottom to top- This direction answers ’Why?’, In example why standardization and new supplier development is required? To Improve profit margin Goal diagram is consisting of ‘OR’ & ‘AND’ logic. AND logic is used where goal has sub-goals that all must be met in order to achieve goal. OR logic is used where goal is broken down into sub goals but only one of them must be fulfilled to achieve goal. Advantages of Goal mean diagram. - Individual goal and interaction of goals are easy to understand. - Makes easy to take decision about process improvement. - Contradiction can be identified at the early stage so the correct decision can be made. - Conflict can be identified so that undesirable development can be avoided.
-
Risk register is a tool that helps track issues and address if it arises. Risk register is an important component of risk management framework which needs to be created at the initial stage of the project as it records the risk which has been identified and analyzed along with the mitigation plan. The mitigation plan is based on the severity of the Risk. Risks in register can be added or removed based on project requirement. Additional risk can be added in exiting risk register including priority and severity of the risk. If any specific risk is managed or no longer relevant, then it can be removed from risk register along with respective mitigation for that risk. Risk register can be used for process management for the identification of risk, analyzing of risk such as severity, occurrence & Impact of risk and based respective mitigation plan is indicated as mentioned below. Risk register is one of the most important part of risk management strategy, though sometimes it could be difficult to maintain risk register consistently but if maintained religiously, it can help to avoid or manage risks effortlessly. This may also result in saving more time which can be spent on learning, development of skills and innovation.

-
Percentile is known as relative value that is used to indicate comparison of the given value with the rest. Percentile measures a candidate to other candidate in comparison. This comparison can also be used to know relative performance of employees, processes, performances within an organization. Percentage and percentile are two different concepts as mentioned below:- Sr. No. Percentage Percentile 1 shows the individual score out of 100. shows a comparison of relative value. 2 Example: 80 percent in a test indicates that 80 answers out of 100 are correct Example: 80th percentile indicates that candidate is better than 80 others 3 Percentage does not compare the given value. Percentile used to compare the given value with the rest. 4 Percentage can be expressed in decimals. Percentiles cannot be expressed in decimal. 5 Percentage indicates the value. Percentiles indicate the rank. 6 Percentage is calculated based on individual performance. Percentile is calculated based on relative performance. Percentile ranks can be one way to know your organizations process improvements by comparing it to similar process in other department or organizations. percentile ranks are fast and effective way to decide the best option of process based on feedback, survey, internal testes etc. Percentile ranks make it easier for managers to compare which process is a better fit, based on available data.
-
Concept of Process entitlement is mainly used in improvement of process and selection of projects. Entitlement is known as the optimum performance which can be expected to be delivered from current process configuration without making any change. Entitlement defines the optimum level of performance possible for process, it provides vision to reach best possible performance by determining the gap between current performance and entitlement. To calculate or determine process entitlement, we need to review current performance, industry benchmark and process entitlement. Let’s consider an example for performance of an organization which is indicated in scale of Level 1 to Level 10. In above Fig-1 Current process performance (level-6) is close to process entitlement ( Level-7) but Industry benchmark or competitors ( Level-9) are still ahead of process entitlement level, In this case process improvement by 1 level to match process entitled level would not be sufficient as it will not exceed performance beyond competitors performance (Level 9), this situation will require change in process design in order to be competitive in market. In below Fig-2, Current process performance (Level-6) is below industry benchmark (Level-7) and entitlement (Level-9), by calculating the gap between industry benchmark (Level-7) and entitlement (Level-9) organization can deliver best possible result by focusing on improvement on 2 levels higher than current process performance. Knowing process entitlement let us know what’s possible by comparing current performance with best possible performance. It provides benchmark that can be used to compare with processes in other organization as well as with processes within the organization. This concept can be used for improvement of all key processes like Yield, cost of poor quality, downtime, waste etc. in order to deliver the best performance within organization.


-
Hammock is a project management planning term used for identification & segregation of sub tasks which are not interlinked to other tasks, but these tasks must be completed before ending current activity or starting another activity in order to achieve desired target. Hammock activity has no fixed duration. The time assigned to the activities is flexible and it can be used in reduction of wastes in organization. The 7 wastes (Muda) in lean management are described as WORMPIT. W-Waiting O-Over production R- Rework M-Motion P-Over Processing I-Inventory T-Transportation In Lean, substantial reduction in W(Waiting time) is possible by planning Hammock activities. Let’s consider below example where product launch in manufacturing company is planned. Final QA/QC Approved Product ( Main Task-1) Product launch (Main Task-2) Location Finalization (Subtask) Advertisement (Subtask) Guest List (Subtask) In above example Product launch in a manufacturing company is being planned, It consist of Main tasks like Final QA/QC approved product which is getting ready to be launched in market and it also consists of multiple sub tasks like “Finalization of location’, “preparation of List of guests”, “Advertisement”, etc. Both Main tasks 1 & 2 are linked and to be executed in sequence however, any of sub tasks can be done first, without the other being initiated or completed. But there is an overall target to complete these tasks within specified timeline which must not be exceeded. Planning of Hammock activities help to improve efficiency and productivity of team and help reducing waiting time effectively.
-
Float is a time (Float time) is also referred as slack time that indicates particular tasks that can be delayed without delaying the project deadlines. In float time, scheduling of task becomes more flexible which can be used to offset many risks, if planned properly. Float time is typically presented with no. of days, weeks or month that gives project lead a flexibility on how long a task can wait before proceeding with the subsequent task. In order to make most out of float time, it is crucial for project lead to identify and strategically plan the activities. Identification of float time improves the productivity of projects as every Project is unique and may involve many complex sequences of tasks, some of these tasks are critical tasks, which means that project lead has to make sure that these tasks are completed in defined timeline. However, some of the tasks are non-critical tasks which can be done in less time & these tasks do not have any impact on subsequent tasks, the difference in Critical task time and non-critical task time is referred as float time. Below is simple Example of float in CPM: - Activity Activity Time Intermediate Predecessor Start 0 - A 4 Start B 6 A C 6 A D 5 B E 7 C, D End 0 E With reference to above diagram and calculation, it’s important to Identify critical and non-critical activities. Critical activities must be completed within specified timelines to prevent project delays while non-critical activities have some flexibility and by distinguishing between these two, project lead can focus on utilizing float time for non-critical activities without compromising project deadlines. Utilization of float time can be determined to understand the potential impact on the project, resources required for meeting timeline of other critical tasks, Engaging resources in Improvement project like process improvement, professional skill development or Innovation activities etc.

-
Saurabh N. changed their profile photo
-
The actual requirement of the FMEA is to create a very useful document used for making strategic decisions based on risk involved in process. FMEA can be characterized in the relative risk contribution of potential failure areas associated with the process in terms of a risk priority number (RPN). This RPN can be obtained as a product of three phase of framework representing below. · Severity of Occurrence · Frequency of Occurrence · Chance of Detection RPN Scales usually range from 1 to 10, with the higher number representing the higher seriousness or risk. considering ten-point Occurrence scale, 10 indicates that the failure is very likely to be occurred and is worst compared to 1 which indicates that the failure is very rare to be occurred. Severity- Which indicates that the occurrence of severity of the potential effect of the failure is high when rated as 10 and low when rated as 1. Occurrence- Which indicates that the frequency of occurrence of the potential effect of the failure is high when rated as 10 and low when rated as 1. Detection - Which indicates that the chance of detection of the potential effect of the failure is high when rated as 10 and low when rated as 1. For each potential cause, the individual factors occurrence (O), severity (S), and detection (D)are rated and multiplied together. PRN= Severity (S) X Occurrence (O) X Detection(D) In order to improve the rating of PRN suitable actions cab be taken and risk can be reduced However, the specific rating criteria for the ranking of occurrence (O), severity (S), and detection (D) are defined by the individual organization based on process and priorities. · Reduce the severity. · Reduce the probability. · Improve the design to improve the control over detection Example:- Potential failure areas with risk priority number (RPN) improvement in bottling plant. Sr No Process Potential Failure mode Potential effect of Failure Severity (S) Potential Cause/ Mechanism of Failure Occurrence (O) Current Process control Detection (D) Risk Priority No (S*O*D) 1 Bottling plant Less quantity Customer complain 5 Filler 2 Weight gauge 3 30 2 Bottling plant Insufficient seal Mixing with other substance 3 Heat Sealer 5 Seal Test 4 60 3 Bottling plant Wrong marking Expiry period 1 Manual Labeler 5 Random In Process check 3 15 For above example below Corrective Actions can be implemented such as: Installing automatic labeler can help improving mechanism by removing potential cause for frequency of occurrence. Installing sensor based continuous automatic Checking system to reduce chance of detection. Sr No Process Potential Failure mode Potential effect of Failure Severity Potential Cause/ Mechanism of Failure Occurrence Current Process control Detection Risk Priority No 1 Bottling plant Less quantity Customer complain 5 Filler 2 Weight gauge 3 30 2 Bottling plant Insufficient seal Mixing with other substance 3 Heat Sealer 5 Seal Test 4 60 3 Bottling plant Wrong marking Expiry period 1 Automatic Labeler 1 Continuous Sensor based Automatic Checking 1 1
