Nikita Chordia
Members
-
Joined
-
Last visited
Everything posted by Nikita Chordia
-
It is interesting to know that even in the age of ecommerce, 80-90% sales happen in physical stores. Hence, many sellers are opting to sell product in a physical store as well as online platform. This is called Bricks-and-Clicks business model. By adopting this model, the sellers can increase their reach and enhance customer experience. This allows the customer to shop as per their preference. The customers who prefer physical shopping may visit the store. The customers who enjoy shopping from the convenience of their device may choose online platform. It is possible to gather data from both offline and online channels. The data can be used to understand customer behavior, preferences, and purchasing patterns. This can help sellers to gain insights that can inform decision-making processes, such as inventory management, pricing strategies, and marketing campaigns. Most companies in India that initially started as ecommerce business have now successfully launched their physical stores. This has significantly improved their revenue and market presence. Popular are brand like Mama Earth, Sugar cosmetics
-
To access the full capability of the model it is essential to understand the explanatory performance as well as predictive performance. In explanatory understanding of regression model we generally see difference between observed values and predicted values is considered. If the difference between the values is small, the model is a good fit. R-square is an indicator that shows goodness of fit. It indicates the percentage of variation explained by the model. If R-squared is 0%, it means none of the variation is explained by the model and 100% means all variation is explained. Hence, one may assume that high value of R-sq is good and low value is bad. However, that’s not always the case. If R-square values are low, it may be good to check if the predictors are statistically significant. If yes, you can still draw some conclusions from the model. Also, in some fields like psychology generally lower R-sq values are also acceptable based on the nature of the study. If the R-square value is high, it may not always be a good fit. In some cases, R-sq may be biased. Example- it could be because of using linear model to explain non-linear data. In some cases, R-square value may be high due to overfitting. Generally, if we add more variables to the model, the value of R-square will increase even if the variable is not significant. To solve this, we need to modify R-squared in a way that it is not affected number of variables. R-squared adjusted is that modified version which only increases if added variable improves the model. To assess the predictive performance, we need to systematically remove each observation from the data set, estimating the regression equation, and determining how well the model predicts the removed observation. Predictive R-squared indicates how well a regression model predicts responses for new observations.
-
In the improve phase, process benchmarking can help in identifying best practices by comparing the current process to the benchmark organization. This way the team can easily identify solutions and implement in their organization. This makes the improvement much faster as it reduces the time for experimentation and team can find lot of quick wins to improve their process. In some cases, team can also save cost of designing new solutions or prototype building as they can use the exiting design from the benchmark organization. In case of solutions needing investments, it is easier to get the data from benchmark organization to build business case/justification. Thus, process benchmarking can make the entire Improve phase more efficient and cost effective and team can target realistic solutions.
-
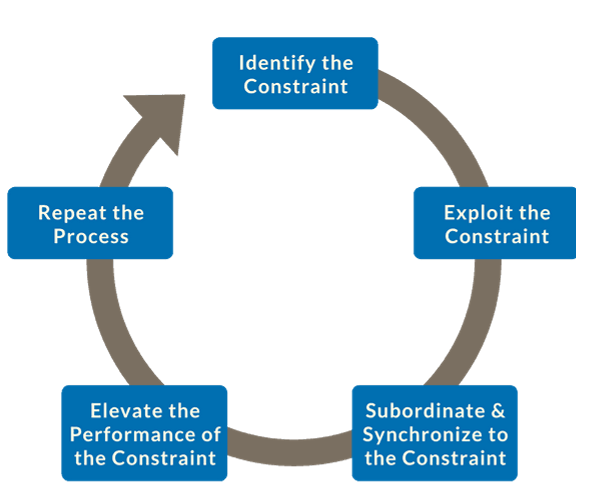
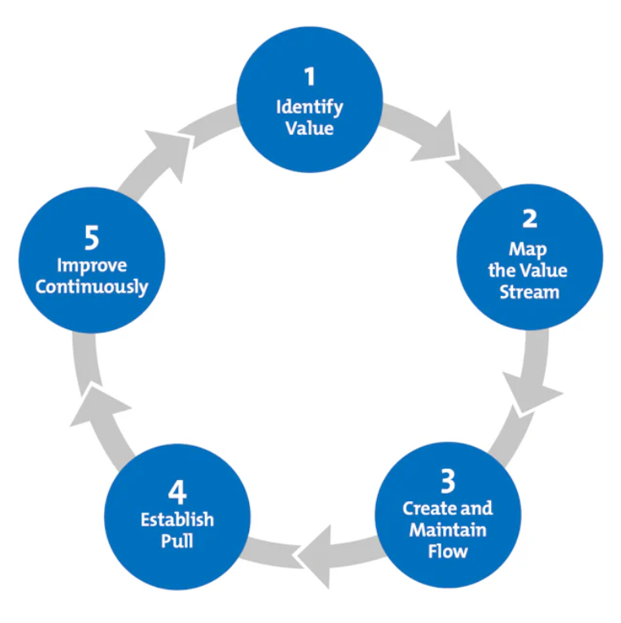
The Theory of Constraints is a method for identifying the limiting factor (i.e., constraint) that stands in the way of achieving a goal and then systematically improving that constraint until it is no longer the limiting factor. It focusses on improving the weakest link in the chain to improve the system’s performance. The Theory of Constraints working in the following steps: Step Objective Identify Identify the limiting factors that constrain the achievement of an organization's goals. Exploit Implement easy and quick improvements to the throughput of the constraint using existing resources Subordinate Other parts of the system are aligned and synchronized to support the constraint, ensuring that their activities do not overwhelm or impede the constraint's performance. Elevate If the constraint cannot be fully exploited with existing resources, efforts are made to enhance or remove it. This could involve investing in additional capacity, improving the efficiency of the constraint, or redesigning processes to eliminate the constraint altogether. Repeat Once the initial constraint is addressed, the process is repeated by identifying the next constraint in the system. Lean is focusses on maximizing customer value by minimizing waste in the systems. The core principle of lean is to reduce and eliminate non-value adding activities and increase customer value. Lean works in the following steps Step Objective Identify Value Determine what the customer values in terms of products, services, or outcomes. Value is defined from the customer's perspective. Map Value Stream Analyze and map the entire value stream, including all steps and processes involved in delivering the product or service from start to finish. Create Flow Eliminate interruptions, delays, and bottlenecks to establish a smooth and continuous flow of work, materials, and information through the value stream. Establish Pull Implement a pull-based system where work is initiated based on customer demand, ensuring that products or services are produced only when needed to minimize waste. Seek Perfection Continuously strive for perfection by identifying and eliminating waste, improving processes, and fostering a culture of continuous improvement throughout the organization. Establish Pull Implement a pull-based system where work is initiated based on customer demand, ensuring that products or services are produced only when needed to minimize waste. Seek Perfection Continuously strive for perfection by identifying and eliminating waste, improving processes, and fostering a culture of continuous improvement throughout the organization. Differences between TOC and Lean What? Theory of Constraints Lean Manufacturing Focus Identifying and alleviating constraints to improve throughput Eliminating waste, optimizing processes, and continuous improvement Core Philosophy Optimize the weakest link in the system Minimize waste, create value, and achieve continuous improvement Customer Focus While customer satisfaction is important, focuses primarily on maximizing the throughput of the system. Places a strong emphasis on delivering value to the customer by minimizing waste and optimizing processes. Application Often applied where there are clear constraints limiting overall system performance (e.g., manufacturing, supply chain). Widely applied across various industries beyond manufacturing (e.g., healthcare, services, software development). Example (Manufacturing) Identifying and optimizing a bottleneck machine in production Reducing setup times, improving flow, and minimizing inventory Example (Project Management) Identifying and managing critical paths in a project Using Critical Chain Project Management to streamline project execution
-
Goal means diagram visual representation that indicating relation between end goal and means/ steps required to achieve those. It requires working backward from the desired end goal to identify the steps or means necessary to achieve that goal. This approach is especially useful when breaking large/ complex goal into more manageable sub-goals. A Goal-means diagram typically consists of below key elements: End Goals At the top of the diagram, we have the primary goals or objectives. These are the desired outcomes that the project or process aims to achieve. Sub-Goals Beneath each main goal, there are sub-goals. Sub-goals represent intermediate objectives that contribute to achieving the overarching goal. These are steps or milestones toward fulfilling the main goals. These can be broken into further sub-sub goals. Actions/ Means Arrows or lines connect sub-goals to the means/actions. Means are the actions, strategies, or steps that need to be taken to reach the associated sub-goal. Each arrow signifies the relationship between a sub-goal Arrows/Links Arrows or links between elements represent the logical connections and dependencies. The diagram is organized hierarchically, with the main goals at the top, sub-goals in the middle, and means at the bottom. This hierarchy provides a structured representation of how different elements are related to each other. Goal means diagram is generally used in project scoping when trying to break large/ complex goals into more manageable pieces. Below are some of the key advantages over other project scoping tools: · Clarifying Strategic Alignment- It helps visualize the "why" behind each task, promoting a strong sense of purpose and direction. This ensure that project activities directly contribute to the overarching goals and helps the team to visualize their contribution in the overall big picture. · Prioritizing Activities- It helps visualize how different activities contribute to objectives, making it easier to prioritize those with the greatest impact. It also helps in allocating resources to the most impactful tasks for achieving project success. · Engaging Stakeholders- The visual nature of tool makes it easy to facilitate discussions with stakeholders with varying levels of technical expertise, fostering participation and buy-in. It also helps in communicating the project's scope and boundaries. · Validating Scope Assumptions: It helps identify areas where assumptions might differ amongst project stakeholders. This helps in preventing misunderstandings and scope creep later.

-
Criteria Risk Register FMEA Purpose Tracking and management of project risks. Analysis and prioritization of failure modes. Risk Scoring - Qualitative scoring often using scales like low, medium, high. Systematic scoring for Severity, Occurrence, and Detection. Prioritization - Based on qualitative risk scores. - May lack a standardized prioritization mechanism. - Based on Severity, Occurrence, and Detection (RPN) - Provides clear prioritization of failure modes. Advantages - Holistic view of all identified risks. - Inclusive of positive and negative risks. - Helps in project planning and management -Proactive risk identification. - Systematic analysis and prioritization of risks via RPN -It can serve as tool for process improvement Disadvantages - May lack depth of analysis for specific failure modes. - Subjectivity in risk scoring. - Can be time-consuming mainly for complex systems. - Subjectivity in assigning severity, occurrence, and detection scores. Use Cases - Project management in various industries. - Business risk analysis. - Manufacturing and engineering processes. - Product development.
-
Businesses are always striving for improving their products, services and performance. However, it is difficult to assess the current status without having a standard to compare. Through benchmarking, any business can compare itself against a standard/ best-in-class. There are different types of benchmarking for different purposes. Some types of benchmarking below: 1. Competitive benchmarking 2. Functional benchmarking 3. Strategic benchmarking 4. Product benchmarking 5. Performance benchmarking 6. Process benchmarking We will focus on Process Benchmarking and try to understand this further. Process Benchmarking- In process benchmarking, an identified business process is compared to similar business process to gain valuable insights that can help improve the identified process. The identified process can be compared to similar internal process, or with competitor or with similar process outside of the industry. Example: · Internal: Comparison of processes at different factories within the same organization. Factory A has process defect percentage of 87% against benchmark factory B having 95% process defects. By analyzing the process and data of factory B- factory A can compare its own process and identify areas of improvement. Factory A can implement best practices from Factory B. Factory A can also chose to replicate the entire process at Factory B. This way Factory A can avoid a lot of rework and increase efficiency. · Competitor: Comparison of competitor’s warranty claim processing process Competitor has claim resolution time of 2 days against 7 days in organization X. Hence, X has a gap of 5 days against benchmark. If X can get details of competitor’s process and identify differences in their own process, then X can improve significantly. This may also help them gain and retain more customers. · Similar process outside of the industry: Comparison of invoicing process of IT industry to manufacturing industry. It takes manufacturing organization XYZ- 7 days complete the customer invoicing process vs 1 day in IT organization ABC. Process benchmarking can help XYZ improve invoicing process time by 6 days. This can potentially help XYZ to get paid upto 6 days faster. Steps in Process benchmarking: · Define Objectives- Clearly define the objectives of benchmarking. Identify specific processes or areas you want to improve and set measurable goals. · Select Benchmark Partners- Choose benchmark partners that excel in the areas you aim to improve. · Collect Data- Gather relevant data on your processes and those of the benchmark partners. This may include process steps, timelines, costs, quality metrics, and other relevant performance indicators. · Analyse and Compare- Analyze the collected data to identify gaps and differences between your processes and those of the benchmark partners. Understand the reasons behind the superior performance of the benchmark partners. · Identify Solutions- Identify solutions for the identified gaps. These could be simply replication of best practices employed by the benchmark partners or may need detailed analysis and solution design. · Implement Changes- Develop an action plan based on the identified gaps and best practices. Implement changes in your processes. · Measure and Monitor- Establish performance metrics to monitor the impact of changes. Regularly measure and compare your updated processes against the benchmark to ensure ongoing improvement. How process benchmarking helps in project identification? Process benchmarking can help in project identification in following ways. 1. Identifying areas of improvement- Through process benchmarking, organizations can understand the current state and identify gaps in comparison to industry leaders. These identified gaps can become potential project opportunities to enhance processes and improve performance. 2. Measurement and Quantification of opportunities- The comparison with the standard helps in having clear measures and KPIs of current performance and gaps. This helps selecting appropriate metrics and in clear goal setting in the project identification stage. 3. Building project charter- The insights gained from benchmarking provide a solid foundation for business case during project identification. Leaders can assess the viability and potential success of projects based on proven practices observed in benchmarked organizations. Benchmark partner can provide significant information on time, resources, feasibility, risks of the project which would be crucial elements in project charter. 4. Prioritizing projects- Projects can be prioritized based on the impact on the overall organizational performance and alignment with strategic objectives. Benchmark partners can also provide insights on benefits, ease of implementation and effort required. These elements can help in prioritizing the identified projects. Other benefits of process benchmarking: 1. Learning from the leaders 2. Boosts innovation and creativity. 3. Increases employee engagement and sparks new ideas 4. Gain advantage from quick replication of best practices 5. Develop collaborative relationship with benchmark partner
-
Top-Down approach The top-down approach starts from higher levels usually top management and is then cascaded to various levels. In top-down approach the big picture goals or strategic direction is defined first and then broken into detailed actions. The entire planning is done at the top level. The goals and action plans are then communicated to the wider organization for implementation. The progress of actions and results are tracked by the top management and any adjustments to the plans, if needed are also decided by top management. As the management constantly communicates the goals and actions, there is more clarity in terms of expectations. This ensures that the actions are progressing in alignment to the strategic direction and benefits are realized as planned. Bottom- up approach The bottom-up approach starts with the ground level employees coming up with ideas, suggestions or actions. In the bottom-up approach, there is more clarity on the ground level details around individual process steps/ components which can then be linked together to the big picture objectives. The identification of opportunity and planning of the actions is generally done by the individual employee or group of employees. They may seek support from immediate managers in terms of refining the ideas or approvals. As the ideas are generated by the employees, there is natural motivation to take actions. Hence, there is limited need for management to follow up and track status. This approach also allows everyone to participate and fosters creativity. Top-down vs Bottom-up approach in Lean implementation When considering the implementation of any improvement methodology like Lean, the involvement of management and employees is very crucial to the success. Both Top-down and bottom-up approaches have certain advantages when it comes to lean implementation. Top-Down Approach Bottom-up Approach Alignment to business goals The top-down approach can provide more clarity and ensure that the actions are in alignment to the strategic goals The bottom-up approach may not have high degree of alignment to the goals especially if the goals are not well communicated/ understood. The ideas/ projects having higher business impact/ ROI are focussed by the management as they are exposed to high-level metrics Sometimes the ideas having no or limited business returns are selected just to boost the employee motivation There are measurable metrics that can be tracked and are clearly linked to the end goals Most of the improvements may not be measurable or have direct correlation to the business result. Flexibility The scope for change is limited as the actions are generally planned at the beginning and then communicated. Also, the employees may resist from sharing better ideas because they may be afraid to be perceived as challenging management decision. There is high degree of flexibility and there is a possibility to improve the solutions by discussing with mentors and peers. Employee motivation and mindset The employee motivation may be low as they are not able to contribute their ideas The employee morale is high and they are engaged to contribute ideas and implement them as well This approach is not very effective in development of problem-solving mindset or improvement culture as people expected to only act as instructed This approach helps in building the culture of improvement as everyone, everywhere is working on contributing to the improvement of their own areas There is limited creativity as only top-management is involved in generating ideas and making decisions This approach fosters creativity as anyone can come up with their own unique ideas and solutions. The degree of collaboration within the organization is limited. Generally inter-department discussions are facilitated by management. The teams and individuals are free to discuss and improve their ideas and can collaborate better with other teams. Resources and management support The resources may be more easily allocated and assigned as the actions are in alignment to the goals. There may be challenges in allocation of resources an may require multiple approvals. The management is engaged and their support is available which ensures that any challenges in implementation are tackled well. The management may not be involved in all the initiatives. The risks and challenges are generally taken care by line management The management also helps in mentoring and guiding the teams from time to time. This helps the teams to be on track Coaching and mentoring may be limited. So, the initiatives can go off-track. In case of Lean implementation both approaches need to be balanced. The direction, goals and mentoring must be top-down and must be communicated frequently. The bottom-up approach can be used for implementation details. Eg For Kaizen and projects, the bottom-up approach may work well if the area of improvement linked to higher goals. Top-down vs Bottom-up approach in Six-Sigma implementation Most of the aspects of implementation remain the same as Lean. However, one point of distinction is that six sigma focusses more on the financial outcomes. So, incase of Six sigma the output variables and project definitions can come from the top-down approach. However, brainstorming and implementation can follow bottom-up approach.
-
Ways of Working (WoW) Way of working is a framework for how the organizations/teams operate focusing on team collaboration and success. The guidelines enhance communication and teamwork; enables individuals, teams and leaders to set clear expectations and help the teams to develop and enhance the best ways to operate. Way of working and Phase of DMAIC In the Define phase, we get better understanding of current state of Ways of working. In Analyse phase we can identify aspects of Ways of Working that need improvement or identify the opportunities for improvement. In Improve and control phase of DMAIC as the new Ways of working can be tested, communicated and shared with others. It helps create a culture of continuous improvement in following ways: · Ways of Working helps the teams to improve collaboration · Helps team to be aligned in terms of goals and expectations · It also empowers the team to decide the best ways that they can operate. · It helps them to identify gaps in the current framework and gradually improve them. · It helps in sharing improvements with others
-
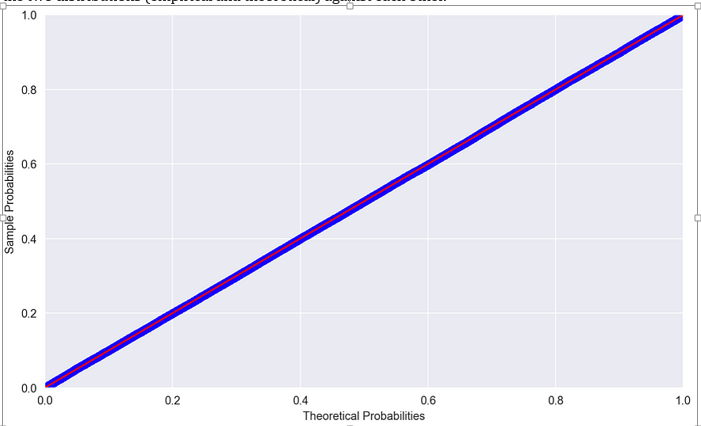
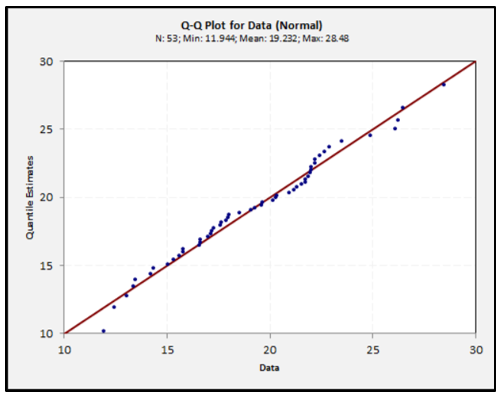
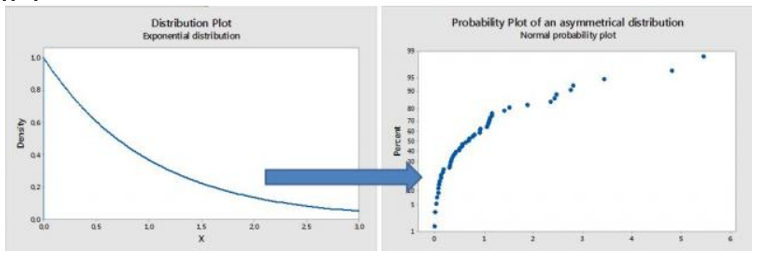
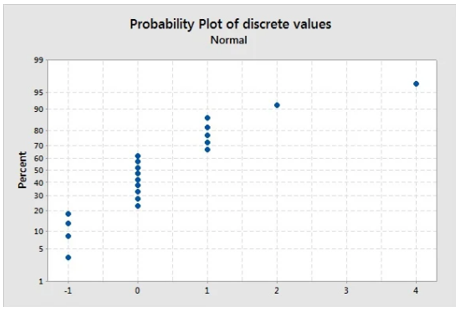
Probability plot A probability plot is a simple tool to visually compare data coming from different datasets and determine whether or not a data set follows a hypothesized distribution. Types of probability plots: 1. P-P plot The P-P (probability–probability) plot is a visualization that plots CDFs (cumulative distribution function) of the two distributions (empirical and theoretical) against each other. Figure 1: Example of a P-P plot comparing random numbers drawn from N(0, 1) to Standard Normal — perfect match 1. Q-Q plot The q-q (Quantile-to-Quantile) plot is used to compare the quantiles of two distributions (empirical and theoretical) against each other. Assessing the distribution of data: · If the data plotted against the theoretical distribution, results in a straight line, then the hypothesized distribution may be correct. · If the data results in a curve, then it indicates that an asymmetrical distribution (non-normal) would be more appropriate For such non-normal distribution, we need to transform the data into normal distribution or identify appropriate distribution before performing analysis like capability study, regression etc. · If the plot represents distinct groups of data, then the sample set is discrete data.