

Sanjay Bhure
Members
-
Joined
-
Last visited
Everything posted by Sanjay Bhure
-
Plackett Burman Design is an experimental design used in DoE to sort out or screen out the number of factors to minimize the number of experimental runs. In this design some critical factors to be identified from large number of factors available. In 2 level design, Full factorial design or Fractional Factorial Design is used, and it required large number of experimental runs. Which is not a cost effective and efficient way. Benefits of Plackett Burman Design: Plackett Burman Design is comparatively simple and easy to create and apply. It required only binary coding (-1 and +1) making it easy to implement. Plackett Burman Design can be used to efficient sorting of large number of factors. Plackett Burman Design is robust design against variability in the experiments. Plackett Burman Design identify the most significant factors and thus effectively identify the main effects of the factors. Limitations of Plackett Burman Design Plackett Burman Design cannot estimate interactions between factors in high resolution design. Plackett Burman Design uses binary coding (-1 and +1), which is not suitable for factors with more than 2 levels. Plackett Burman Design is useful in manufacturing in quality control process to identify significant factors that may affect the efficiency of equipment, defects in product etc. These factors may be product parameters, manufacturing process parameters, Equipment settings etc. Plackett Burman Design is useful in Food product manufacturing to identify significant factors like moisture content, feed rate, raw material composition, color composition, etc. Which may affect the texture, shelf life and taste of food product.
-
We generally use Cpk to identify the process capability of a process and in six sigma projects the Cpk should be greater than 1.33. If Cpk is there to define process capability than calculating Ppk is really important in the project?
-
A top down diagram is illustration of process flow. It shows main steps sequentially from left to right and relevant sub-steps below each step. The steps are broken down to the activity level and then written down as sub steps. It gives the overall picture of the process in one diagram and a quick understanding of the process. Therefore, the project team can quickly understand the opportunity to improvement and problem to solve. Typical application: To illustrate all necessary steps in a process or project. To provide an overall picture of a top-level process. Application in Problem-solving phase Select and define problem or opportunity Identify and analyze causes or potential change Develop and plan possible solutions or change Implement and evaluate solution or change Measure and report solution or change results Recognize and reward team efforts Typically used by Research/statistics Creativity/innovation Engineering Project management Manufacturing Marketing/sales Administration/documentation Servicing/support Customer/quality metrics Change management
-
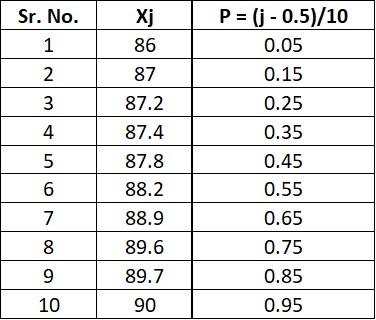
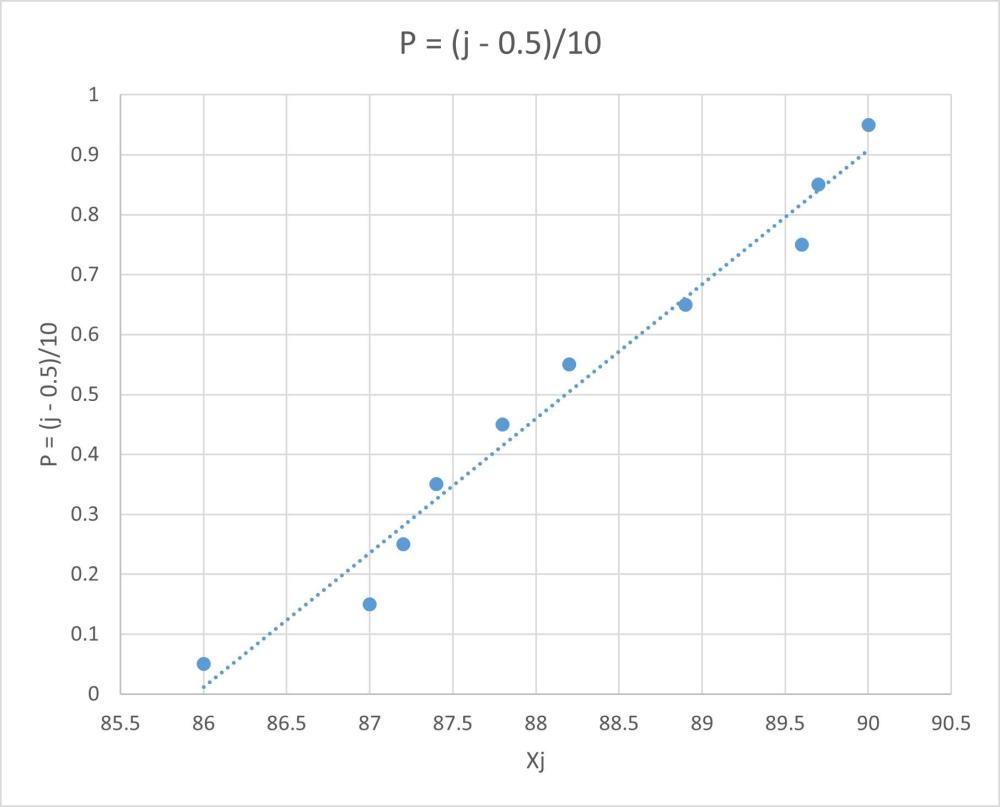
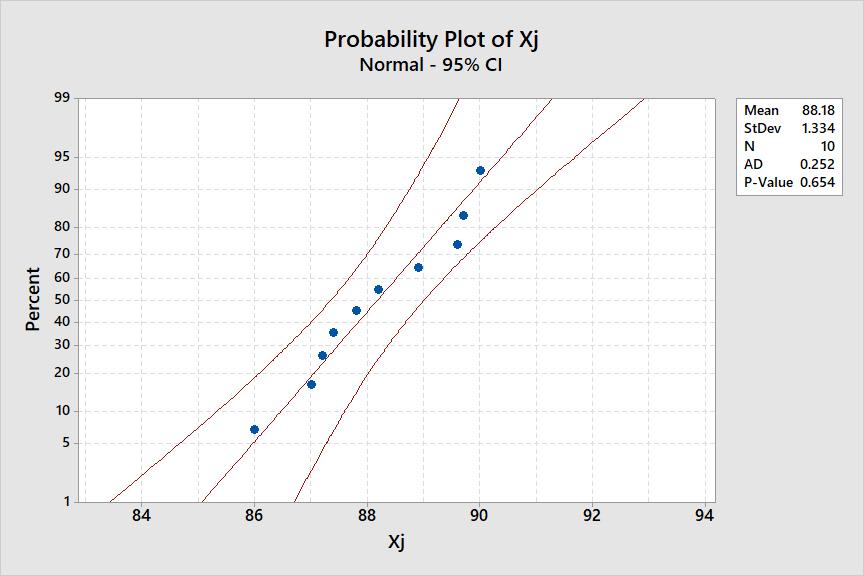
Probability Plot is a graphical method for determining weather sample data confirm to a given distribution based on a examination of the data. This given distribution is hypothesized distribution and the examination is subjective visual examination. The observations in the sample are first ranked in ascending order (i.e. smallest to largest). The plotted points shall fall approximately along the straight line. The determination of weather or not the data plot as a straight line is subjective. The graph is plotted between the observed data (in X axis) and cumulative % of probability (in Y axis). The probability is calculated using formula = (j-0.5)/n, i is the serial number of the observation and n is the total number of observations.
-
As each order is different with respect to items ordered, delivery location etc. We have two options 1. Create different Individual Moving Range (I-MR) control charts as per item ordered or delivery location. But then we will have too many charts to analyze. 2. Second option is to use one Z-MR (Standardized Individual Moving Range) control chart. In Z-MR (Standardized Individual Moving Range) control chart, we calculate the z value of each data and plot control chart using z value. The z value can be calculated using formula z = (x – xbar) / σ where x = individual data value; xbar = average of all data values; σ = standard deviation of data We also calculate Moving Range (MR) of each data and plot control chart using MR value. Z-MR Control chart is useful when every observed or measured data have different conditions which affect the data value.
-
Workload balancing is a technique to solve the bottleneck in any process. Theoretically, design the process and its tasks such a way that every task has same cycle time and there by remove the bottleneck and improve the value flow (Lean flow). The workload balancing in manufacturing is achieved by standardized work and single piece flow methods. standardized work has 3 critical components i.e. Cycle time, standard work and job sequence. The most critical factor in implementing standardized work is to consistently support and train the employees in handling equipment’s especially technological driven equipment that increases work process efficiency. Single Piece Flow (continuous flow manufacturing) is a method to manufacture parts in a celluer layout. The objective of Single piece flow is to manufacture one part at a time to remove unplanned interruptions and large waiting times. The workload balancing in service industry, means the equal distribution of work load among the employees. The objective is to reduce burnout and stress at workplace and improve productivity.
-
How to choose between Regression analysis and DOE? What are diffrent critical factors which contribute in the decision process of above and how?
-
Xbar S chart often used control chart to analyze the process mean and standarad deviation over time. This chart is used when the subgroup size is more than 10. The S chart provides a better understanding of the spread of data as compare to the range. X bar S Control Chart definitions X Bar: The mean varies in the process over time from subgroup values. The mean and standarda deviation is used to calculate the control limits. S Chart: This represents the standard deviation of the process over time from mean of subgroups value. This monitors the process standard deviation.
-
Overproduction is producing more then needed and fasted then needed. 1. Manufacturing the product to improve OEE. 2. Entering repetitive information or data on multiple documents. Overprocessing is the addition task or activity that adds no value to the process or product. 1. Providing more quality than the standard specification. extra polishing, over painting, extra wrapping while packaging. 2. Defining the various unnecessary terminologies in a report. Multiple approvals or signatures in a report. Overproduction can be reduced by doing proper and effective production planning. Overprocessing can be reduced or eliminated by clearly defining the work steps in SOP or Work Instructions or optimizing SOPs and Work Instructions.
-

