

Anupam Goswami
Members
-
Joined
-
Last visited
Everything posted by Anupam Goswami
-
Randomization Randomization has been extensively used in experimental design to ensure there are no selection bias and reduces potential for confounding factors (extraneous variable or factor that is not controlled for in the study and can influence the results of the experiment like age, gender, etc.). There are four types of randomization methods commonly used in statistics: Simple, Blocked, Stratified, and Adaptive. Simple Blocked Stratified Adaptive Participants are randomly assigned without any earlier determined criteria or blocking factors This ensures equal distribution of participants across test groups over time. Block size is generally a multiple of treatment groups. Then all possible combination of assignment to test group are found and blocks randomly assigned. Here participants are divided into groups based on specific factors that can influence the study before using simple randomization within group. As name suggests, participants are grouped based on results obtained so far in the study. Participants are assigned to groups with higher probability of success Especially used when sample size is large and there are no known confounding factors to influence the experiment This is used to balance distribution of participants. This ensures each group has similar distribution of participants with specific factors reducing risk of such factor affecting study result. Here the sample size is relatively small Objective is to optimize allocation of participants. Here generally the sample size is large, treatments have unequal effects and early data can inform probability of success of different treatments · It is very simple to use. · Guarantees equal probability of assigning any participant to a test group · Reduces selection bias · Improves probability of equal group sizes over time · Balanced study result even with small sample size · Ensures more even distribution of factors that could affect study result · Provides more accurate estimate of study impact · Increases efficiency of participant allocation · Provides more accurate estimate of study impact · Reduces number of participants reqd. · However this may result in unequal distribution of participants across groups · Not suitable for small sample size · However groups may be created that are not comparable for certain factors, introducing some bias · Increased complexity of use · However this requires research of factors that could affect study result · Increased complexity of use · However this requires frequent monitoring of study data to adapt · May increase risk of bias due to potential for data driven decision making · Can be complex and difficult to implement Examples like flipping coin, picking chits from a lot, using random number generator For example, for testing new drug for lowing BP blocked randomization ensures the new or and standard drug are assigned equal number of participants For example, for testing a new drug, this randomization will be used to ensure each group has same distribution of age, gender, disease severity For example, we have 2 different treatments for a disease. Here adaptive randomization will help allocate more participants to the treatment that appears more effective based on data collected so far
-
Cognitive Analytics Cognitive analytics is a type of data analysis that involves the use of advanced technologies, such as artificial intelligence and machine learning, to analyze data and identify patterns, insights, and anomalies that would be difficult or impossible to detect using traditional analytics approaches Difference between Cognitive and other traditional analytics approaches Cognitive Descriptive Predictive Prescriptive uses advanced algorithms and machine learning to analyze data in real-time, with the goal of identifying patterns and insights that are not immediately apparent. primary purpose of descriptive analytics is to summarize and describe historical data, providing insights into what has happened in the past primary purpose of predictive analytics is to make predictions about future events or trends based on historical data give detailed differences between cognitive analytics and predictive analytics uses more advanced statistical and machine learning techniques to identify patterns and relationships in data. Uses simple statistical analysis techniques to summarize data, such as measures of central tendency (mean, median, mode) and dispersion (variance, standard deviation). uses statistical and machine learning techniques to identify patterns and trends in data, with the goal of making predictions about future events. uses mathematical algorithms and optimization techniques to identify the best course of action, given specific constraints and objectives can also use structured data, but it is better suited for analyzing unstructured data, such as text, images, and social media posts. typically relies on structured data, such as data from relational databases or spreadsheets relies on structured data, such as data from databases or spreadsheets relies on structured data, such as data from databases or spreadsheets provides predictive insights, identifying trends and patterns that are likely to occur in the future provides descriptive insights into what has happened in the past, such as identifying trends and patterns in historical data generates predictions about future events based on historical data generates recommendations for action based on the results of predictive analytics uses machine learning and artificial intelligence to provide automated interpretation and insights, making it faster and more accurate than descriptive analytics. relies on human interpretation to understand the insights generated from the analysis relies on human interpretation to understand the predictions generated from the analysis. generates recommendations for action based on the results of predictive analytics Used in banking industry to monitor transaction patterns, identify unusual activities, and flag them as potentially fraudulent used to identify historical patterns of fraudulent activities in order to develop risk mitigation strategies for the future can be used to analyze stock market data and identify stocks that are likely to increase in value in the future. can be used to detect fraud in real-time and provide recommendations for specific actions to be taken, such as flagging suspicious transactions for further investigation In the e-commerce industry, cognitive analytics can be used to analyze customer interactions with a website to identify patterns, such as what products are frequently purchased together or what type of content is more appealing to the customers can be used to identify trends in customer behaviors and preferences. can be used to identify customers who are likely to churn, allowing marketing teams to develop targeted retention strategies prescriptive analytics can be used to identify the most effective marketing channels and messaging based on customer data. can be used to identify trends in customer behaviors and preferences. descriptive analytics can be used to analyze the prevalence of certain diseases in a population or identify risk factors associated with certain conditions Can be used to forecast future health risks or outcomes based on historical data. For example, predictive analytics can be used to identify patients who are at high risk of developing a particular condition, allowing healthcare providers to develop targeted interventions can be used to identify the most effective treatments for a particular condition based on a patient's medical history and other relevant data.
-
Predictive Maintenance Predictive maintenance is a type of maintenance strategy that uses data and analytics to predict when a piece of equipment is likely to fail. The goal of predictive maintenance is to identify potential failures before they occur, so that maintenance can be performed proactively to minimize downtime and reduce the risk of unexpected equipment failures. Predictive maintenance is different from corrective maintenance in that corrective maintenance is performed after a problem has occurred, while predictive maintenance is performed before the problem occurs. Preventive maintenance, on the other hand, is performed at regularly scheduled intervals regardless of whether a problem has occurred or not. Corrective Maintenance Preventive Maintenance Predictive Maintenance Done after the failure or incident – Reactive Done prior to avoid failure or incident - proactive Done to forecast potential issues so that they can be avoided - proactive Does not involve any planning, cost effective in short term Lot more complex planning. Scheduled basis system run time. Expensive to begin with Scheduled basis need using real time condition of system. Relative more complex to implement. Can be very expensive to begin with depending on sensors or tools reqd. Process is simple as its done only when needed. At other times the maintenance team can focus on other activities Labour intensive and maintenance team always has some assets to work on. Maintenance carried out whether reqd. or not Performed only as needed so more efficient Very expensive on long term as the failure or incident would cause damage to system. Asset lifecycle is reduced Expensive but avoids damage to system. Asset life cycle is improved Over long term the maintenance cost will be minimum. More efficient in utilizing asset life before replacing Has risk of injury for employees Better for safety of employees Better for safety of employees Downtime of assets and therefore impact on productivity is high Downtime of assets is low Downtime of assets is minimum Since it only focuses on issue and not the cause, chances of repeat failure are high Chances of failure is low Chances of failure is very low Can be suitable when cost of part is significantly cheaper than cost of predictive or preventive maintenance Suitable when cost of failure or breakdown or repair is very high Benefit of preventive maintenance but more efficient and cost effective There are several tools used for predictive maintenance, including: · Vibration analysis: This involves measuring the vibration of machinery to identify issues such as misalignment, imbalance, or bearing wear. · Thermography: This involves using infrared cameras to detect changes in temperature that can indicate potential problems with electrical equipment, mechanical equipment, or other components. · Oil analysis: This involves analyzing the oil used in machinery to identify contaminants and wear metals that can indicate potential problems with the machinery. · Machine learning algorithms: This involves using data from various sensors and sources to build predictive models that can help predict equipment failures. · Condition monitoring software: This software collects and analyzes data from various sensors and sources to provide real-time information on the health of equipment, which can be used to identify potential problems before they occur. · Ultrasonic testing: This involves using high-frequency sound waves to identify potential problems with equipment such as cracks or corrosion. · Electrical signature analysis: This involves analyzing the electrical signals produced by machinery to identify potential problems with the equipment's electrical components. · Wear debris analysis: This involves analyzing particles generated by the wear of machinery to identify potential problems with the equipment's components. These are some of the most commonly used tools for predictive maintenance, but there are many other tools and techniques that can be used depending on the specific needs of the equipment and the organization.
-
Metcalfe's Law Metcalfe’s law states that the effect of a telecommunication network is proportional to the square of number of devices connected. Simply put, a network’s value increases exponentially with size. This is generally a good thing for digital networks. But Metcalfe's law does not necessarily apply to organizations or project teams. Imagine a team of 3 members. It will therefore have 3 lines of communications. But with addition of only 1 member, the lines of communications doubles to 6. Another 2 members, and the lines of communication increases to a complex network of 15. Similarly, 45 lines of communication for a team of 10 members, something our brain may not be able to manage! In a team scenario there are natural limits to the number of people we can communicate and perform with effectively. Social scientists like Robin Dunbar have said that our social world is small scale – 5 people we can have close relationship with, 15 we can have less intense relationship with. Just like in any sports team. With smaller teams, we are now looking at self-managed culture with no or fewer middle managers. These teams are highly autonomous and motivated, taking care of their communications which significantly increases collaboration and their agility to respond to change. Such teams can operate with greater speed and efficiency, allowing for quicker iteration and faster delivery of value. However, on the other hand, larger teams can bring a diversity of skills and perspectives that can lead to more innovative solutions. Ultimately, the optimal team size depends on the specific requirements of the project and the organization.
-
Shainin Red X Methodology is a statistical problem-solving approach used in industrial settings to quickly identify the root cause of complex and multifaceted issues. It is based on the idea that a small number of critical inputs (often referred to as the dominant "X's" based on pareto principle) are responsible for most of the variation in a system. The methodology involves a systematic process of testing, eliminating, and validating these inputs until the root cause of the issue is found. Compared to Six Sigma, Shainin Red X Methodology is considered to be a more efficient and quicker approach to problem-solving, particularly when dealing with complex, multivariate issues. Six Sigma, on the other hand, is a more comprehensive process improvement methodology that involves extensive data analysis, statistical process control, and a structured DMAIC (Define, Measure, Analyze, Improve, Control) process. Pros of Shainin Red X Methodology: · Quicker problem resolution time · Focuses on critical inputs for efficient problem-solving · Can be applied to a wide range of industrial settings · Can be used by individuals with limited statistical knowledge Cons of Shainin Red X Methodology: · May not be as comprehensive as other problem-solving approaches such as Six Sigma · May not be suitable for all types of problems, particularly those that are not complex or multivariate in nature · Can be less data-driven compared to other methodologies, relying more on intuition and experience of the problem-solver. Pros of Six Sigma: · Comprehensive approach to problem-solving and process improvement · Utilizes statistical tools and methodology to identify and eliminate causes of defects · Can be applied to a wide range of industries and processes Cons of Six Sigma: · Can be time-consuming and resource-intensive to implement · May not be as quick as Shainin Red X Methodology in solving specific problems. In summary, Shainin Red X Methodology is a fast and effective approach to solving complex problems, but it may not be as comprehensive as other methodologies like Six Sigma. The choice of methodology depends on the type and complexity of the problem, as well as the resources available.
-
Fleiss' Kappa Cohen's Kappa This is a way to measure agreement between 3 or more raters. Used for nominal data (e.g. likert scale). Therefore this measures agreement between 3 or more dependent categorical samples Similar to Fleiss’s Kappa This is a way to measure inter rater reliability but for below scenarios: - 2 raters rate same trial once each or - 1 rater rates 2 trials (measures agreement of new method with old or over time), Can be used for any number of raters Can be used for only 2 raters Allows for scenario where each rater is rating different items also Only works for scenario where raters are rating identical items Assumption includes that raters are chosen independently from larger set Assumption includes that raters are chosen deliberately and are fixed Scenarios for use: 5 raters randomly picked from a pool asked to give pass/fail by picking samples randomly from pool (e.g. destructive tests) Scenarios for use: 2 raters asked to give pass/fail for 20 interview candidates Have 2 machines for measuring pass/fail of an item’s attribute Condition of random sampling among raters means this is not suitable if all raters are reqd to rate all samples Conversely not suitable if all samples cant be rated because of cost of test or if its destructive in nature
-
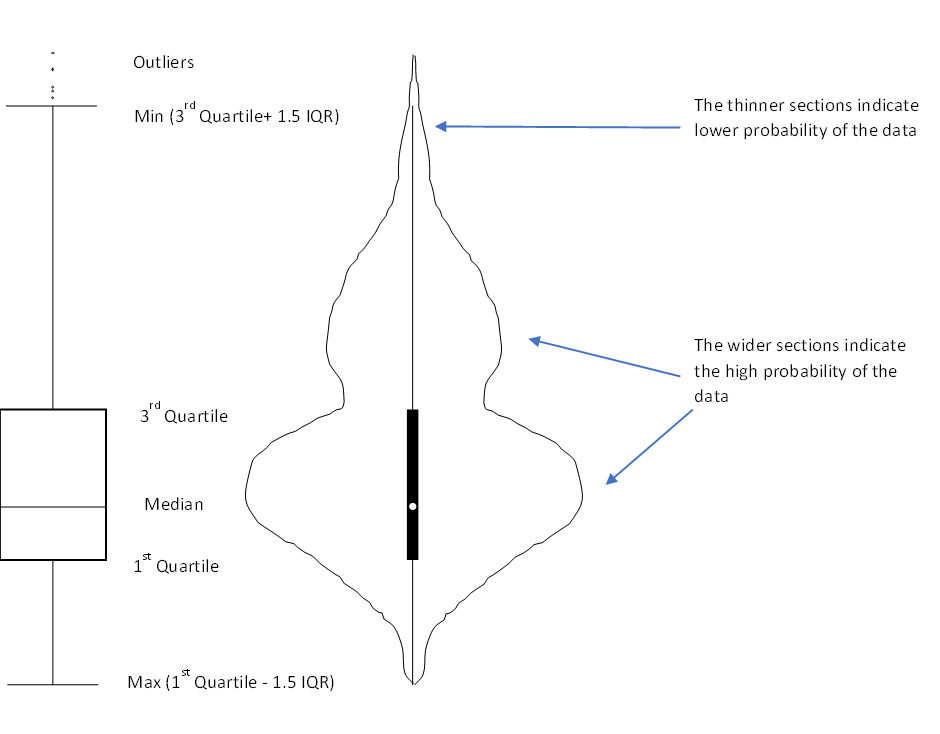
Violin Plot This is a way of plotting numerical data which is a combination of box plot and kernel density plot. Like a box plot, this too shows the median (indicated by a white dot), the interquartile range (indicated by the broad black bar running along the plot), the minimum/ maximum (indicated by the thin black line running along the plot) and the outliers. However, on top of the above summary statistics, the violin plot also shows the data distribution which is especially preferred if the data has multiple modes (reference to the shape of violin). This allows us to see the distribution of the data and especially useful if we want to compare multiple groups. In the above diagram, the violin plot has 2 wide sections showing that majority data points are grouped around that value. So for example if we want to study the grades obtained by students where there are generally multiple groups or modes (say Grades A and C), the violin plot is better to visualize and compare the data. Another example is if we want to compare heights of people across countries, then again, the violin plot is better. For plot of each country, we would typically observe 2 peaks (for males and females)
-
5S Red Tag This is used in the “Sort” phase of 5S, a continuous improvement methodology originating from Japan. While going through items, it helps classify something as not necessary or needed basis below criteria: · Does this item really have use in that area · Is it being effectively used · Frequency of use and by which members/ team · If removed, what is the impact · Does it get in the way of other activities 5S Red Tag can result in continuous improvement for the teams. Its an effective visual management tool which helps changing behaviour of simply dumping items in a corner, creating “waste”. Such items could also be unsafe, defective, extra, obsolete or unused items. In fact, this is a recurring activity to remove waste, just like we clean our house and dispose of items of no value to create space for more valuable items. It would help reduce inventory, improve utilization of space, reduce retrieval time, improve productivity or even monetary benefit from selling off. Such items once tagged (and where possible placed in a “local red tag area” for a period) tells everyone that this is intended to be moved out. This results in a discussion on the item, thereby removing personal bias in identify value in an item. Finally, it gets moved to a “central holding area” if collectively found as waste for that team. Objective is to find another place or team which could find use for this item before it is disposed of. The tag contains details including · Item type / classification along with description and quantity · When it is to be moved out of local red tag area or was moved to central holding area and by whom · Reason for Red Tagging · Area from where it was moved · Duration for which it is being held (generally a month or till when its decided that the item can add value to the business) · Suggested action (dispose, store, reduce inventory, sell/ transfer, etc) These details are also updated in the 5S Red Tag Register to avoiding reliance on someone’s memory or a need to redo the activity. For success, a POC or owner should be designated for the holding area with responsibility of: · Continuously monitoring the area · Reviewing value add for the item · Ensure maintenance of 5S Red Tag Register including status of the item · Review the typical duration an item can be put in holding area · Dispose/ recycle or sell off based on set duration, to avoid accumulation If any team picks out the item with the Red Tag from the local red tag area or the central holding area, then they would need to find a permanent area for that item. Thus the Red Tag can be taken off when either the appropriate area or use for the item is found or it is disposed off/ recycled/ sold.
-
Abilene Paradox It states that a group or organization frequently take decisions or actions which is opposite to what most or all of the group wanted to. It indicates a breakdown in how a group communicates - with the individuals incorrectly believing that their own choices or preference are contradictory to those of the group (therefore the fear or appearing as “not a team player”) and doesn’t even share them. This is likely caused by human’s instinctive nature to conform to the group, gap of ownership mindset or perceiving an expert/ heavyweight in the group on the topic or even adequate time to debate. Individuals as a result are afraid of speaking up, resulting in collectively the group remaining silent on the issue. For example, after multiple election defeats members of a political party committee meet to select a new president replacing the existing incumbent. Meeting starts with a coterie of close senior leaders extending supporting for the incumbent to continue while covering up the issue. A senior leader who viewed himself as a contender but didn’t want to come out as too eager, extended his support for status quo. Other individual members who too had discussed privately the need for change but didn’t want to appear to present conflict or lack of public support with the party’s ageing leadership, didn’t raise any objections to the incumbent continuing or even share their actual views about need for change in leadership. Some deferred to the senior party leader earlier expressing support with the incumbent. Even the incumbent who didn’t want to appear to run from responsibility while privately of the opinion for fresh blood, didn’t voice out opposition to his continuing as party president in the meeting. Thus, the group while individually desiring of a change in leadership and backed by data of poor decisions made by the incumbent, collectively decided for status quo. This caused further increase in frustration within the members, with each blaming other members or the party leaders and obviously more electoral defeats. In effect, the issue for which resolution was being attempted got compounded due to the hampered decision making ability, with blame game running rife among the members. As on any path for resolution, the first step is to identify existence of the problem. Symptoms include: · Individuals sharing differing view points or opinions while in private as against when in a group · Culture of discouraging members presenting different view points or opinions or taking risks or shooting the messenger · Presence of frustration among members towards other groups or leadership. · Lack of trust among members of the group resulting in backstabbing. · Decision making requiring unanimous committee agreement. Now the step towards avoiding this paradox are: · Leadership acknowledge the issue clearly asking for frank opinions without fear · Encourage everyone to share their feedback even if different or voice out concerns before decision is taken. Reward the devil’s advocate even if he gets proven wrong. · Further before collectively discussing, encourage individuals or smaller teams to brainstorm independently and present options. This would ensure that heavyweights don’t swing the discussion first. · Encourage members to listen without passing judgment, enforce culture of brainstorming. · Finally avoid being hasty while making key decisions without considering alternatives and studying the impact
-
Difference between control and specification limit is as follows: Control Limits defined via UCL and LCL Specification Limits defined via USL and LSL Derived from process (calculated from past measurements) – Voice of process Calculated typically as +- 3sigma from mean Received from customer/ market – Voice of customer. It shows the expected performance Factor in calculating process stability Factor in calculating process capability Appears in control charts and understand variations the process is liable to produce Appears in histograms, box plots and probability plot and helps understand acceptable deviation from the performance target Helps understand process variation Helps understand gaps / defects in process performance vs. expected performance Process control limits can be shifted or changed over time Not much influence to change specification limits For sub groups For item or individual measurements Helps identify and reduce producer’s rejects Helps identify and reduce customer’s rejects If a process is called out as in statistical control, then any variation in the process performance would be attributed to common causes only. This process would be consistent over time. If any process performance is noted beyond the control limits, it would be attributed to special causes and predicting performance for such a process would be difficult. Therefore control limits indicates that majority of the variation (+- 3 standard deviations from the process performance mean) in the process is within these limits and only a small portion of the variation is outside which would be attributable to special causes. Whereas the individual process performance measurements that fall out of customer provided specification limits would be said to not meeting the customer’s expectations. While measuring process capability, we generally use Cp, and Cpk when process is called out as in statistical control. We would use Pp and PPk to measure process performance , generally when process is too new to determine if its in statistical control. Interaction between the control and specification limits: a. if control limits fall within the specification limits This is a good scenario as all variations due to common causes will still meet customer expectation. Process therefore has higher capability to meet customer expectations. Also, in future if the control limits change, process capability may not be as severely affected b. if specification limits fall within the control limits: This indicates that there are some measurements or process performances which are not meeting customer expectations even though they may have been caused by common causes or in other words there are larger number of defects. c. if control and specification limits coincide: While all variations caused due to common causes will meet customer expectations, any variations caused by special causes will not meet customer expectations. d. No overlap between control and specification limits: This then indicates that entire process performance or all the measurements are not meeting customer expectations