Balaji Loganathan
Members
-
Joined
-
Last visited
-
Balaji Loganathan replied to Vishwadeep Khatri's topic in We ask and you answer! The best answer wins!In the RPA platform where most of the time a robot executes at virtual machines, specifically in the case of the unattended robot where a user doesn’t have visibility of the processing part. RPA is rule or logic-based, It works like a human being (can automate specific tasks, replicate manual work keystroke by keystroke, calculating, data entry, automatic form fill, repetitive process, etc) RPA can be integrated into existing businesses for higher productivity This reduces costs and eradicates errors that are common in back-office practices like data entry or invoice processing. In such situations, it becomes very significant to deal with the exceptions in the robot. RPA Exception Handling With the exception mechanism, we can write codes considerably “cleaner” and then have everything “automatically handled” and user-friendly. Below are the four exception-handling mechanisms · Continue · Ignore · Retry · Abort Continue - The Exception is rethrown Ignore - Execution can continue from the next step after ignoring the exception Retry - Activity with the exception is retried (# of attempts can be counted) Abort - The Execution is aborted When an exception is thrown, it should offer paths to take for further processing. This makes it much easier to handle exceptions meaningfully even when you don't know the exact context of their creation. This forces the programmers to code exception handling very close to the decision-making hard-coded into the operation. The most common errors in RPA can be classified into business exceptions or application exceptions. When a software BOT is unable to process a transaction with programmed commands, In other words, the business exception is written into the automation’s exception code. Example - 1 A robot processing invoices in a manufacturing firm may be programmed to process invoices up to $5,000. When it comes across an invoice valued at $8,000, the bot identifies it & is unable to process it, and throws a business exception alert. Example -2 if an RPA bot involved in onboarding new associates comes across an incomplete form that is missing the new associate’s PAN number, the bot will identify it must have this field to continue with the flow and throw a business exception. In both cases, the robot records the exception and moves on to the next transaction. An application exception happens when a robot encounters a technical issue, such as a server/System crash, or a change to the technology environment that requires interaction with a new application or website. For example - A robot that must click a log-in button on a web application stops when the webpage does not completely load; sometimes these errors are incidental and can be fixed by repeating a few scopes of the process.
-
Balaji Loganathan replied to Vishwadeep Khatri's topic in We ask and you answer! The best answer wins!Inventor of the Harada Method - Takashi Harada Takashi Harada, a Japanese high school teacher, created what is globally known as the Harada method, which provides a process for hitozukuri. The Harada method majorly concentrates on the human aspect of Lean and supports employees to be successful by identifying their goal or task that helps them move forward. This method aligns with Lean Six Sigma and other methodologies that drive continuous improvement. About the Harada Method Mr. Harada recognized that the principles used in sports shall also bring success to companies. This method revolves around the human side of Lean and helps people to achieve success by recognizing and adopting a task that helps them move forward. The Harada method defines an individual through five stages 1. Premeditation 2. Personal excellence 3. Goal setting 4. Selfless service 5. Self-reliance. In this approach, you will define a strong goal and then break the goal into discrete components. These components are put together in the table form called the Open Window 64 or OW64. The final goal is surrounded by eight essential keys for completing the ultimate goal. Then, these eight keys are subdivided into eight areas of focus for personal development. The Harada Method: To Reduce - 8th Waste One of the ways organizations help make the most of their value is by using Lean techniques and getting rid of waste. As we all know, there are eight types of waste that can improve profitability and create more value for the business. They are: 1) Transport, 2) Inventory, 3) Motion, 4) Waiting, 5) Over-production, 6) Over-processing, 7) Defects, 8) Skills/talent: (Underutilized skills, knowledge, and talent of people, inadequate training for delegated tasks) The first seven wastes are majorly from the manufacturing process. There are tools and methodologies like Kaizen, Six Sigma, 5S, and more that help eliminates or reduce such waste. The eighth waste deals with the people involved in the process; better utilizing and handling employees will reduce waste. The bottom line of this method is to become self-reliant; it is the self-confidence that will help them use their skills not only for their own development but for that of the organization.
-
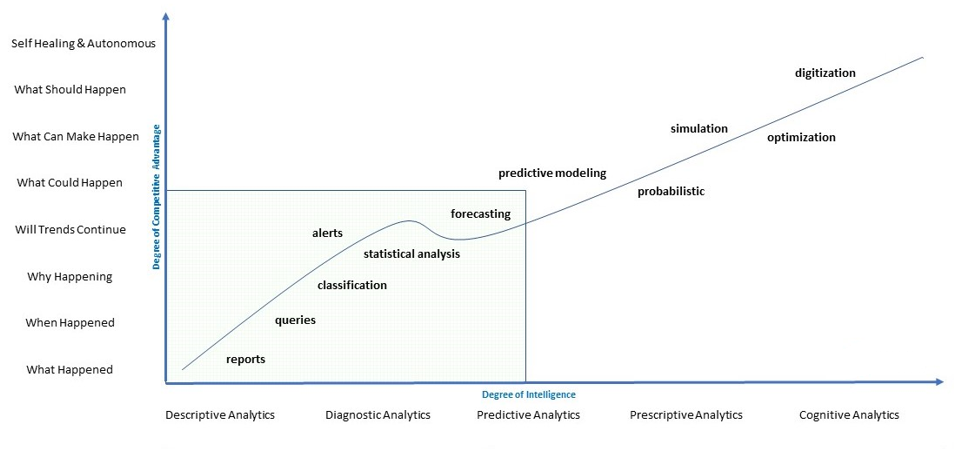
Balaji Loganathan replied to Vishwadeep Khatri's topic in We ask and you answer! The best answer wins!Cognitive Analytics is an intelligent technology that covers many analytical techniques to analyze large data sets and give structure to unstructured data. To put it simply, cognitive analytics searches through the data that exists in its knowledge base to find solutions that make sense for the questions when asked. This can include understanding the context and meaning of a sentence or recognizing certain objects in an image set with large amounts of information. Cognitive analytics frequently uses artificial intelligence algorithms and machine learning, allowing a cognitive application to improve over time. We know that both Prescriptive Analytics and Predictive Analytics are 10 years-old technology. Thanks to these technologies, today we see many intelligent technologies attain a strong grip. A deep understanding of information helps companies draw from the wide variety of information sources in their knowledge base to improve the quality of enterprise knowledge, and competitive positioning and deliver a deep and custom-made method to customer service. Real-Life Applications of Cognitive Analytics The medical industry is nowadays started to use cognitive analytics to match its patients with the best possible treatments. Some day-to-day examples of cognitive analytics which are in use today such as Apple’s Siri What are the benefits of having cognitive analytics? Depending on the stage of the workflow and the prerequisite of data analysis, there are five main kinds of analytics – descriptive, diagnostic, predictive, prescriptive, and cognitive. These 5 types of analytics are typically implemented in stages and nothing is said to be better than others. They are supporting, and in some cases additive i.e., you cannot employ the more cultured analytics without using the more necessary analytics first. Descriptive Analytics This is the most naive stage of analytics and for this purpose most organizations today use some type of descriptive analytics. The easiest way to describe it is the process of gathering and interpreting data to define what has occurred Ex - Most reports that a business generates are descriptive and attempt to summarize historic data or try to explain why one event in the past differed from another. Diagnostic Analytics At this point, you shall start to answer some of those “why” questions. Historical data can be compared against other data to answer the question of why something happened in the past. This is the process of collecting and interpreting diverse data sets to identify variances, detect patterns, and define relationships. Ex - Approaches that use diagnostic analytics include alerts, drill-down, data discovery, data mining, and correlations. Predictive Analytics Predictive analytics largely is a type of business intelligence that uses descriptive and predictive variables from the past to analyze and categorize the likelihood of an unknown future result. It brings together a number of data mining methodologies, forecasting methods, predictive models, and analytical techniques to analyze current data, assess risk and opportunities, capture relationships, and make predictions about the future. Prescriptive Analytics Prescriptive analytics is the next step in the evolution of analytics where we take: · The data we gathered in the descriptive stage that stated to us what happened, · Merge it with the diagnostic analytics that will tell us why it happened, · Combine those with the predictive analytics that will tell us when it may occur again. Cognitive Analytics Cognitive analytics brings together a number of intelligent technologies to achieve this, which includes semantics, artificial intelligence algorithms, and a number of learning techniques such as “deep learning” and “machine learning”. Applying such methods, a cognitive application can get smarter & become more effective over time by learning from its interactions with data and with humans. An organization can use cognitive analytics to observe its customer behavior patterns and evolving trends. By this, an organization can predict future outcomes and plan its objectives accordingly to improve its performance.
-
Balaji Loganathan replied to Vishwadeep Khatri's topic in We ask and you answer! The best answer wins!First In, Still Here FISH is simply a reference to the physical presence of old, unsold items in inventory. A large amount of FISH inventory also shows that there is an extreme working capital investment in inventory. For example, Items such as seasonal items and luxury items may qualify as FISH because they may be out of season before they have sold out completely or because they are not considered necessary by the average consumer. In what way, we can say if inventory is considered FISH? The earliest inventory items purchased are the last inventory items sold, therefore FISH may be referred to as first-in, still here, or FISH. Therefore, the last inventory items procured are assumed to be the first inventory items to be sold. Can data analytics be used to detect and eliminate FISH inventory? Yes. Data science can be used to detect FISH first by classifying the characteristics of slow-moving inventory, then using machine learning algorithms to automatically detect which items are FISH. With this information, one can make decisions on how best to manage inventory or incur unnecessary costs. 3 Key Benefits of First In, Still Here (FISH) 1. Re-evaluating your inventory management system. Achieving this one can tell if there is a way to reduce the amount of time it takes for products to move through your warehouse and into customers’ hands. 2. Try implementing a new FIFO (first in first out) policy or FISH (last in first out) policy. This can allow you to reduce the overall age of your inventory at any given time. 3. Think about Ways you can optimize your supply chain. For example, work with many suppliers instead of just one or two so that your product flow isn’t dependent on any one supplier going down or having problems with their delivery schedule. 3 Challenges - First in Still Here (FISH) 1. There is an excess amount of inventory on hand that may not sell before it goes out of date. This is regularly the case with products that have long shelf lives and/or low demand. The longer the product sits on your shelf, the less likely you are going to sell it at an Actual price. 2. FISH indicates poor materials management within the business. This means you over-ordered materials and/or made mistakes in procuring decisions which led to having more than you need for existing production. 3. FISH indicates sales are lower than expected—or that they will be. This also means sales could be lesser than predicted in the future. Businesses, therefore, want to reduce their current stock in order to avoid writing off obsolete products later.
-
Balaji Loganathan replied to Vishwadeep Khatri's topic in We ask and you answer! The best answer wins!Predictive maintenance (PdM) / Condition-based maintenance (CBM) While Preventative and corrective maintenance emphasizes on Age of the asset and frequently scheduled maintenance, the constraint is a focus on only repairing assets at the last stage of degradation. Predictive maintenance lets you monitor equipment health to avoid upcoming failures during the process. It uses predictive algorithms with data from equipment sensors to evaluate when the equipment will fail. It also identifies the root cause of problems in your difficult machinery and helps you identify which portions need to be repaired or replaced. This way, you can reduce downtime and make the best use of the equipment’s lifetime. Predictive maintenance software uses data science and predictive analytics to estimate when a portion of equipment might fail so that corrective maintenance can be planned before the point of failure. The goal is to schedule maintenance at the most appropriate and most cost-efficient moment, letting the equipment’s lifespan be improved to its fullest, but before the equipment has been compromised. The predictive maintenance solutions typically consist of data procurement and storage, data transformation, condition monitoring, asset health evaluation, prognostics, a decision support system, and a human interface layer. Difference between Preventive vs Predictive Maintenance The difference between preventive maintenance and predictive maintenance lies in the data being analyzed. While a predictive maintenance specialist relies on monitoring and analyzing data from the actual, current condition of the equipment in operation, preventive maintenance relies on historical data, averages, and life expectancy statistics to predict when maintenance actions will be required. Corrective maintenance refers to the actual repair or replacement of equipment that has failed, broken, or worn down. Preventive, predictive, and corrective maintenance is particularly critical for safe operations in the Oil and Gas, Manufacturing, Telecommunications, and Railway industries. How to Implement Predictive Maintenance? Manufacturers are increasingly using the Internet of Things (IoT) predictive maintenance and AI predictive maintenance services to implement automatic predictive maintenance in their operations and equipment. AI in predictive maintenance can tailor maintenance routines to the requirements of each individual piece of equipment and can be trained to visually identify flaws and patterns in equipment. Why Predictive Maintenance is Important? Predictive maintenance insights are an exceptionally valuable asset in refining the overall maintenance and reliability of an operation. Benefits include: • minimalize the number of sudden breakdowns • Utilize asset uptime and improve asset reliability • reduce operating costs by carrying out maintenance only when needed • maximize production hours • Improve safety • Streamline maintenance costs by reducing equipment, inventory costs, and labor. Top 5 Predictive Maintenance Software • Limble CMMS. • Fracttal One. • Fiix. • SAP Predictive Asset Insights. • Brightly Asset Essentials.
-
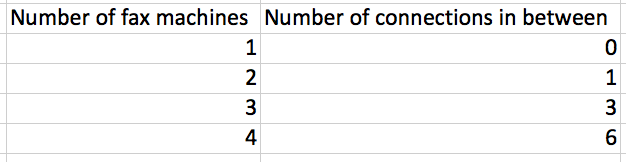
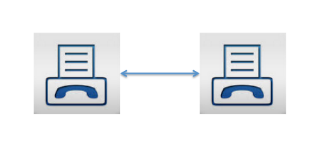
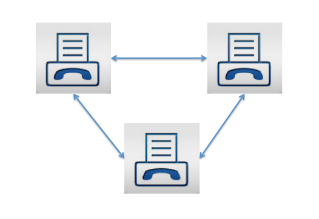
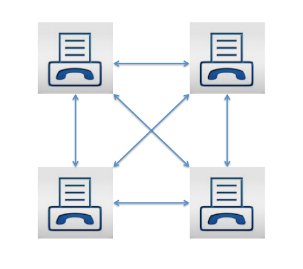
Balaji Loganathan replied to Vishwadeep Khatri's topic in We ask and you answer! The best answer wins!A simple explanation of the “law” of network effects Metcalfe's law illustrates the important difference between an individual's value of a network and the value of the network as a whole. The basic description of Metcalfe’s law is that as networks grow bigger, they grow in value much bigger and faster than the user base. Let’s see by using some simple math. Here are a few simple assumptions to simplify the model: · Let’s Think about this example as a communications network common example (e.g. fax machines) · The cost of the network is simply measured by the number of connections you can make · The cost of each connection is the same Next, let’s tally the number of possible connections between the fax machines: Here are illustrative examples: Two fax machines produce a value of one Three fax machines generate a value of three Four fax machines create a value of six Now let’s see if the same Metcalfe's law helps people in organizations & Project team size. Recent research from (Bain company’s), a manager burned an average of 16 hours a week managing emails and attending meetings that were unnecessary. For any organization, this amount of lost productivity is unhelpful. But it also signifies an important opportunity: the overall productivity increase likely in the modern enterprise can range as high as 30%, depending on the organization and function. The effective solution is part “analog” and part “digital.” The analog tools are old school: approach and culture. The foundational element for productivity is a plan clearly stated, effectively communicated, and linked to frontline priorities. The other foundational element is a culture that values disciplined and engaged interaction. It is focused on action and results. These analog managing methods are essential. But in the modern and linked enterprise, they are no longer adequate. Here are the 5 significant & quick low-hanging “small team benefits” 1. Teams will be more productive. Team building for small groups can easily be attained, thereby leading to more productive workers. 2. Employees feel additional support. Employees in lesser groups are able to feel more appreciated and seen. 3. Teams are able to get things done faster. Working in a small team makes work faster because you’ll be able to communicate clearly and effectively with one another, Decisions are taken more quickly, and tasks are carried out faster than expected. 4. Teams are extra creative and innovative. The humble act of having fewer people means there’s less room for people to stop or get stuck in their ways. 5. Teams can make decisions faster than big teams can. When you only have three or five people who need to agree on something before it happens, everyone gets on board quickly and easily, managing a small team can support employees come together and help them attain at a conclusion. The point is that digital technology has vividly enhanced a company's ability to conquest the dark side of Metcalfe's Law. Understanding the full potential of the current, connected company requires both good “analog management” and enhanced digital tools to remain focused on the priorities and culture that make an organization successful

-
Balaji Loganathan replied to Vishwadeep Khatri's topic in We ask and you answer! The best answer wins!Shainin RED X projects are evidence-based; converging on the main source of variation, the emphasizing principle is DY = f(Dx)The largest value will result from a combination of a significant coefficient and a large change in X. What is the difference between Shainin and Six Sigma? The main difference between the Shainin Red X® approach (FACTUAL) and the Six Sigma methodology (DMAIC) is the phase Approach. The Red X develops a strategy based upon the physics of the problem and the comparison of the BOB (Best of Best) and WOW (Worst of Worst) parts Any problem-solving methodology involves two phases’ diagnostic and remedial phases. The diagnostic phase is concerned with measuring and analyzing the current process performance while the remedial phase involves of various corrective actions taken to improve the process and monitoring the new process to make it a culture. Tables show the comparison between the six sigma and Shainin methodological approaches. The basis for Comparison Six Sigma Red X Meaning Six sigma methodology attempts to improve the existing process The Shainin System™ (SS) is defined as a problem-solving system designed for medium- to high-volume processes where this methodology follows FACTUAL approach. Focuses on - Process Focused Red X statistical engineering identifies a set of tools first used to identify the Red X, and then to monitor the effectiveness of controlling the Red X. Shainin system focuses on understanding the machine or parts problem and assembly operations facilities Methodology Six Sigma uses DMAIC (Define, Measure, Analysis, Improve, control) Red X approach uses the following structure, called FACTUAL (Focus, Approach, Converge, Test, understand, Apply, Leverage Domain Knowledge No Deep understanding is required of the Y & the problem You must have a deep understanding of the Y and the problem. Tools used Descriptive statistics. Regression analysis, designed experiments, hypothesis tests, analysis of variance (ANOVA), and control charts. Shainin systems are such as Isoplot, Multi-Vari analysis, Concentration Chart, Component search, Paired comparison, Product/Process search, Variable search, Full factorial, B versus C, etc Skill Six sigma required strong statistical & analytical knowledge RED x requires good technical knowledge, engineering skills, common sense, and simple statistics to solve technical problems with statistical confidence


-
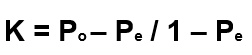
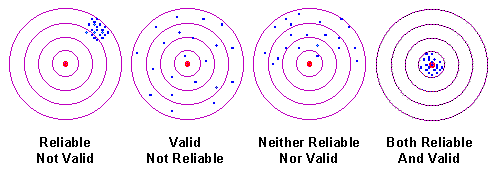
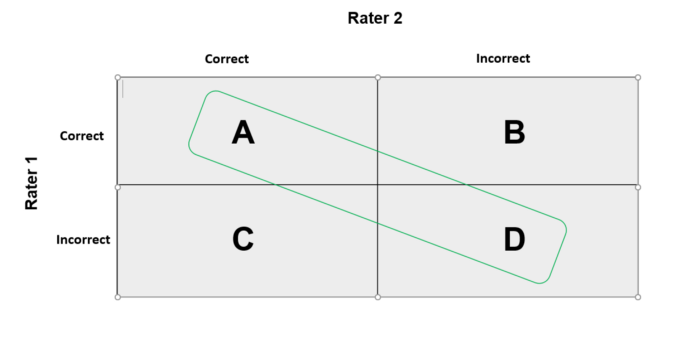
Balaji Loganathan replied to Vishwadeep Khatri's topic in We ask and you answer! The best answer wins!Kappa, one of many coefficients used to evaluate inter-rater and similar types of reliability, was developed in 1960 by Jacob Cohen. Kappa is denoted k, an index used to measure the level of consistency between two raters. Kappa value used for? The kappa is frequently used to test inter-rater reliability. The significance of rater reliability lies in the fact that it characterizes the extent to which the data collected in the study are correct representations of the variables measured. What is a good kappa coefficient? Usually, a kappa of less than 0.4 is reflected as poor (a Kappa of 0 means there is no difference between the observers and chance alone). Kappa values of 0.4 to 0.75 are measured as moderate to good and a kappa of > 0.75 shows excellent agreement. What is Fleiss Kappa? Fleiss' kappa named after Joseph L. Fleiss is a way of measuring, for assessing the reliability of agreement between a fixed numbers of raters. This helps us to test to measure the inter-rater agreement between two or more raters. What is Cohen’s Kappa? Cohen’s kappa measures the agreement between two raters whom each classifies mutually exclusive categories. The best way to think about this is that Cohen’s Kappa is a quantitative measure of reliability for two raters that are rating the same thing, corrected for how often the raters may agree by chance. Cohen's kappa is a metric regularly used to assess the agreement between two raters. Cohen’s can also be used to measure the performance of a classification model. But before that, we need to understand the characteristics between reliability and validity Validity and Reliability - Validity means we are concerned with the degree to which a test measures what it claims to measure or in other words, how accurate the test is. On the other side, reliability is disturbed more by the degree to which a test produces similar results under consistent conditions or to put it another way, the precision of a test. Check this dartboard example of reliability and validity. For the results of a useful experiment, good reliability is important. But, reliability can be broken down into different types, Intra-rater reliability and Inter-rater reliability. · Intra-rater reliability is associated with the degree of agreement between different measurements done by the same person. · Inter-rater reliability is connected to the degree of agreement between two or more raters. Evaluating Cohen’s Kappa The value for kappa can be < 0 (negative). A score of 0 means that there is random agreement among raters, while a score of 1 means that there is the complete agreement between the raters. It’s essential that we acquaint ourselves with figure 2 to have a strong understanding. Figure 2: N x N grid used to interpret results of raters, Now let's break down each grid to our understanding A => The number of instances that both raters said were correct, and are in agreement. B => The total number of cases that Rater 2 said was incorrect, but Rater 1 said were correct. This case is a disagreement. C => The total number of occurrences that Rater 1 said was incorrect, but Rater 2 said were correct. This is also a disagreement. D => The total number of occasions that both Raters said were incorrect. And are in agreement. In order to work out the kappa value, we first need to know the probability of agreement (this explains why highlighted the agreement diagonal). This formula is derived by adding the number of tests to which the raters agree and then dividing it by the total number of tests. The formula for Cohen’s Kappa is the probability of agreement taken away from the probability of random agreement divided by 1 minus the probability of random agreement. Things to keep in mind when using Cohen’s 1. Cohen’s kappa is more useful than overall accuracy when working with unbalanced data. 2. The same simulation will give you lower values of Cohen’s kappa for unbalanced than for balanced test data. Lastly, When to Use Cohen’s over Fleiss? Fleiss' k works for any number of raters, however, Cohen's k only works for two raters; in addition, Fleiss' k permits each rater to be rating different items, while Cohen's k will only admit that both raters are rating identical items. However, Fleiss' k can lead to inconsistent results that, even with nominal categories, reordering the categories can change the results. But Cohen's version has its own problems and can lead to odd results when there are large differences in the occurrence of possible outcomes.
-
Balaji Loganathan replied to Vishwadeep Khatri's topic in We ask and you answer! The best answer wins!An Attribute Gage study is a study that studies the bias and repeatability of an attribute measurement system. It is useful to decide which sources are responsible for the variation of the measurement data. The best one of these is a go/no go gage. This gage basically tells you if the part passes or it fails. There are only two likely outcomes. Other attribute measurement systems can have many categories such as very good, good, poor and very poor What is an attribute agreement analysis? Attribute Agreement Analysis (or Attribute MSA) is one of the tools within MSA, used to estimate your measurement system when attribute (qualitative) measurements are involved. With this we can confirm that measurement error is at an acceptable level before conducting data analysis Attribute Agreement Analysis is the type of Measurement System Analysis (MSA) that is used to measure how well an attribute (discrete) measurement system is working. Gage R&R is the type of Measurement System Analysis (MSA) that is used to measure how well a variable (continuous) measurement system is working. The Attribute Agreement Analysis study can be set up in a similar way as a regular Gauge R&R study. A number of parts are selected from the process, and are gage by two or more operators. This doesn’t just relate to Pass/Fail type assessments, such as with Go/No-Go type gauges, but it can also be used to test the reliability of operators where they make assessment on a rating scale. When to Work with Attribute Agreement Analysis ? Work with Attribute Agreement Analysis if you aim at doing a Gage R&R (MSA) for a test/measurement that does NOT lead to results you could gage with a measurement instrument. we want it if the results are qualitative. Examples: Visual quality control of parts. Examination of whether the cleaning was done well. Check whether a document is accessible. To Run the Analysis What is our objective to find out? Accuracy or Precision? Reproducibility or Repeatability? To Calculate Accuracy Understand how well the measurement system comes to the same results as per the “standard”. Calculate % R & R Shows how exactly the different appraisers agree about results and how precisely one and the same appraiser comes to the same results when measuring multiple times. Total % R&R defines the level of agreement within/ between appraisers and a standard Total %R&R should be 100% (when the study conditions are different from reality every result below 100% will lead to a measurement system not worth trusting) If the Total %R&R is less than 100% examine the results to see if this is a problem of repeatability, reproducibility or both

-
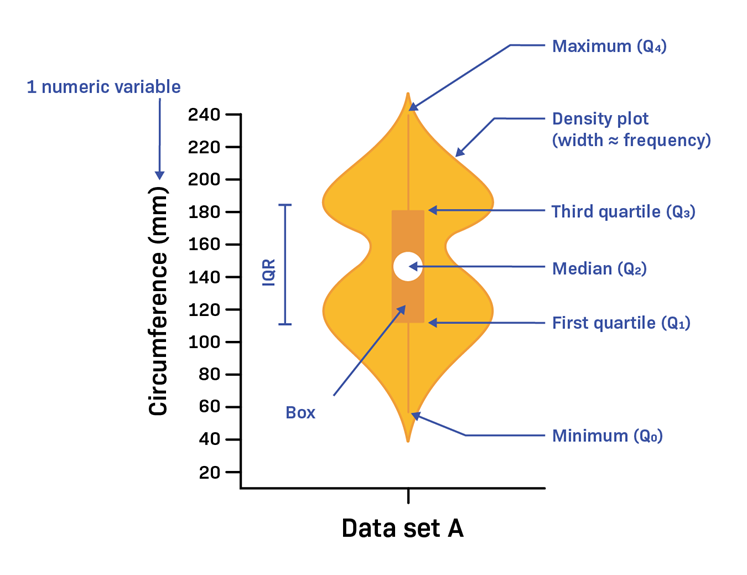
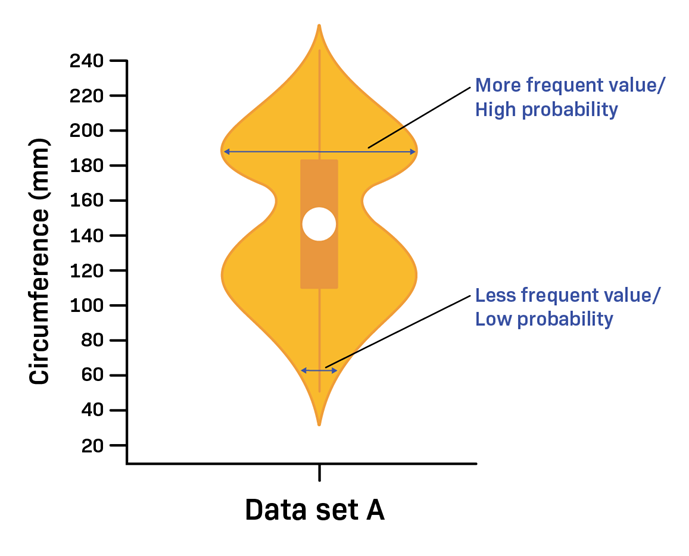
Balaji Loganathan replied to Vishwadeep Khatri's topic in We ask and you answer! The best answer wins!A violin plot is a fusion of a box plot and a kernel density plot, which displays peaks in the data. It helps us to visualize the distribution of numerical data. Box plots can only show summary statistics, but violin plots can depict summary statistics and the density of each variable. The width of the Probability Density Function defines how often that value occurs in the data set. The wider areas of the density plot display values that occur more frequently. Violin plots are also useful in multiple distributions at once for comparison. A narrower density plot indicates values that occur less frequently. The picture below shows the shape of a data set, a violin plot can summarize a data set using five values by the following: 1. The minimum 2. First quartile 3. Median 4. Third quartile 5. Maximum How do you read a violin plot? A violin plot shows how a data set varies along one variable by combining a boxplot with a Probability Density Function (PDF) the boxplot summarizes the center and spread: The white spot in the center of the box denotes the median. The length of the box indicates the (IQR) interquartile range