

Babita Mallick
Members
-
Joined
-
Last visited
Everything posted by Babita Mallick
-
Cognitive analytics as the word “Cognitive” indicates relates to being conscious mental activities as in thinking, reasoning, remembering, imaging, and learning. Cognitive Analytics refers to human like intelligence while performing certain task and bring together artificial intelligence (AI), machine learning algorithms, deep learnings and Data Analytics. Cognitive analytics simulates human mental thought process to learn from the data and extract the hidden patterns from it. There are 5 main types of analytics are considered – descriptive, diagnostic, predictive, prescriptive and cognitive. Descriptive analytics refers to the process of generating and interpreting data to describe what has occurred. It uses the raw data and, through data aggregation or data mining, provides valuable insights into the past. Predictive analytics as evident from the names forecasts potential future outcomes. It uses descriptive and predictive variables from the past occurrence, analyses and identifies the likelihood of an unknown future outcome. Prescriptive analytics is the next step in the progression of analytics wherein one draws specific recommendations to influence desired future outcome using the combination of data, mathematical models, and various business rules. Cognitive analytics brings together all intelligent technologies of analytics so that the software can learn by itself, draws conclusions, and assist in decision-making. Banking & finance, Retail and Healthcare are currently the three major business sector using Cognitive Analytics. Few examples of Cognitive Analytics in use today include Microsoft's Cortana, Apple's Siri, and IBM's Watson. Another example is Royal Bank of Canada that uses AI and ML to scan clients transactional histories and usage patterns to provide them with more personalized solutions. Companies are using cognitive analytics to refine product pricing based on purchase records and market trends and thereby increasing the possibility of customer acquisition and leading to revenue growth. Doctors are using to empower better decision-making for better treatment, greater cost-effectiveness, patient empowerment, and better health and fitness.
-
Inventory management means the process of ordering, storing and utilization of the inventory materials/components/finished products. It assumes minimization of the costs between the inventory setup costs and holding costs and thereby the total inventory costs is minimized. First In, Still Here (FISH) is a term that refers to slow moving inventory. This describes a scenario wherein a company still has inventory on hand that is not being sold due to inattention or obsolescence. This indicates an excessive inventory; risk of obsolete inventory which need to be written off and excessive working capital investment in inventory. Few are few challenges or drawbacks that is caused due to FISH. 1. It could lead to excess amount of inventory. 2. The risk involved is that (a) the product may expire that is go out of date and (b) less likely to be sold at full price. This is typically a case with products that have long shelf lives and/or low in customer demand. 3. Poor material management. This indicates over-ordering of materials or not having a balanced purchasing decisions not in line with the production rate. 4. This could indicate that sales are lower than the expected. This indicates a relooking at the customer demand. 5. Careful planning and analysis of business cycle, future demand analytics based on past sales as well as market trends can help one to avoid FISH, a slow-moving inventory.
-
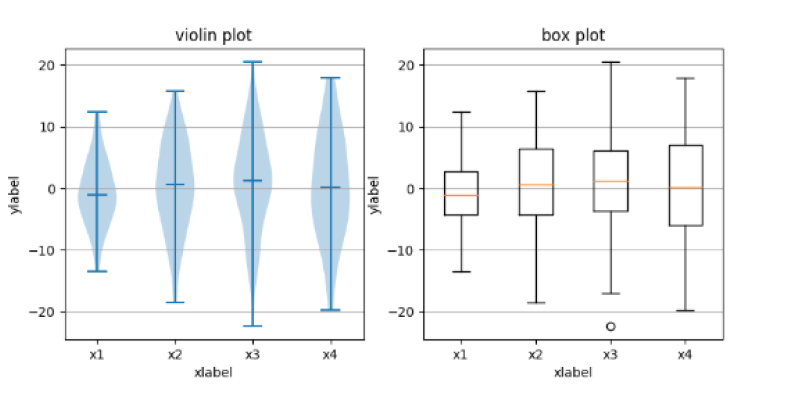
A Violin plot is a amalgam of a box plot and a kernel density plot that depicts peaks in the data. It is more informative than a plain box plot. A box plot only shows summary statics such as mean/median and interquartile ranges while violin plot presents the full distribution of data including density and statistics of each variable. This is very useful in cases where the data distribution is multimodal. Violin plot are useful while making a comparison of distributions between multiple groups and one can compare the peaks, valleys, and tails of each group's density curve. It intuitively shows the distribution of data in a data set. The violin plot helps in easy visualization with a viewer to understand the probability of things and therefore it is imperative for one to use a violin plot if you have a large enough dataset to capture the underlying probabilities of your dataset. But in situations where the data set is not big enough with unimodal distribution and additional information within do not add much information to show the audience which might not understand the essence of densities like in violin plot, then simple Box plot will be better suited.
-
Sig sigma is a process improvement methodology to reduce process variations and thereby reduce defects. The six sigma practitioners drive projects to reduce errors, operational cost, increase efficiency leading to increase in customer satisfaction. Six Sigma expert/experts exist at every level of this improvement project implementation based on their different role and proficiency. The Six sigma proficiency levels refer to formalized structure for the skill levels within the six-sigma methodology that needs to be adopted and application of this approach. The different proficiency levels are named as White Belt, Yellow Belt, Green Belt, Black Belt, and Master Black Belt. Below is short note on the role and responsibility as qualified or expected at each proficiency level. 1. White Belt: This is the beginner’s belt that provides the most basic introduction to the principal of six sigma and provides a foundation for those who may find it interesting to pursue further. 2. Yellow Belt: This signifies an understanding into the basic metrics and improvement methods of six sigma, an ability to integrate these basic learnings into the smaller improvement projects. The yellow belt certified often assist a Green and Black Belts with their projects. 3. Green Belt: They are trained in problem solving techniques, principle of DMAIC and its application by leading smaller improvement projects. They are involved in Black Belt projects with responsibilities if gathering data, executing experiments, and analysing information. They may not be experienced enough into the statistical experimental design and may need assistance of Black belt in identifying causes of process failures. At this level, an individual is expected to have the expertise in employing the DMAIC principal and complete a real-world project of improvement. 4. Black Belt: Certified Black belt are full time professionals who lead the team for Six Sigma projects. They are trained in the core six sigma principles and an in-depth understanding of the concepts & application of DMAIC, DMADOV, lean methodology and employing of right statistical experimental design and inferences drawn to identify the causes of process failures. This level is expected to impact not just efficiency but improve business cost and finding ways to reduce unnecessary expenses. 5. Master Black Belt: This is highest achievement and requires inordinate amount of dedication and exceptional leadership qualities. They are the experts in the methodology, resources, and practices of six sigma and expected to identify the organization improvement opportunities to improve business cost. Using the advanced skills in problem solving, resource management and project deployment, the expectation is to bring in unnecessary cost reduction and implement leaner processes with financial benefits. They can train and certify other six sigma. 6. Many organizations do have Executive or Champions who assumes a critical role at senior or middle executive level with the duty to understand the details of company vision, mission and metrics and use this to tailor a six-sigma plan to fit the corporation goals. Another key responsibility of the Champion is to remove the Roadblocks that could hinder the process.
-
A daily stand-up meeting in Agile is an opportunity for the project team to discuss a project's progress at a high level toward the Sprint Goal and adapt the Sprint Backlog as necessary. The 3 topics that are address in these daily stand-up meetings are: 1. What did you do yesterday? 2. What will you do today? 3. What (if anything) is blocking your progress? Addressing these 3 questions is to make sure everyone is aligned and if anything impedes the team from getting the work done, reduces the team productivity and slows down team speed in achieving the Sprint Goal. Impediments could be of many types such as - people issues - team not skilled enough - technical issues - operational issues - managerial issues like lack of management support. The impediments are different from obstacles (which relates to when something or someone entirely stands in the way. Impediments are also different from risks that are possible events/obstacles that occur while impediments are already reality. All impediments need not be fixed together in one go. But prioritize impediments based on impact on the progress/productivity, cost-benefit analysis, sequencing. Whole team’s viewpoint in identifying the top impediment should be seek and Scrum Master (SM) should ask the team to decide. Typically, SM is the best person to fix the impediments, while sometimes it could also be the project owner (PO)), development team (doers) or some people from outside the team. One expects to see a benefit from work on impediments in about every Sprint. A good SM creates an environment where impediments are raised. One need not wait for daily scrum meet to raise an impediment, but the as soon as one identifies one. And SM will push the team to decide on the impediment and act on removing them. The SM should evaluate on removal of an impediment based on following few questions such as: 1. Is it really an impediment or is it something the development team can resolve themselves? 2. Do we need to remove this impediment? 3. What is the team problem? Something will only become an impediment when it exceeds the self-organizing capabilities of the team. For example, scarcity of a skill might become an impediment if the development team can nott think of an alternate option themselves. Maybe a team member is eager to learn the desired skill and sees this as a great opportunity. Another example is team conflicts does not have to an impediment as SM can lead the team through a healthy conflict and debate into a stronger team. Few strategies that can help in removing the impediments: 1. Don’t wait for daily scrum to raise an impediment 2. Clear Sprint Goal can help in identifying if something is a real impediment 3. Differentiate between blocks and impediments 4. Create a simple flip-over board for easy visualization on the impediment, action plan to remove it and status as this will help in increasing transparency 5. Keep track of fixed impediments and incorporate in the Sprint Review and Retrospective 6. SM should have good understanding of the organizational culture so as to getting things done by choosing the right approach 7. Be brave and creative to take bold decisions 8. Collaborate with PO and other stakeholders 9. Stop spending time and effort in solving the wrong problem.
-
Robotic Process Automation (RPA) Intelligent Process Automation (IPA) RPA uses technology to emulate human tasks to complete a business process. RPA bots mimics the human actions that are repetitive computer based tasks and are rules-based with defined inputs & outputs, repeatable and occur frequently. IPA is the process of combining RPA with digital process automation (DPA) and artificial intelligence (AI) to create business process automation. RPA is helpful to automate high volume processes for which people were formerly engaged; for example, sending an automatic reply to an email. IPA can handle more complex end-to-end processes, both unstructured and structured data and helpful in automating non-routine task which need thoughtful considerations including judgements and conclusions. Unlike AI, RPA bots generally do not have the ability to learn. It follows rule based instructions. For example, if a changes occurs in an automated task, the bot will not be able to adjust and figure it out on its own. RPA can only mimic human actions unlike AI which is intended to simulate the ways that human think. IPA has built in knowledge repository, learning capabilities and brings a measure of decision making to the process. RPA needs structured data for it to perform. IPA can turn an unstructured data into structured data to use with RPA technologies. RPA evolved from three primary technologies: screen scrapping, workflow automation and AI. IPA refers to the application of Artificial Intelligence and related new technologies, including Computer Vision, Cognitive automation and Machine Learning to Robotic Process Automation. One major industry with RPA and IPA commonly used is the Insurance Industry. Using traditional RPA, some of the processes can be automated while using a lot more processes in insurance can be fast-tracked using cognitive automation. Auto Insurance, for instance, depends heavily on images of the cars or vehicles that are damaged using which the claim is assessed. When using image recognition, RPA can access the claims and process it with minimal human intervention.
-
The Pugh Matrix and AHP are both decision making methods using semi-objective input and attempt to make quantifiable comparisons between alternative solutions. The two methods rely on creation of criteria based on attributed customer value and subjective comparison and best framework for making choices ultimately depends on the demands of the situation and the preferences of the people involved. They both involves multicriteria evaluation using alternatives, wherein each alternative are given a rating, define the importance and criteria evaluation and commonly used for project prioritization and selection. AHP is a structured means of modelling the decision at hand. It consists of an overall goal, a group of options or alternatives for reaching the goal, and a group of factors or criteria that relate the alternatives to the goal. The disadvantage of it is the hidden assumptions made like consistency, difficult to use when number of criteria or alternatives are high (>7) and difficult to add new or remove existing criterion/alternative. The Pugh Matrix is easy to use and relies upon a series of pairwise comparisons between design candidates against a number of criteria or requirements. One advantage it has over other similar tools is its ability to handle multiple different decision criteria.
-
ANOVA (“Analysis of Variance”) tests the difference in the means of three or more independent groups are statistically significant by analysis the amount of variation within the group corresponding to the amount of variation between the groups based on a response variable (i.e. dependent variable). Two common types are one-way or two-way ANOVA. One way ANOVA determines how one factor impacts a response will be variable while Two-way ANOVA studies the impact due to two factors on response variable along with providing insight into the interaction between these two factors on the response variable. For example, to study the impact nature of dieting on weight loss will be a one-way ANOVA but the study of weight loss due to the nature of dieting and level of exercise will be a two-way ANOVA test. ANCOVA (“Analysis of Co-variance”) also tests if or not the means of three or more independent groups are statistically significantly different based on a response variable (i.e. dependent variable). Unlike ANOVA, ANCOVA includes both factor and one or more covariates (a continuous independent variable). ANCOVA divides group variations into individual differences and covariate, a metric independent variable. For example, consider an ANCOVA study to compare Test Score (Response or dependent variable) by levels of education as factor and number of hours spent studying as the continuous independent variable used a covariate. This allows to test if level of education has an impact on the test score after influence of the number of hours spent studying is removed. MANOVA (“Multivariate Analysis of Variance”) is an ANOVA with two or more continuous Response Variable. Like ANOVA, MANOVA can be both a one-way or two-way based on the number of factors analysed. For example: a One-way MANOVA (“Multivariate Analysis of Variance”) is an same as MANOVA with only difference being the inclusion of covariate for the analysis. This is similar to ANOVA vs ANCOVA. The example could be as below.


- 10 replies
-
- anova variants
- anova
- ancova
- manova
-
Tagged with:
-
Process maturity model or Capability Maturity Model determines the maturity based on if a process's predictability to meet the targeted outcomes. The process maturity for a given process is evaluated based on two factors: (1) the stage of completion of the process and (2) its capability for continuous improvement. It is determined based on a scale of 1 to 5. A process maturity level of 5 is being the most matured process that is complete with high consistent level of consistent level whereas process with score of 1 is an immature process which is not fully developed/or deployed and is inconsistent. A process is said to be mature if it is complete in terms of its usefulness, automated, reliability in information and continuously improving. Lean six sigma is a process improvement methodology focused on reduce and control variation; or in other words objective is to reduce waste and improve control. The DMAIC focus works on redesign work, refinement & improvement work and optimization & control work. Thus, DMAIC is typically applied to improve a level 2 process to 4 &5 higher levels by eliminating the waste and reducing the variation to improved controlled process. A process level of 5, is characterized by proactive improvement processes which is analyzed & improved regularly and strategically aligned to the business goal. Level 5 - continuously improving processes are tightened by deployment of continuous quality improvement tools such as Kaizan, 6sigma etc. Hence, level 5 process offers less opportunities for DMAIC. But there are instances wherein a highly matured business critical process can drop to lower level if not monitored or documents are revised according to the changes a business undergoes. In addition, a matured process may be automated but not fully deployed or documented; or for a continuous monitored process the trending has not being improved for better measurement systems and quality data based on current user requirements. Thus, DMAIC could be used to measure/analyze the current overall level that processes are and the gaps that exists.; and further improved with updated process control systems checks in place.
-
Project charter is a formal agreement which summarizes the project objective and authorization of it marks as the first step towards project execution. It is a structured document stating defined problem statement, business benefits with specific measurable metrics with targets, team members, sponsors along with detailed plan of the different phases of implementation. The charter helps in defining the scope of the project with identified linkages and stakeholders alignment which are critical for the success of the project. The absence of a project charter can lead to many risks such as no clear quantified business value and identified scope leading to organization lose money, time and ineffective resource utilization lack of commitment and planning can occur if no defined project implementation phase are stated and identified to be executed. This could lead to realization of ineffective project execution or outcome at the end of project or unnecessary delay bottleneck in implementation unless stakeholder's are identified and confirmed buy-in at beginning of the project; and further identification and definition of right quantifiable metrics is critical to assess the real impact upon implementation as otherwise could lead to realization of not-so-significant outcome on business value/need causing wastage of resources and money The success of the project can be indicated by how well defined project charter is. A clear business goal stated with precise success indicators & boundaries and stakeholders alliance can provide clarity on exact business value of the project and business worth; and help to assess challenges, resources, support required for the successful delivery of the project.
