sanchitar17
Members
-
Joined
-
Last visited
-
sanchitar17 changed their profile photo
-
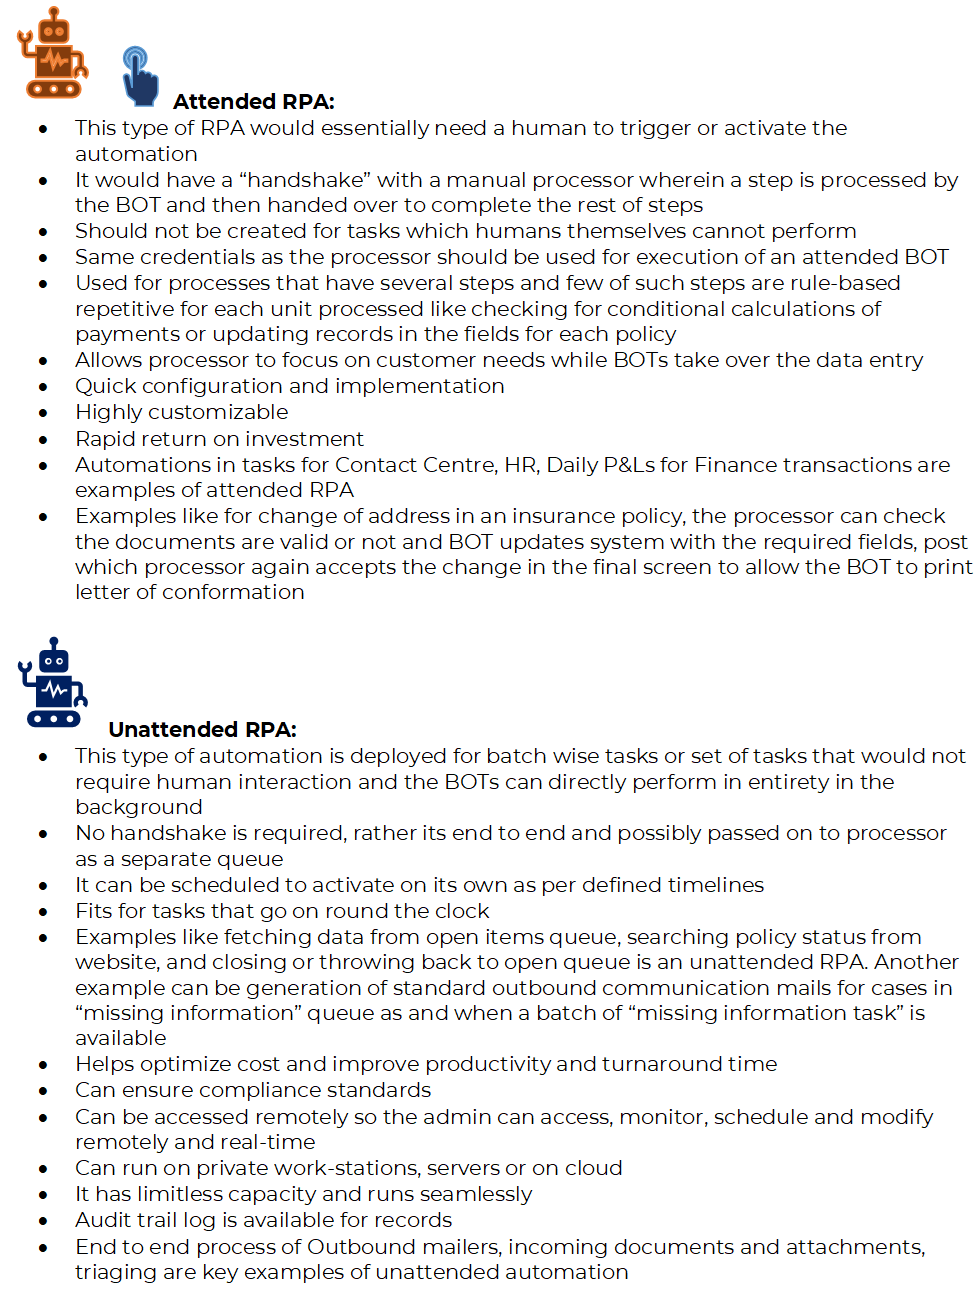
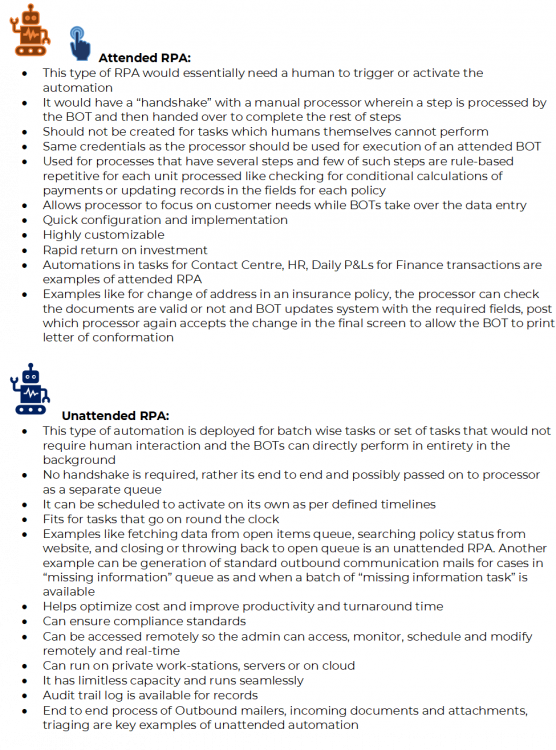
RPA or Robotic process automations are deployed to execute repetitive, rule-based routine tasks. The applications are coded with the commands to perform exactly what a human would do and are call BOTs which are the Robots. Across various sectors RPA is deployed to achieve a higher efficiency level in a short span of time. There are 2 types of RPA attended and unattended whereby it’s quite clear attended needs attention of someone. The RPA either attended or unattended, are deployed to replace human efforts, the benefits are in the form of reduced staff cost or staff realigned to complex processes and accurate processing. A glance through the 2 types of RPA is as below:
-
What is going to drive growth in an organization would depend on the product or the sales team is a big topic, is the product great enough to sell itself or does it need a superior sales team to push it? Well, it really is not that simple so let’s try to begin with the product, is the product great enough that we can sell it by virtue of its own exclusiveness? If the answer is yes, we are in a Product Led Growth model. Let’s look at Whatsapp, Uber, Swiggy and largely we know we started using them since liked the product because we probably tried for free and liked it. So, at that point in time the situation was PLG with low sales techniques. The products itself helps move in the sales funnel and do the work on this own. However, down the line we also see similar providers adopting sale-led strategies to re-enforce and boost customer reach out. So, in sales led, the efforts in the sales team are higher and the objective is to create better awareness about the product in the market which would include banners, demos, trials, etc., to influence customers. So, let’s say there was a “splash in the pan” with free accounts and trails offers however subscriptions and upgrades to a paid version is not as per expectation, that’s when a sales- led growth would have to be brought-in to attract customers, which would involve awareness building, package designing, bundle benefits for which they are required to pay for. Advantages Dis-advantages Product- Led · Usually has a lower customer acquisition cost · Quick sales cycles · Lower pricing plans · Scalable · Rapid market penetration due to wider reach with free trials etc · Low customer engagement cost · Few customers willing to pay · Hight cost and effort in serving free · Low customer engagement hence easy to lose · High drop-out if self-service is low or due to complex pricing (it’s time for ‘Sales Touch’) Sales- Led · High customer engagement during sales cycle · Better customer reach · Learnings for customers which creates better relationship · Longish sales cycle · High acquisition cost · Low conversion While we see most of us relating better to Product Led growth (PLG) model, it is dependent on how we plan growth, while we start off as PLG it is also true there must be a balance with Sales-Led growth (SLG). We need not choose one over the other but more importantly balance out at the right time. So in a product led, we have to be very clear on what we offer in the product which has a free use. The options should be critical enough to keep customers curious and yet cannot have the most important feature that doesn’t motivate to move to a paid version or a subscription. Example like TATA1MG Care Plans offers various critical and important services vs a non-member. So for regular users of pharmacy services, it makes sense to upgrade to a Care Plan and also get benefits of heath check-ups which anyways the customer is paying for somewhere, plus receive medicines much faster.
-
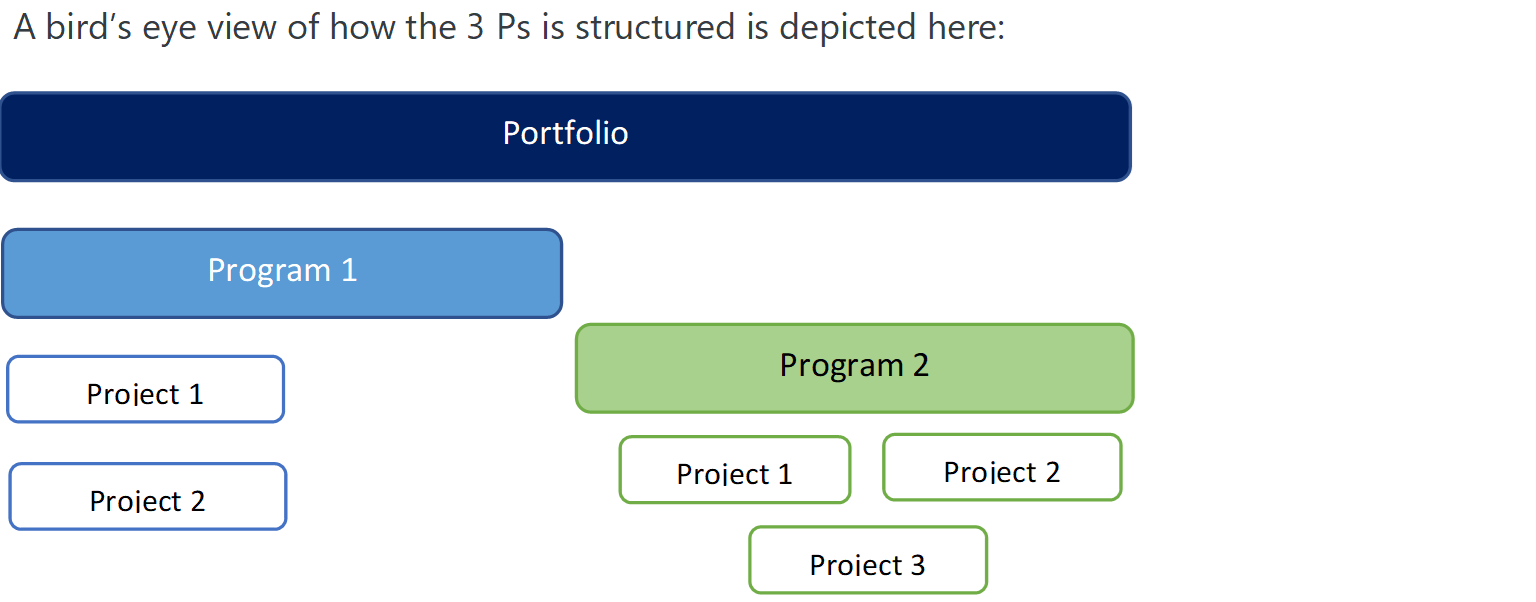
Project is a temporary endeavor to deliver a specific goal in the form of a product or service or a result. · Has a start and end date. · A project requires planning and has several steps to be followed before the outcome · Requires specific, dedicated resources to meet the requirement of various areas · There should be a primary customer or sponsor. · A project can be uncertain, it has risks associated like delays or budget which impact the project outcome So, project management would primarily involve the following deliverables: · Project goals · Resource requirements and scheduling · Task scheduling · Cost management · Project communication plan · Stakeholder management Program: · A program is a group of projects that are similar or related to one another, they need not be related Program management would primarily involve the following deliverables: · Allocation and prioritization of budgets · Define the overall roadmap · Resource availability · Managing progress and dependencies for various projects · Achieving overall program level goals Portfolio: · Are ongoing initiative that span across years of existence and are strategic in nature to achieve the overall organization goals Portfolio management would primarily involve the following deliverables: · Align with business objectives · Define strategy and goals for the programs · Communicate organizational goals and objectives to drive programs and projects · Derive the benefits from projects and programs These are the 3Ps of project management in Organization’s project management for an Interior Design and Architect Solution organization:


-
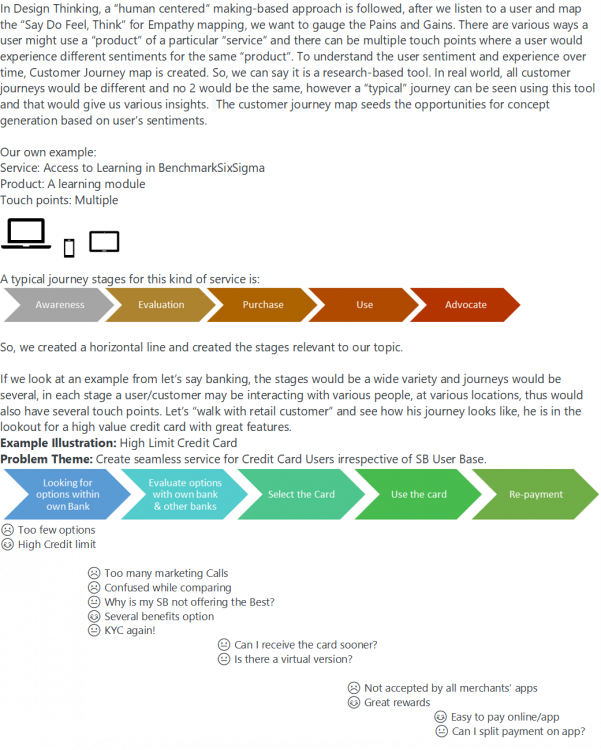
The opportunities now can be picked up basis how the customer felt, most of the time not expressed through the typical journey.
-
Project Charter is the launchpad of a project and a typical project doesn’t move ahead without it. It’s the first artifact that needs to be drafted so that projects can be prioritized and establish resource loading. It is living document, as the project matures typically 10-15% of the elements are further defined or refined. The importance lies in its key elements which covers the below: Business Case: explains why something needs to be done “now” Opportunity Statement or Problem Statement: explains the opportunity or the defect that need to be addressed and benefits associated with such improvement Goal Statement: defines the quantified objective of the project and by when Project Scope: defines the project boundaries Project Plan: phase wise timeline for the project to be completed Team Selection: Selected team members are assigned responsibilities Now if this charter is not created for a project and a project is initiated by a Project Lead, there would be several risks as outlined below: There would be risk of management focus on the objectives and outcomes if charter is not created and signed off. Rationale for the project would be questionable eventually Strategic sense to address the problem may not tie up and loose traction There can be risk of the project becoming counter-productive if relevant business issue is not selected and the charter is absent Significance of the problem may itself be low and without a charter there would be risk of agreement of the project need Cost of project may be higher than targeted benefits and questioned later if a charter is absent Risk of absence of Charter with defined timelines may result in low traction and prolong overall timelines Project scope creep may arise, what’s included and what’s excluded should be clear and present on the charter Resources may be unavailable or inadequately available if right resourcing is not done and mentioned in the Charter. The resource load should be clearly communicated with Stakeholder and Champion for sign off. We may also run a risk of “inappropriate” resource for the project which may impact all deliverables We would also run a risk in delayed decisions of solution implementation due to absence of charter There can be a potential regulatory issue if a project is headed in a direction the charter for which is not agreed by the management and the business priority happens to be regulatory issues There can be delays which may occur due to absence of an agreed charter, the consequences can lead to penalties/legal actions. Management may single out project lead for not documenting and obtaining sign-off of a Project Charter The absence of charter may lead of unavailability of information when needed, thus impacting not just the timelines but accuracy of analysis There can be serious data privacy issues if a signed off Charter is absent; there can be instances of use of data sets that are confidential and unauthorized access/use may lead to contractual breaches in case of client-vendor business model There can be a risk of project duplication if a charter is not created and signed off. Further to the above, if project is run without Charter, there is a risk of “no- recognition” for the project itself and team, despite following the right rigor and analysis
-
As LSS professional often we find ourselves in a tight situation and complete deliverables under pressure. There is a chance that due to several external factors around us we end up Data dredging, also referred as "data fishing" which means analyzing data in such a manner so that possible relationships between data are somehow demonstrated. The effects are harmful because it defeats the purpose of true hypothesis testing. Some of the other terms of data dredging are “p-hacking”, “data snooping”, “fishing trip” and so on. For instance, we want to prove a hypothesis during a pre-project and post project improvement analysis, however the data doesn’t reveal so and we use a “cherry picked” sample which helped prove the point of improvement statistically. This would result in data dredging! In LSS world, unless factors are statistically significant, it doesn’t have the “value” and to prove the hypothesis using a statistical test quickly may end up in data dredging. Sometimes, unintentionally; more often a move made to close the case with some bias. It is easy to access large data set and perform analysis to come up with various relationships at random. Sometimes, data dredging may result in accidental correlation which otherwise may not have been identified. However, in our endeavor to research/analyze, it is important to recognize a valid relationship and focus on unbiased data set to arrive at accurate conclusions. The end results can be harmful in many ways: · Proved a hypothesis as statistically significant which may be later be proved as ‘not significant’ · Solutions are framed around a “so-called” significant cause whereas it may not help resolve the issue thereby becoming a questionable move later · Time/Effort spent would be a waste and end up being anti-LSS (Lean says reduce waste!) · Credibility of the professional may go down if practiced frequently and may put the entire organization in the wrong spot We can avoid data dredging by adopting practices like: · Ensuring data set is sufficient, relevant, representative, and not just a mere “subset” · Negotiate for adequate time, effort required for analysis and not perform under pressure, if we must turn around something quickly, we do so with a caution statement and not conclude too soon · Make data capture process accurate, robust, and exhaustive · Question the extreme values · Go with a balance of “data door” and “process door” approach in the project so that all possibilities are explored, and data/information are better presented for operational consumption without getting stuck in hypothesis testing · Keep it simple, use business sense as well to justify causation once we see correlation A scenario: The project lead shared the following data towards the end of project end for a review with the mentor: Pro-Project (AHT in mins) 20 Post Project (AHT in mins) 13 A better view for the project mentor would be the below table to mitigate data dredging as assess sustained performance: Pre Project (AHT in mins) 20 16 23 22 18 24 17 Post Project (AHT in mins) 12 16 13 12 14 13 11 Response is drafted basis relevance of Data Dredging typically in business process outsourcing.
-
A balanced design for ANOVA /DOE would be when the sample sizes are equal across all groups. And it is called as unbalanced when the sample sizes are not equal across the groups In the illustrations below, ANOVA (“analysis of variance”) models are used to determine whether the average handling time (AHT) of different tenure buckets of staff are same. For example, we perform a one-way ANOVA to determine if 3 different tenure groups differ in average handling time of a task. The table shows a balanced data set for one-way ANOVA: Groups: “<6 months” “6-12 months” “>12 months” Sample size: 30 30 30 The table shows an unbalanced data set for one-way ANOVA, there are unequal sample sizes. Groups: “<6 months” “6-12 months” “>12 months” Sample size: 28 30 29 Or if we perform a two-way ANOVA to determine if different combinations of tenure buckets and background have impact on average AHT of the staff: The table shows a balanced data set for 2-way ANOVA: Groups/Subgroups: “<6 months” “6-12 months” “>12 months” Insurance 30 30 30 Banking 30 30 30 Telecom 30 30 30 The table shows an unbalanced data set for 2-way ANOVA, there are unequal sample sizes. Groups/Subgroups: “<6 months” “6-12 months” “>12 months” Insurance 30 25 29 Banking 28 27 25 Telecom 38 29 24 A Balanced Design preferred because the power of an ANOVA is highest when sample sizes are equal across all group/sub-groups combinations. When the power is highest, it is a best way to detect differences among the means across Tenure and staff background when the mean AHT are truly different. Also, the overall F-statistic of the ANOVA is less sensitive to deviations to the assumption of equal variance. Thus, a balanced design would result in a reliable test statistic. However, it is difficult to achieve a balanced design, due to several factors like availability of staff for data capture, continuity of data capture or accuracy of data capture (more so in this illustration) In a situation the design is unbalanced we can try the following: 1. If the assumption of equal variance holds good and sample sizes across groups differ, we may proceed with an ANOVA/DOE anyway. Equal sample size or balanced design is not a mandatory requirement while it’s known that the statistical power to the test would be highest in a balanced design 2. If the assumption of equal variance holds good and sample sizes across groups differ, we may estimate and represent the missing data points, we can use the mean or median of the observations. We have to be cautious while doing this and must ensure the sample sizes among the groups/subgroups are near to equal before we do this. 3. If the sample sizes are not equal and the assumption of equal variances is also not holding good then we can perform a non-parametric test equivalent to ANOVA such as the (called Kruskal-Wallis ANOVA). This type of test would be better for unequal sample sizes and unequal variances across groups/subgroup combinations for handling time.
-
A rootogram is a data visualization technique to summarize a distribution of a variable. It has the frequencies in the Y axis and the response variable on the X axis. The frequencies are square root or relative frequencies. Rootogram can be for absolute count, relative rootogram converts counts into proportions, cumulative rootogram and cumulative relative rootogram. Its variation to the histogram, bars are plotted for observed frequencies and a curve for the fitted frequencies all on square-root scale. Overlaying the distribution curve tell us how an actual histogram differs from a distribution estimate. Mathematician John Tukey noted that the difference of comparing the distribution of data with a theoretical distribution from an ordinary histogram can be difficult because small frequencies are dominated by the larger frequencies so it difficult to understand the pattern of differences between the histogram bars and the curve. Advantages: The data visualization becomes much better if we use hanging bars- from the fitted curve, or a "suspended" histogram of deviations can be drawn. ‘hanging’ the observed results from the theoretical curve is drawn, so that the discrepancies are seen by comparison with the straight reference line at zero (horizontal axis) rather than a sloping curve. Image courtesy: andrewpwheeler.com

-
Analysis of variance (ANOVA) is used to assess the differences between means of 2 or more groups. It is a statistical hypothesis test to determine whether the means of at least two populations are different. Conditions for using ANOVA are: · a continuous dependent variable (Y) ad and a discrete independent variable (X) · should be a normal distribution. · Samples must be independent. · Population variances must be equal · Groups must have equal sample sizes. Hypothesis: Ho: μ1 = μ2 = μ3 =… μn Ha: μ1 ≠ μn A significant P value implies a low probability that the mean values for all groups are equal; it only tests for an overall difference between groups. Once the overall significance is arrived at, then we can use multiple comparison procedures for individual group comparisons. The right AVOVA test to perform can be decided basis the number of independent variables that are included in the ANOVA test A. One-way means the analysis of variance has one independent variable. Example: AHT of staff at different experience levels like <6 months and > 6 months B. Two-way means the test has two independent variables (which can have multiple levels), Example, For Jam sales/week, independent variables of brand of Jams and how many calories it has. Another example: AHT of staff at different experience levels like 3-6 months, 6-12 and >12 months for Different experience background like Insurance, Banking, etc. o The results from a Two- Way ANOVA will calculate a main effect and an interaction effect. o The main effect is similar to a One -Way ANOVA: each factor’s effect is considered separately and with the interaction effect, all factors are considered at the same time. C. MANOVA (multivariate analysis of variant) is another form of ANOVA for several dependent variables. For example, AHT for Task 1 for different Tenure groups/Experience background and AHT for Task 2 as well. Possibly to assess if the combination has any adverse impact on speed of Task 2. It tests multiple dependent variables at the same time by testing: a. changes to the independent variables have statistically significant effects on dependent variables b. interactions among dependent variables c. interactions among independent variables For data that is not Normally distributed, we can use a non-parametric, analogue of one-way ANOVA (called Kruskal-Wallis ANOVA)
-
Yamazumi chart is a simple visual management tool that has graphical summary of a process which help identify the opportunities for initiating Kaizen events. It is good indicator to see the variation among workstations that do the same set of activities. Yamazumi is a Japanese term which means to stack up so in this chart each process activity is individually presented in a stacked-up bar chart. The steps can be seen as separate blocks within the bar for each operator and it becomes easy to focus on the steps which take longer or operators who take longer. The steps can also be categorized as VA/BVA and NVA and at a quick glance optimization opportunity can be arrived at. The Y axis represents the cycle time and X axis represents the operators doing the task or processes Using Yamazumi Chart we can graphically present the step wise time, from here we can easily recognize that process4 is the bottle neck and it has non value added time presented by the red section, if we worked on reducing the time spent there, the bottle neck will be solved and the line will meet the takt time. Similarly on the below exampple, Operator # 2 has exceeded the Takt tim annd has about 35 econds of NVA time whch if worked upon would help reduce the time for Opertor #2 and remian within Takt time. Benefits: • Reduces delay • Reduces cost associated with time • Helps in line balancing • Establish improvement mindset These would overall help in improving efficiency of the workshop/process.


-
To compare 1-1 variance, we use F-Test or Levene’s Test. To compare variances for 2 or more populations, we use Levene's test or Bartlett's test. If we are sure data are normally distributed, Bartlett's test might have greater statistical power. The hypothesis testing is performed to assess variance of at least 1 group is significantly different from the rest or if all have equal variance. The individual confidence level indicates how confident we can be that an individual confidence interval contains the population variance of that specific group. However, because there are multiple confidence intervals in the set, you can be only 95% confident that all the intervals contain the true values. Each confidence interval may be a range of likely values for Standard deviation of the corresponding population. To maintain the simultaneous confidence level, the Bonferroni confidence intervals are adjusted. Controlling the simultaneous confidence level is particularly important when multiple confidence intervals are assessed. If the simultaneous confidence level is not controlled, the chance that at least one confidence interval does not contain the true standard deviation increases with the number of confidence intervals.
-
This response is based on typical scenarios experienced in the off shoring/BPS processes. Outliers are those data points which are different from the rest of the data points and can be distinguished using graphical analysis. Visually they stand out when we view a scatter plot or box plot. In a control chart, the data points beyond the LCL & LCL are the outliers. They impact the overall central tendency if the values are significantly high or low. Example of AHT metric of a process, wherein 2-3 transactions or calls may have a significantly high AHT or low AHT. Let’s say AHT is 15 mins where few odd data points are 72 mins or 1 min. These impact the overall calculation of central tendency due to extreme values. From the below, Section B has extreme values hence the Mean is influenced. So is the Std deviation. In comparison with section A data set, the values in B range from 2 to 80 while A has more closer values. Mean 15.09 18.60 Median 15.00 14.00 Mode 15.00 14.50 Std Dev 2.39 20.70 A B 15.00 14.00 14.00 2.00 15.00 14.50 15.00 11.50 12.00 12.50 17.00 80.00 12.00 12.00 16.00 16.00 13.00 14.50 17.00 13.00 20.00 14.60 These can be because of: Ø Erroneous data entry: A manual input in data tracking of AHT Ø Erroneous measurement system: the system or tool which tracks AHT had a glitch that incorrectly tracked few data points, or a processor had to manually stop the timer which wasn’t stopped at the right time causing the timer to run longer Ø Genuine scenarios: A truly lengthy call or case where it took much longer. o A complicated case o A long call wherein a complaint has been resolved o A long call wherein a person with disability is being assisted where its makes sense to remain customer centric and try to provide a better customer experience. Options to deal with Outliers: · Investigate and eliminate: if we know the data points found as outliers are inaccurate reflection of process, it can be eliminated due to obvious reasons. Example if there is a known issue in AHT data tracking which spikes up the AHT to >50 mins we can safely eliminate it. · Investigate and retain: As per research, if we realize the outlier data point is valid, can acknowledge and retain it, we may have to treat it differently however need not be excluded from the entire study. · Investigate and modify: As per research, if we conclude there is a known reason for a spike in AHT, we can modify the data point by capping it. Example, if we know there is manual error in capture AHT; many be timer ran a bit too long and associate didn’t click on stop button, we can cap the AHT tracked to a known value basis the nature of the case handled · Use different method: for assessing central tendency we can use median instead using mean which doesn’t get heavily impacted by outliers or use of equivalent nonparametric tests etc.