SIDDHESHWAR JANGID
Members
-
Joined
-
Last visited
Everything posted by SIDDHESHWAR JANGID
-
SIDDHESHWAR JANGID replied to Vishwadeep Khatri's topic in We ask and you answer! The best answer wins!Manage by Metric , not Manage the Metric Many times, teams are overly focused on Key performance indicators and forget the underlying goal that these goals represent. This situation leads to narrow and sort tern approach where the primary objective is to Hit numbers, and sometimes it is on the expense of organizational Goal, customer satisfaction, and sustainable growth. Impact on customer satisfaction and business goals Short term goals on long term losses Neglect the customer needs Stifled innovations, which has not impact on business goal. Misaligned priorities, etc. Preventive measures To prevent such situation of managed by metric - Use balance scorecard which has mix of financial and non-financial metric - Some metric should be defined such that they can reflect direct customer satisfaction and experience. - Regular review of metric so all metric are aligned with the organizational goal. - Create a culture to appreciate values which drive long term growth. Happy learning...
-
SIDDHESHWAR JANGID replied to Vishwadeep Khatri's topic in We ask and you answer! The best answer wins!Post-Purchase Rationalization Many times we have purchased a product and then suddenly we realized this not what we wanted. Still we try to justify our purchase and give high Customer satisfaction feedback to save our back or to avoid cognitive dissonance. This Leads to Higher customer satisfaction score. In Lean Six Sigma world, where Major KPI for the project is Customer satisfaction, Post purchase rationalization creates Misleading positive satisfaction scores Reduced actionable insights because of disrupted data Biased feedback. To identify and rectify it's impact, the below methods can be used: - Sentimental analysis: - Generative AI can be utilized to check sentiments of customer feedback and identify this biasness. Past data analysis: - By tracking customer satisfaction over time changes and patterns in the customer sentiments can be identified. Customer behaviors: - Post purchase of product customer behavior can be identified like return rate, repeat purchase to look data skewness. Use lean six sigma tools: - Tools like Fishbone diagram, stakeholder analysis can be used to check the difference between actual and reported satisfaction scores.
-
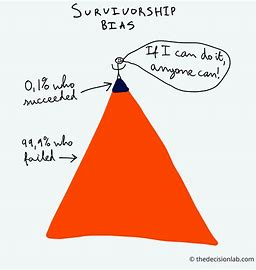
SIDDHESHWAR JANGID replied to Vishwadeep Khatri's topic in We ask and you answer! The best answer wins!Survivorship Bias – A logical Error Success and failure both go together. When one only focusses on success and do not understand where and why they failed, wrong conclusions are taken. For example, if we study only successful companies with out considering which failed, we may wrongly attribute success in certain Strategies and treats because of which other companies are failed. This bias conclusion with considering only successful factors only called Survivorship Bias. Negative impact on rational decision : - There can be cases where overly optimistic conclusions are taken. Misguided strategy can be taken due to bais and portion data only. Cause analysis can be wrong as failure reason are not analyzed. Measures to Avoid Survivorship Bias Include all data in any analysis for a project or company. Data structure should be collectively exhaustive. Critical validation and evaluation must be done is all elements of data are added. Final decision must be taken after considering multiple points of view only. Historical data of both success and failure must be studied and taken in consideration. Happy learning...
-
SIDDHESHWAR JANGID replied to Vishwadeep Khatri's topic in We ask and you answer! The best answer wins!Skewness Skewness is a measure of asymmetry about mean for any distribution. In probability and statistics mathematics, any distribution is called asymmetrical if left hand and right-hand side of the distribution is not equal. Types of skewness Skewness can be positive (on right side), Negative (on left hand side) or Zero (No skewness) about the mean. Positive Skewness: When a distribution has a longer tail on right hand side of it's peak, called positive skewness. Negative Skewness: When a distribution has a longer tail on left hand side of it's peak, called negative skewness. Zero Skewness: a distribution is symmetrical on both sides of mean and there is no skewness in data, it is called Zero skewness. Effect of skewness on data set interruption As we see skewness shows that data is not equally distributed about mean. Data with skewness can affect in the following manners:- Skewness data can influence the accuracy of mean, median and mode calculations. Outliers in skewed data can give wrong information about the data which can lead to wrong decisions. Generative AI algorithm can give the wrong interpretation for predictive analytics if data is skewed and not taken care. By transforming the data for normal distribution, we can reduce skewness and provide higher reliability of statistical results.
-
SIDDHESHWAR JANGID replied to Vishwadeep Khatri's topic in We ask and you answer! The best answer wins!Analytics Analytics is a process of discovering, interpreting, and communicating significant trends in data. These trends help to take well informed & Fact-based decision. Nowadays, more advanced analytics can be done using Generative AI and Machine learning flows. Analytics as per its objective can be categorized broadly as Below: Descriptive Analytics Diagnostic Analytics Predictive Analytics Prescriptive Analytics Let us understand one by one what all types of analytics means Descriptive Analytics: This type of analytics explains “What happened already”. Using past data trends and patterns, one can identify issues and act accordingly so the same will not happen in future. Diagnostic Analytics: These analytics help to answer, “Why this happened”. Using process data causes issues and process behavior identified. Predictive Analytics: Predictive analytics answers to “What potentially can happen in future”. Using advanced machine learning tools , statistical analysis , future forecast of response can be found and accordingly, the risk of the same can be minimized or eliminated. Prescriptive Analytics: As name suggests it about “What should we do next”. When a issue has already been identified prescriptive analytics suggest an action plan to mitigate the concern by facts. Example: Using last month's day wise production data to identify on which day we lost the production is descriptive analytics. Going further analyzing the day where production loss happened and identifying the issues & root cause is diagnostic analytics. Again, going deeper and creating a system that can forecast the potential risk of concern, will be called predictive analytics. Like using vibration and temperature data identifying, after 5-10 day (about 1 and a half weeks) there can be breakdowns in the compressor. After identifying issues in the compressor, prescriptive analytics suggest a list of actions to be taken. Above is a comparison of all types of analytics. and we can understand difference between them. Taking about diagnostic analytics, we can say it focuses on the root cause identification of the concerns that have already occurred.
-
SIDDHESHWAR JANGID replied to Vishwadeep Khatri's topic in We ask and you answer! The best answer wins!Design of experiment ( DOE ) responses are generally continuous because these experiments are aim to produce wide range of results using various discreate and continuous variable. Still yes there is a possibility that DOE responses are discrete. For example counting of defect is discreate measure. Responses can be discrete, but there can be various limitations and risks with discrete responses. Below three are major point to mention for discreate response DOE Loss of details:- Granule details of continuous data is advantage, with discrete data, these details are missed out. For Example, when we measure defect count in a batch, we losses details of exact size of defect and specification of defect. Analysis complexity: For discrete data, logistic / poisson regression has to be performed, which is complex compared to linear regression. This Makes analysis complex. Example : No of student passed final exam. Sample size: Discrete data often requires a larger sample size for analysis. This increases cost and time required for the experiments. Below are some examples of the discrete response: No of defect in manufacturing. No of customer identified by a survey. No of student passed in unit test. No of patients facing side effect of a medicine
-
SIDDHESHWAR JANGID replied to Vishwadeep Khatri's topic in We ask and you answer! The best answer wins!Generative AI is AI which can generate Text, Video, Images, and prediction data based on available information. Lean Six Sigma is all about doing fact-based projects in a structured manner so that sources of waste, risk, and variation can be eliminated or reduced. Generative AI tool can collect relevant data and analysis to make critical tasks easy, predict trends and enable more efficient process optimization. Below are some areas where Generative AI tools can leverage to enhance the effectiveness of lean six sigma initiative.: - Data analysis and insight: Various charts and trends can be seen using generative AI for root cause analysis and predictive analysis. Very complex and critical thinking-based root cause analysis can be done using these tools. Same Task an human may take day to complete. Process optimization: Based on specific prompts, generative AI can provide process mapping and optimization suggestions. Using existing picture / graph with your scenario analysis can be done. Using Existing VSM (Value steam mapping), future VSM can be prepared and suggestions for improvement can be identified. Process automation: Repetitive tasks can be atomized by generative AI use. data entry task and quality check of that data can be easily done using generative AI. Decision making made easy: - Now days dynamic dashboards can be created using simple prompts in power BI and other tools. Auto alert are generated using the data to take specific decision. This can expedite the Lean Six Sigma initiative with real time data analysis.
-
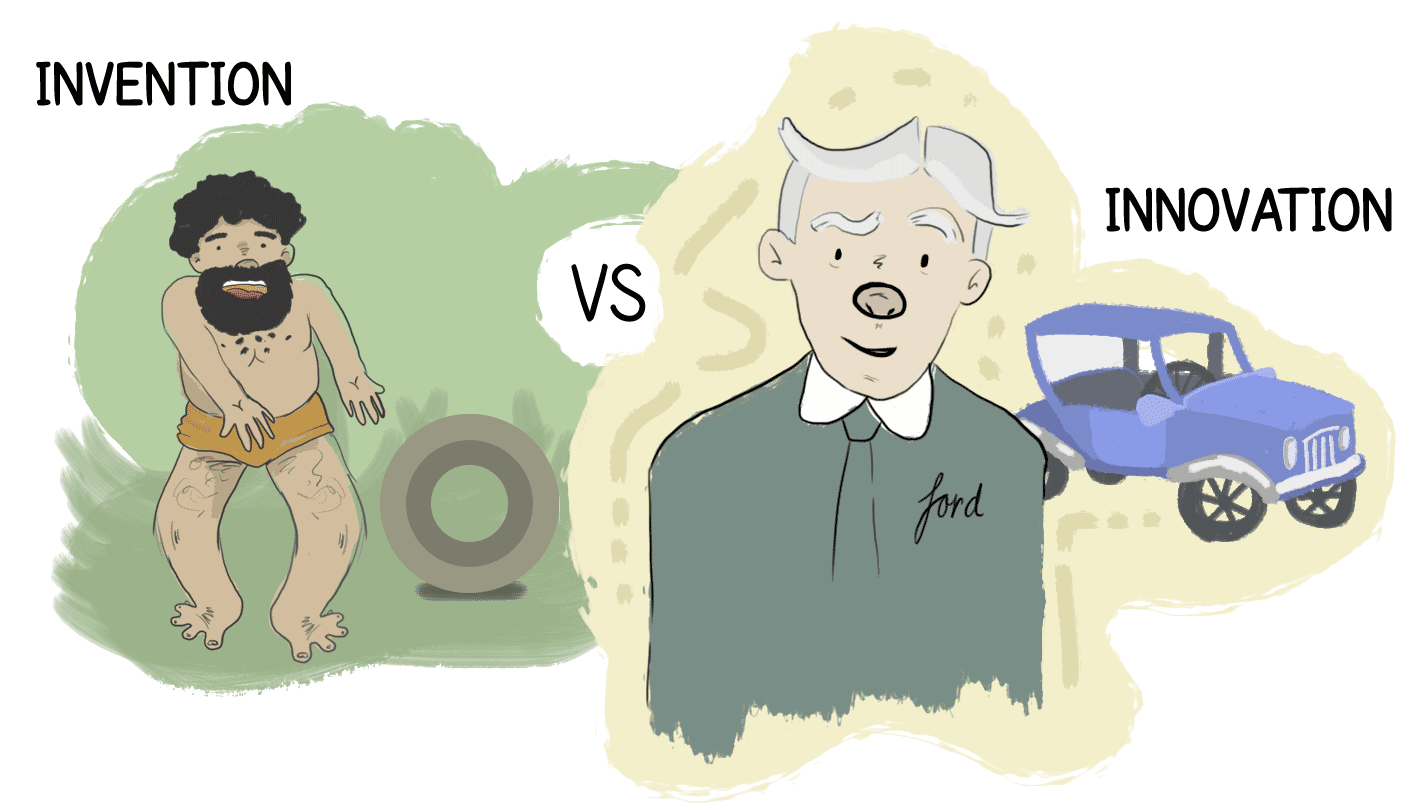
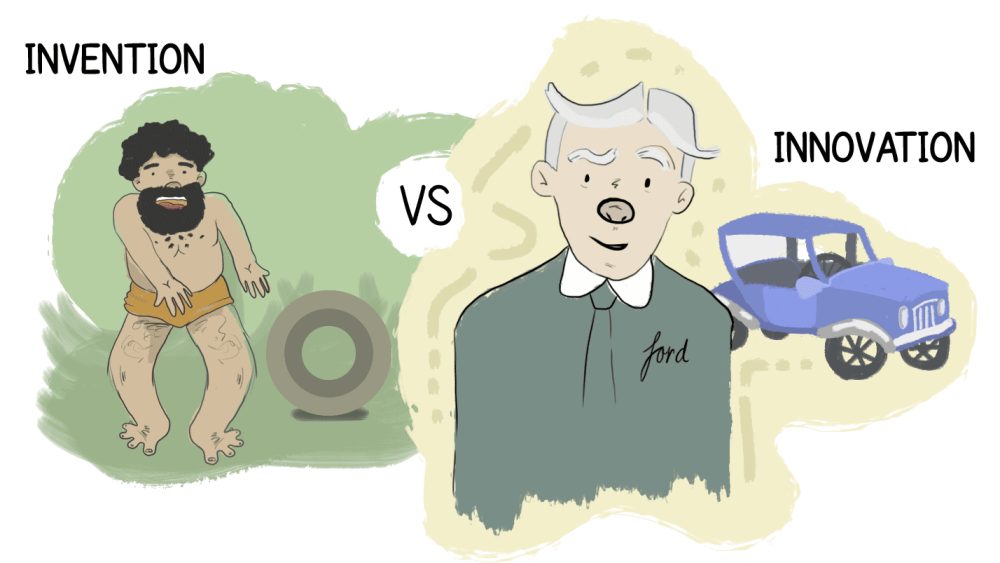
SIDDHESHWAR JANGID replied to Vishwadeep Khatri's topic in We ask and you answer! The best answer wins!Invention: Anything which was never created in the past and developed, is called invention. Example: the invention of blub, telephone, etc. Invention is always the result of novel research and experimentation. A great idea that is just changed into a Tangible product is called invention. Innovation: An invention or existing idea, when used to develop more value adding products by using technical, marketing, or other strategies, is called innovation. Ex. smart phone, LED, etc. Below is the more detailed comparison of Invention and Innovation Basis for Comparison Invention Innovation Meaning Invention refers to a completely new idea for a product or process that has never been created before. Innovation involves implementing an existing idea for a product or process that is being introduced for the first time. What is it? The invention is based on an original idea and its theoretical workings. Innovation focuses on adding value to something that already exists. Concept Innovation involves implementing an idea for a product or process being introduced. Innovation is characterized by the practical implementation of a new idea. Skills required Invention typically requires scientific skills. Innovation necessitates a combination of marketing, technical, and strategic skills. Occurs when Invention occurs when a new idea strikes a scientist or inventor. Innovation arises when there is a perceived need for a new product or an improvement to an existing product. Concerned with Invention is primarily concerned with a specific product or process. Innovation encompasses the integration of various products and processes. Lean Six Sigma can be applied to invention as well as innovation. During research and new idea / concept development, Lean Six Sigma can help organize research and structure the development process. Lean Six Sigma’s data driven approach can give more accurate and quality results during invention. Similarly, Lean Six Sigma can guide the development of new products out of existing products or services using data and a structured approach. Lean Sigma tool also expedites the overall development process of invention as well as innovation In both cases, Invention or Innovation Lean Six Sigma’s DMADV approach is used.
-
SIDDHESHWAR JANGID replied to Vishwadeep Khatri's topic in We ask and you answer! The best answer wins!Many times, smart, ambitious professionals are less productive and satisfied than they could be. Due to fear of showing weakness they stick to tasks which they are already good at rather than taking any risk and trying to innovative approach. This situation is Called Paradox of excellence. Adverse effects on Paradox of excellence: - After being in this Paradox for longer periods, individual & Teams Stop taking new initiative Do not seek help as they do not want to show their weakness. A collaborative approach is not taken by them. They become stagnant in the organization. They Miss opportunity of growth and improvement. Continuously striving to perfection and burnout Due to these innovations are stopped in their area, their team feels stagnant, no growth happens, and no improvements are seen around them. Overall company growth journey in business excellence perspective totally stop in such team and departments. Remedial measure on Paradox of excellence: - An organization that can provide goods and services at a compelling value only may stagnate and die unless it is able to harvest and exploit its creative and innovative energies To address Paradox of excellence overall system to be establish within the organization: - To promote a culture where Growth and innovative minds are appreciated, rather than perfection Encourages teams to take risks and look at failure as learning opportunities. Create an environment in the organization such teams feel safe to express and ask for help without any fear. Rewards and recognize the innovative ideas so everyone can be motivated to take calculated risks. Regular coaching, mentoring, training, and help must be provided to develop skills and growth mindset.

-
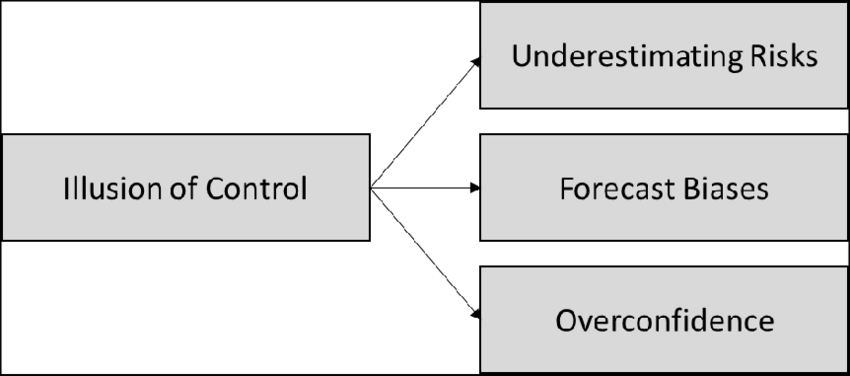
SIDDHESHWAR JANGID replied to Vishwadeep Khatri's topic in We ask and you answer! The best answer wins!Illusion of control What is the illusion of control: - Illusion of control is a cognitive bias. Many a time one assumes he can control the situation as per his experience and gut feeling, although there is no control on a situation. This situation is called is illusion of having control over something. Relation of Illusion of control with business excellence: Having gut feeling and understanding of experience can create an illusion that situation can be controlled or handled in a way. But hidden issues related to Resistance to change Inadequate resource allocation Wrong choice of improvement project Un found risk Management alignment etc. Biased decision taken Can be potential situation which can lead business excellence journey stuck up or incorrect direction. Image source: researchgate.net Remedial measure in case of illusion of control: Taking decision with only gut feeling may direct in wrong way and can show an uncontrolled situation as controlled one. Over and above gut feeling, below Scientific analysis must be carried out for all business excellence activities: - Data driven decision making for all activities. Involve all relevant stakeholders during assessment of a situation. Brainstorming session, 6 Hat thinking session and other CFT involvement tools can be used for same. Feedback must be taken from all stakeholders on any situation after and before the improvement. Go on Gemba to understand the situation.
-
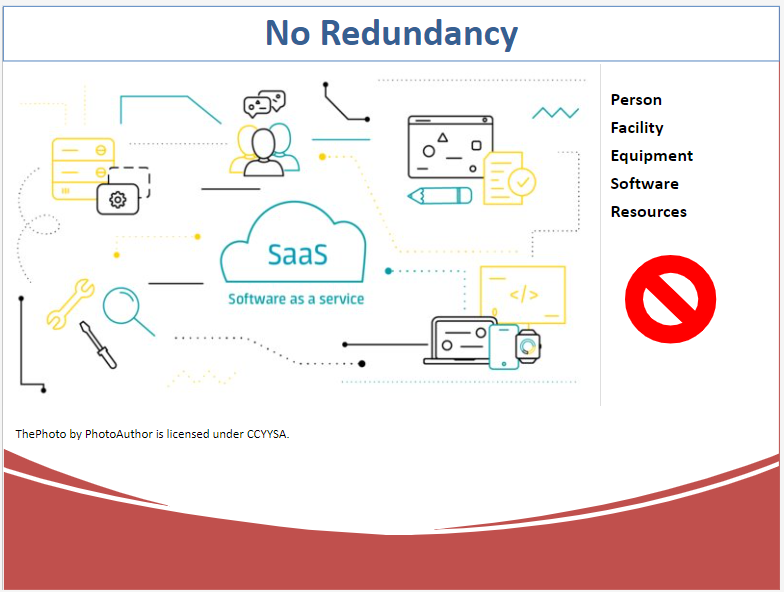
SIDDHESHWAR JANGID replied to Vishwadeep Khatri's topic in We ask and you answer! The best answer wins!Single Point of failure What it is (SPOF): - Any Person, Facility, Equipment, Software or any other resource for which no redundancy is available and if that goes down, the process or system dependent on that resource will stop totally. In such cases, the daily function of that process or system is hampered. Method to identification of SPOF Common sense can be used to find such failure modes. Otherwise, detailed risk assessment can be performed to do so. Risk assessment tools like PFMEA may help to find such all-failure points in any process. During the design phase itself DFMEA can be done. HIRA can be performed to find operation related failure mode. Hazop is again a widely used tool in risk assessment in process industry. With all these tools most of the SPOF (Single point of failure) can be found. Methods to Mitigate such risks Found all SPOFs must be classified in Severity, Detection and Occurrence to priorities to implement Mitigation plan. For the mitigation of such failure below action can be taken Create a redundancy plan in case of such failure. Support from an internal or external team can be taken for this. Create a buffer of such part. Training in hiring of people must be done if SPOF is a person, whose skill is mandated to run day to day operation. Flexible layout of the system can be done to eliminate the point so in case of failure other available systems can be used. Example: - Taking a case of manufacturing Out of all machines some critical machine or part of machine are available 1 or 2 only and if that fails whole manufacturing stops. Malfunction of Data base system can stop all machine internal working. Some specific tasks can be done by X person because he is having only training of that task, or one else is interested in same. Air (Utility) is critical for some Manufactuing operation, failure of which can stop the plant. To mitigate the same Critical machine components must be procured and stored in inventory. An additional standby server should be available in case of any issues faced. Hiring or training existing staff must be done critical task. Standby Air compressor can be installed to mitigate such failure of Air pressure. Put system such that before occurrence of such failure, it can be found if cannot be implemented.
-
SIDDHESHWAR JANGID replied to Vishwadeep Khatri's topic in We ask and you answer! The best answer wins!Defective % can be calculated by taking a ratio of Total No of defective items with Total observed Items and Yield is not thing but 100 % - Defective %. So, calculating accurate total no of defective is very critical in Yield % calculation. Below Is the table for challenge faced and counter measure (solutions) to address these challenge Challange Faced Counter Measure Data accuracy and consistency Inaccurate data can lead us in wrong direction of analysis Data collection system can be automized Standard data collection method can be set and operator to be trained on it Frequently changing operational definition Operation definition of inspection station CTQ has changed many times as per customer criteria. Which creates confusion between operators. CTQ definition can set on High standard, single definition can cover all customer requirement Operator skill level Deputing Un-skilled operator on inspection station in always a challenge. New operator many times takes time to understand all defects MSA must be done to ensure that data collected is reliable Multi skilling of operator can be done to handle such situation. AI based systems always make this process easy by auto identifying defects with location as well as defect name. All Defects are not visible. Sometimes all defects of a product cannot be seen due to eye fatigue or monotonous Job. AI based camera system can identify 100% defects. Job rotation in 2-3 Hr a shift of the operator on this type of station where eye fatigue is quite possible Example: I am considering a Solar Panel for this Example. In any solar panel manufacturing process below can be top defects. Poor soldering - Soldering not done up to required strength Ribbon Misalignment – Ribbon wire not on its place Cell Crack – Solar cell got a crack Dark Area in cells – Solar cell coming black in testing Gap Between Cell to Cell and other defects. Here in inspection process of solar module, two images are captured (visual image – to check visual defect & EL image – to check electrical related defects.). Operators need to look on the image and identify defects. Challanges faced in this inspection process are below Many times all defects cannot be logged due to manual process and data accuracy is not there. Not able to see because of human incapability of taking right measure by eye. Wrongly assessed defective as operator is newly deputed or, customer criteria are change and he is not trained. To address these challenge MES (Manufacturing execution system) can be used for fast data logging and data accuracy. On defined Frequency MSA to be conducted for operator. AI enabled system can be installed to identify all defects and criteria changes can be assessed by AI software only.