ChandraJ
Members
-
Joined
-
Last visited
Everything posted by ChandraJ
-
Dark data is the information that organizations collect, process and store during regular business activities, but generally fail to use for other purposes like analytics, business relationships and direct monetizing. Dark data often comprises most of the organizations’ universe of information assets. Thus, organizations often retain dark data only for compliance purposes. Storing and securing this dark data typically incurs more expense & sometimes greater risk than value to the organization. Examples of data : · Emails · Employee records · Internal processes · Video and sound recording data · Log files · Geolocation information Organizations may consider this dark data as too old to provide value, incomplete or redundant, or limited by a format that can’t be accessed or processed with available tools. All too often, they don’t even know that this data it exists with them. However, dark data may be one of the organization’s biggest untapped resources. Data is increasingly a major organizational assets and competitive organizations will need to tap into its full value. Globally, about 55% of an organization’s data is considered “dark data”. That means this data is unknown, undiscovered, unquantified, underutilized or completely untapped. Challenges with dark data: · Storage Costs · Regulatory Compliance · Data Governance · Data Visibility Companies using dark data for analytics: 1. Netflix is using data to create new blockbuster hit series. Netflix utilizes data to run predictive analytics to learn what exactly their customers would be receptive and interested to watch 2. Google is utilizing people analytics for a better workplace. People analytics teams dig deep in to their data and analyze employee performance review and feedback surveys to better understand how to build a better boss 3. Coca coal uses power of image recognition technology and data analytics to target uses based on the photos they share socially. It gives them insights in to the individuals drinking their products, where they are from and how their brand is being mentioned.
-
Berkson’s paradox or Berkson's fallacy is a counter-intuitive result in probability & statistics. For example. let's say we have two independent events A and B. By definition of independence, the conditional probability of occurrence of event-A given B is the same as the probability of occurrence of event-A: P(A|B) =P(A) that is, knowing that event-B occurred gives us no information about the probability that A has occurred. Berkson’s paradox states that, if we restrict ourselves to the cases where events A or B occurs, where least one of the events A or B occurs– knowledge that B has occurred makes it less likely that A has also occurred. P(A|B, A or B ) < P(A|A or B ) The reason that this result is counter-intuitive is that A and B are two independent events. That is P(A|B)=P(A). But they become negatively dependent on each other when we restrict ourselves to the cases where A or B occurs. Berkson’s paradox is a form of selection bias in restricting ourselves to A or B and we ignore the cases where both A and B do not occur. Examples For example, suppose a stamp collector has 1000 postage stamps, of which 300 are pretty and 100 are rare, with 30 being both pretty and rare. 10% of all stamps are rare and 10% of pretty stamps are rare. So prettiness tells nothing about rarity. The stamp collector puts the 370 stamps which are pretty or rare on the display. Just over 27% of the stamps on display are rare, but still only 10% of the pretty stamps on the display are rare . If an observer only considers stamps on the display, he will observe that a spurious negative relationship between prettiness and rarity as a result of the selection bias. That is, not-prettiness strongly indicates rarity in the display, but not in the total collection of stamps.
-
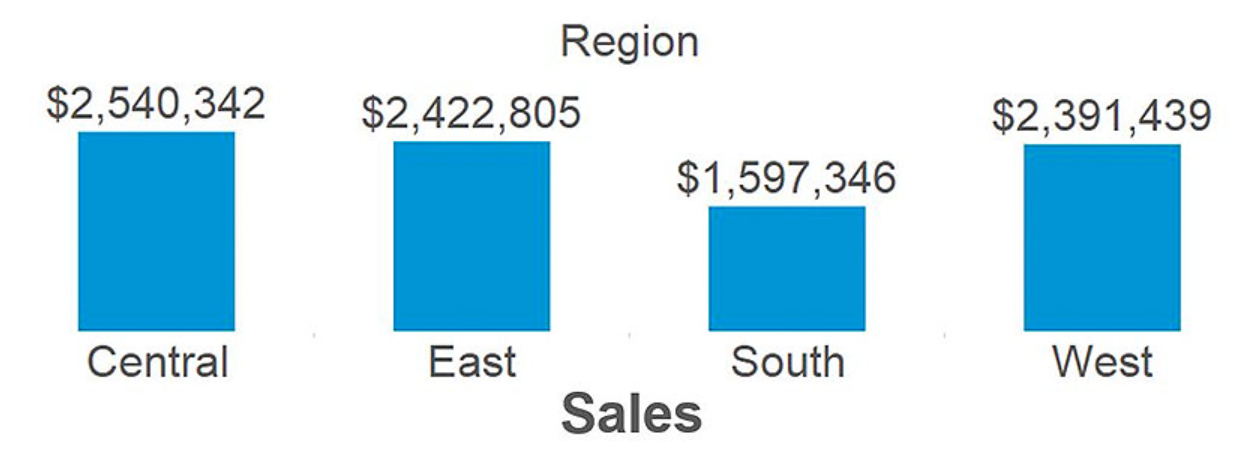
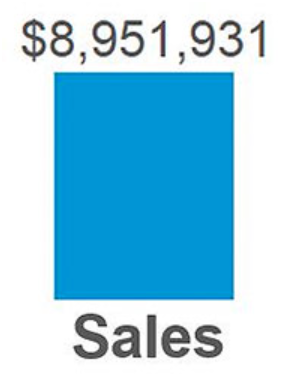
Data visualization is graphical representation of data by using visual elements like graphs, charts, and maps. Data visualization converts large & small data sets into visuals, which is easy to understand and process. Data visualization tools like Tableau and Power BI helps us to understand outliers, patterns, and trends in a data set. What is a measure? A measure is a field that is a dependent variable i.e. its value is a function of 1 or more dimensions. One of the most famous visualization tool Tableau treats any field containing numeric/quantitative information as a measure. For example. let's consider below bar chart, created in Tableau with the Sales measure from the Sample – Superstore data set: Sales is quantitative data, so by default, Tableau will consider that the field is a measure. The value of $8,951,931 is meaningless by itself. It is dependent on context that comes in the form of being broken down by the dimensions. What is a dimension? A dimension is a field that can be considered as an independent variable. Tableau by default treats any field containing qualitative, categorical information as a dimension. Below are Sales measure from above example, broken down by the dimension of Region: Now that our sales total has been broken down by region, we are able to start gaining insights from the data set. From the above example, we understand that South region has relatively low sales compared to the other regions. This is a descriptive insight that materialized only when we combined measures and dimensions together from our data set. Generally, measure is the number and dimension is what you “slice & dice” the number by. Another rule of thumb is that if it doesn’t make sense to sum up a number, it is likely a dimension.

-
James Cox and John Schleier in their book "Theory of Constraints Handbook" mentioned about Mafia offer.. Mafia offer is an unbelievably good offer that a company makes to its customers. The attractiveness of the Mafia offer makes it impossible for the customers to decline the offer and difficult for the competitors to match it. A Mafia Offer can be sold successfully to 70% or more of all prospective buyers because of its premium pricing. With Mafia offer, companies can create an un-refusable offer by removing unnecessary constraints or impediments to the flow of our customer’s throughput. Below are the few famous Mafia Offers from business history: 1) Hyundai – We will buy back your new car if you get laid off in the next two years (made during a recession year) 2) Domino's Pizza – We deliver in 30 minutes less – or you eat FREE. 3) Xerox – We offer copies when and where you need them, at an fixed rate per page (instead of selling expensive machines and inconvenient servicing) Unique Selling Proposition: Unique Selling Point is what makes your product or service different from the competition. USP sets your business apart and provides value to customers. There are many reasons to have an Unique Selling Proposition, but it primarily allows customers to differentiate you from other businesses out there. It doesn't take long for potential customers to decide whether they want to do business with you or not. USP is often considered as the cornerstone of a marketing strategy and is used as a differentiator from other products within the same category. While both USP and Mafia offer targets the customer to make the business, Mafia offer is more aggressive approach compared to USP.
-
In this era of automation and robotization, the way humans work with robots is becoming ever more important. Cobots or Collaborative robots are designed to work together with humans. This is in contrast to the traditional, stationary industrial robots that work separately & in isolation from human contact. Cobots are equipped with sensors and power limiting safety features that make collaboration between robot and humans possible. This collaboration of humans and Cobots makes the production process shorter, increases the productivity, reduces the defect rate and supports the employees in their work resulting in making them more efficient & valuable instead of replacing them. In the manufacturing industry, productivity is given lot of improtance and that is the key to success. The more productivity increased, the more profitable the business becomes. In recent years, more and more companies have chosen to implement cobots. Below are seven reasons why your company should consider investing in a cobot. 1. Cobots are easy to program 2. Cobots have short set-up time 3. Cobots can be used for different applications 4. Cobots are gives consistent results 5. Positive impact on employees 6. Increases productivity and optimizes processes 7. Shorter payback period Cobots can also be used in service industry to improve the productivity. Cobots can work together with humans to optimize their capabilities.
-
Business modelling is used to design current and future state of an process. This model is used by the Business Analysts and stakeholders to ensure that they have an accurate understanding of the current “As-Is” model of the process. Business Modelling is used to verify if stakeholders have a shared understanding of the proposed “To-be" of the solution. Business simulations are a hands-on, interactive learning experience that allow to understand the process thoroughly.. Instead of focusing on theoretical knowledge like in a typical classroom, participants build skills, improve conceptual knowledge, and gain a big picture view of the organization all at once. Business modelling and Business simulation will help in accelerating the DMAIC process improvement projects. By using Business modelling, we can understand the as is state of the process clearly and we can work on what we want to achieve, that is To be process. Simulation will help in getting the practical knowledge.
-
Yes, process maturity is related to DMAIC methodology. I support the thought "A process with higher maturity provides lesser opportunities for DMAIC" The basic objective of using DMAIC methodology is to reduce the variation in the process there by improve the quality, and customer satisfaction. DMAIC helps processes in reaching their full potential. Process maturity means the process is well documented, stream lined and focuses on continuous improvement. As the process is matured, there are less chances of variation. Mean lesser opportunities for DMAIC projects.
-
Sigma level represents number of defects per million opportunities. If there are no defects, then there is no way we can calculate the sigma level for a process.
-
Measles Chart or Defect location check sheet is used for collecting and analyzing data that provides visual image of the item being evaluated. Usually we collect data of number of defects in a process while working on any process improvement project. But this data has no information on where the defects are occurring in the process. We can use Measles chart for this purpose. Example: Let's consider example of a plastic chair manufacturing in a company. Instead of just collecting number of defects in the product, we can collect data on location of the defect identified in the product. We can draw the picture of the product and mark the location every time where the defect was found. The cluster of marking helps us to identify if root cause of the defect by evaluating up=stream processes.