PriyankaBose
Members
-
Joined
-
Last visited
Everything posted by PriyankaBose
-
What is Way of Working (WoW)? Way of Working (WoW) refers to the specific practices, methodologies, and approaches that define how work is carried out within an organization. It encompasses processes, tools, principles, and cultural norms that guide employees in their day-to-day activities and decision-making processes. It encompasses various aspects depending on the organization's industry, size, and objectives, include (but not limited to): 1. Processes and procedures: WoW outlines the standardized processes and procedures that govern how tasks and activities are executed within the organization. It provides clarity on the steps to be followed, roles and responsibilities, and the sequence of activities involved in delivering products or services. 2. Methodologies and frameworks: WoW may incorporate specific methodologies, frameworks, or approaches that are used to accomplish work efficiently and effectively. Examples include project management methodologies, agile practices, Lean principles, Six Sigma, or any other recognized process improvement frameworks. 3. Tools and technologies: WoW defines the tools, software, and technologies that are utilized to support work processes and enhance productivity. These may include project management software, collaboration platforms, data analytics tools, or any other technology that facilitates work execution and communication. 4. Communication and collaboration: WoW includes guidelines and practices for effective communication and collaboration among team members, departments, and stakeholders. It outlines channels of communication, reporting structures, meetings, and other means to foster effective information sharing and collaboration. 5. Performance metrics and measurement: WoW establishes the performance metrics, key performance indicators (KPIs), and targets that are used to measure progress and assess the success of work processes. It defines the criteria for evaluating performance and provides a basis for continuous monitoring, analysis, and improvement. 6. Training and skill development: WoW may encompass training programs and initiatives aimed at developing the skills and competencies necessary for employees to perform their work effectively. It includes training on specific tools, methodologies, or other relevant areas that contribute to the overall work processes. 7. Continuous improvement practices: WoW encourages a culture of continuous improvement by incorporating practices such as regular review, analysis, and feedback loops. It promotes a mindset of seeking opportunities for improvement, learning from mistakes, and implementing changes to enhance processes and outcomes. The goal of establishing a well-defined Way of Working (WoW) is to create consistency, efficiency, and effectiveness in how work is conducted throughout the organization. It provides a common understanding of expectations, processes, and outcomes, enabling employees to align their efforts and collaborate more effectively. By having a clearly defined Which phase of DMAIC is this most closely related to? In the context of process improvement methodologies, "Way of Working" (WoW) is not a specific term or phase within the DMAIC framework. However, while the Way of Working (WoW) is not explicitly associated with a specific phase of DMAIC, it refers to the overall approach, methodologies, and practices that an organization follows to conduct its work/ processes. It includes the standard operating procedures, guidelines, and cultural norms that shape how work is carried out in organisations. A strong WoW aligns with the principles of continuous improvement and can support the DMAIC framework by providing a structured and disciplined way of conducting process improvement projects. Hence, WoW is may be looked at as closely related to the Improve phase of the DMAIC framework. The Improve phase focuses on identifying and implementing solutions to address the root causes of process inefficiencies and deviations from desired performance. How does it help create a culture of continuous improvement in an organization? It is evident that WoW helps create a culture of continuous improvement in an organization in several ways: · Standardization: WoW promotes the standardization of processes and procedures, ensuring consistency and reliability in how work is performed. This allows for easier identification of areas for improvement and comparison of performance across different teams or units. · Collaboration: WoW encourages collaboration and cross-functional cooperation. By establishing clear communication channels and fostering teamwork, employees can share knowledge, insights, and best practices, leading to more effective problem-solving and continuous learning. · Data-Driven Decision Making: WoW emphasizes the use of data and metrics to drive decision making. It encourages employees to collect and analyse relevant data to identify trends, patterns, and areas of improvement. This data-driven approach enables more informed decision making and helps prioritize improvement initiatives based on their potential impact. · Continuous Learning and Experimentation: WoW supports a mindset of continuous learning and experimentation. It encourages employees to be open to new ideas, try out innovative approaches, and learn from both successes and failures. This iterative process allows for continuous improvement and adaptation to changing circumstances. · Employee Empowerment: WoW empowers employees by giving them the necessary tools, knowledge, and authority to make improvements in their own work areas. This sense of ownership and empowerment fosters engagement and motivation, as employees feel empowered to contribute to the organization's overall improvement efforts. Outcome Establishing a culture of continuous improvement through a well-defined Way of Working (WoW), organizations can expect to, · Foster a mindset of improvement: A clear WoW that emphasizes continuous improvement helps employees understand that seeking ways to enhance processes and outcomes is an integral part of their work. It encourages them to constantly question the status quo and look for opportunities to make incremental or breakthrough improvements. · Encourage collaboration and knowledge sharing: An effective WoW promotes collaboration among employees, enabling them to share best practices, lessons learned, and innovative ideas. This exchange of knowledge and experiences enhances problem-solving capabilities and accelerates improvement efforts across the organization. · Standardize processes and reduce variability: A well-defined WoW includes standardized processes and procedures that promote consistency and reduce process variability. This standardization enables better control over operations, easier identification of deviations, and opportunities for improvement. · Emphasize data-driven decision-making: A strong WoW encourages the use of data and metrics to drive decision-making. It promotes the collection, analysis, and interpretation of data to identify trends, root causes, and improvement opportunities. This data-driven approach enhances the accuracy and effectiveness of decision-making, leading to more impactful improvements. · Empower employees: An effective WoW empowers employees by providing them with the necessary tools, resources, and authority to contribute to process improvement initiatives. It encourages them to take ownership of their work, experiment with new ideas, and contribute to a culture of continuous learning and growth. Overall, WoW helps create a culture where continuous improvement becomes ingrained in the organization's DNA. It promotes a proactive approach to problem-solving, a focus on efficiency and quality, and a willingness to challenge the status quo. By embedding these principles into the organization's way of working, it becomes a natural part of the organizational culture and leads to sustained improvements over time. Conclusion: While WoW and DMAIC are not directly correlated, organizations can leverage a strong WoW to support the DMAIC framework and create a culture of continuous improvement.
-
The lean framework recognizes seven types of waste, which include Transport, Inventory, Motion, Waiting, Overproduction, Overprocessing, and Defects (TIMWOOD). Although motion and transportation share some similarities, distinguishing between them is straightforward. Transportation Waste Motion Waste Resulting from unnecessary movement of "things” between process steps and spaces, such as tools, inventory, products, and/ or information. Resulting from unnecessary movement of people that do not add value to the product or the process, such as such as walking, lifting, reaching, bending, stretching, and moving. unnecessary movement of things and people due to poor planning, can cause avoidable work, exhaustion, damage, and time lost. may result in machine wear-and-tear and product defects, and this can also lead to wasted time during the process. may lead to worker exhaustion, negatively affecting their productivity, morale, work quality, and this can also lead to wasted time during the process. Examples resulting in Transportation Waste: In office settings, examples of transportation wastes may include excessive or unnecessary movement of workers or employees within a facility or office space. In manufacturing setup, examples of transportation wastes may include relocating equipment from one construction site to another, returning excess inventory to a warehouse, inefficient floor planning of different teams coordinating on tasks. Examples resulting in Motion Waste: In office settings, examples of motion wastes may include employees searching for files, walking between desk to communicate with colleagues or to the supervisor's office frequently to obtain answers to queries or seek approval. Within manufacturing units, instances of motion waste might consist of repetitive activities that fail to enhance customer value, obtaining materials, walking to retrieve tools or materials, and making adjustments to components after installation. Mitigating wastes Effective value stream mapping can help in reducing both these forms of wastes. Countermeasures to address transportation waste, measures can be taken such as introducing a U-shaped production line, refraining from over-producing work in process (WIP) items, and sending surplus stock to outlet store locations.Top of Form Countermeasures for motion may include placing equipment near the production location, and putting materials at an ergonomic position to reduce stretching and straining, redesigned workspaces to enhance the work efficiency and quality of the workforce while emphasizing on health and safety levels.
-
Sensitivity Analysis Sensitivity analysis is a powerful tool that can be used to predict how changes in the values of independent variables may impact a dependent variable. Sensitivity analysis can be utilised across different case uses, from biology, geography, and engineering to economics and financial modelling. Tornado Chart A tornado chart is a graphical tool used to visualize the sensitivity of an outcome to changes in identified input (test) variables. Note that, a tornado chart is typically used to understand the impact of an individual input variable/ assumption (keeping everything else constant) at a time, and test how sensitive the output is to the change in this input variable. For instance, sensitivity analysis can be used in a tornado chart to study the effect of a change in share price if the revenues were to increase or decrease by 5%. The chart below illustrates the range of impact created on the share price (outcome) with an increase (+5%) / decrease (-5%) in different input variables. Tornado charts are created using a stacked bar chart where input variable categories are displayed vertically (instead of the commonly used - horizontal way). Each bar in the chart below illustrates the range of effects on the output (share price) by changing individual input variable (+5% to -5%), keeping all the other input variables at their initial (base level) values. Sorting the output of impact in order of most impactful to least impactful creates a final chart with a shape that resembles either a half or a complete tornado cone, hence, commonly called the ‘Tornado Chart’. The top bars would hence represent the variables that contribute the most to the variability of the outcome (with highest upside to downside range impact on the outcome), and thereby indicating what matters the most, where is the upside and where are the risks. Chart source: corporatefinanceinstitute.com

-
Robotic process automation Robotic process automation (RPA) is a form of business process automation technology that uses software robots to automate and mimic tasks that are typically performed by humans. RPA can be used to automate repetitive, rule-based processes, such as invoicing, data entry, creating reports, and/ or claims processing. Intelligent process automation Intelligent process automation (IPA) takes things a step further by utilizing the application of AI (artificial intelligence), ML (machine learning), NLP (natural language processing), Computer Vision, Cognitive automation, and related technologies, to automate processes with complexities and variations. Needless to say, this convergence of technologies produces automation capabilities that have a significant impact on business value and competitive advantages for customers. IPA = RPA + DPA + AI The three primary technologies that are used in IPA are Digital Process Automation (DPA), Robotic Process Automation (RPA), and Artificial Intelligence (AI). IPA robots are constantly learning and growing smarter after every task they complete. This gives them an ever-growing list of potential tasks and processes to automate, making them more intelligent with every new task. This added intelligence can create transformation across the full spectrum of emerging technologies. Used Case Example: Invoice Automation RPA robots can help organizations by taking on various roles and repetitive tasks virtually, including those that are typically carried out by human employees. While RPA can automate data input, reconciliation error correction, and some decision-making for invoice processing. However, the challenge arises when trying to deal with the many different formats that vendors use for their invoices. This is where IPA can contribute - by using NLP and other machine learning techniques to understand and extract the necessary data from invoices, normalize it to a structured format, and then send it back to the RPA platform for automated data input, error handling, and so on. By combining Robotic Process Automation (RPA) and Artificial Intelligence (AI), bots will be able to scan, digitize, and validate essential data from purchase orders to generate invoices. RPA Vs. IPA RPA is excellent at automating simple and straightforward tasks, and therefore RPA is most widely used for automating repetitive tasks that are carried out the same way each time, with minimal variation. RPA is rules-based and applies instructions set by humans to perform a particular task - for example, sending an automatic reply to an email; while it lacks any form or sense of intelligence, adaptability, and/or cognitive functioning; and operates in a linear arrangement aka. the human operator needs to have designated inputs and outputs which doesn't allow for much flexibility or scope for variability. In contrast, IPA is used for more complex end-to-end processes. IPA is a more efficient and intelligent option when it comes down to choosing between the two. This is because IPA automates more processes than RPA. Not to mention, IPA can structure data, handle exceptions, and variations and learn over time - meaning the automation is of much higher quality, can handle higher complexities in the process, and hence saves more money in the long run. However, it must be kept in mind that IPA comes with its own set of challenges, due to the sheer nature of technology augmentation and deployment/ integration along with other organisation-wide legacy softwares.
-
The Takt Time, Cycle Time, and the OEE are extremely core to lean manufacturing, aimed at eliminating wastes, maximizing the productivity of a production process, and thereby reducing the duration within the production process and the overall lead time. Takt Time Takt time is the required rate of production to match the demand or the maximum acceptable time to meet the demands of the customer. Cycle Time Cycle time is the actual rate of production or in other words, it is the amount of time it takes to complete a specific task from start to finish. OEE (Overall Equipment Effectiveness) OEE is a measure of the efficiency of a manufacturing operation as compared to its full potential. By this understanding, given the OEE and Takt time (required rate of production), the Target Cycle time can be derived. An Example: Given that the required production rate is 1,000 units per day with 10 hours per day production time (or 36,000 seconds). This gives a Takt time of 36 seconds per unit (36,000 secs/ 1,000 parts per day). Also, given the measured OEE is 75%, then a (Target) Cycle time of 27 seconds per unit (36 seconds x 75%) will be required to ensure a Takt Time of 36 seconds per unit.
-
The most critical role of a product manager is the have a product with the essential features and/or functionalities ready when required. While all the features and/or functionalities cannot be supplied at the same time, the need for undertaking a complex decision of prioritizing these features and/or functionalities present in a product backlog – one of another, becomes imperative. There are several prioritization models utilized by product and project teams. One of which is the Weighted Shortest Job First (WSJF) and the Cost of Delay (CoD), which is a prioritization model used to sequence jobs (eg. Features, Capabilities, and Epics) to minimize costs and produce maximum economic benefit at the end of a sprint. This is a thoroughly effective tool to simplify the prioritization initiatives and is part of the SAFe framework. The basic assumption in this method is that any feature that is not delivered on time has a cost – the “Cost of Delay.” Poor prioritization, therefore, will lead to the multiplication of these costs. The WSJF will be calculated for each feature to determine priority scores (higher score equals higher priority). This model utilizes the following four criteria for each feature/ functionality, on a nonlinear increasing scale, based on the Fibonacci sequence. User-Business Value of the feature (eg. very high for all key functions of the application). Criticality (or Urgency) Reduction of risks/ease in developing another Size of feature/task (effort and time to be provided by the development team for realization) * * Generally evaluated by the development team WSJF = (Cost of Delay) / (Size of Task) Where, Cost of Delay (CoD) = User-Business Value + Time Criticality + Risk Reduction and/or Opportunity Enablement To understand the deduction and implications of the formula a little deeper, we have, Value = Increase Revenue + Protect Revenue + Reduce Cost + Avoid Cost ð Value = User-Business Value + Risk Reduction and/or Opportunity Enablement Hence, the Cost of Delay can be understood as a function of Value and Time Criticality/ Urgency. WSJF is particularly useful when the product owner has to decide between two similar features (in terms of value and development time), which feature should be developed first. Source: https://www.scaledagileframework.com/wsjf/ A Comparative Assessment of WSFJ and other Product Prioritization Frameworks The method prioritizes smaller (Small Job Size) and high-Value tasks, which incentivizes users to break down jobs into smaller batches. WSJF is one of the most comprehensive and quantitative methods (minimizes personal biases, which may otherwise be present in a qualitative approach) of prioritization that allows for both mature and new products & MVPs. The frameworks were categorized based on two key criteria viz., X-Axis: The degree to inputs to the method are highly qualitative or quantitative Y-Axis: The level of end-user validation required on the method inputs* viz. if the method includes evaluation of the “customer value” by the involvement of the customer or end-user to validate the score Source: https://uxdesign.cc/how-to-choose-your-product-prioritization-framework-ff0320d63ebf


-
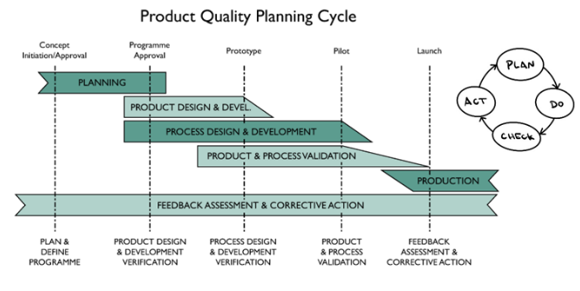
If you’re not from the automotive industry, then you’ve most certainly not heard of the APQP before, and perhaps, you’re curious to delve into the answer to the question. Brief History APQP: Developed by the Ford Motor Company, that published the first Advanced Quality Planning handbook for suppliers in the 1980’s. DFSS: Developed in the 1980’s by Motorola and became popular worldwide from there. APQP is a quality framework for developing new products, evolved from and typically utilized in the automotive industry. Having said that, APQP can be applied to any industry and is similar to DFSS in many ways. However, let’s understand how they’re different. DFSS APQP PRIMARY GOAL To reduce defects and deliver high quality products that fulfil customer needs. PRIMARY GOAL To mitigating possibilities of risks or failure during the entire life cycle, while delivering high quality and competitive products that fulfil customer needs. APPLICATIONS Largely used across industries (basic engineering, process industries, waste management, and electronics) and functions (finance, marketing). o Designing or re-designing a New Process, Product or Service from the scratch. o Replacement of a current product/ process that needs complete re-design or has reached redundancy APPLICATIONS Typically utilized in the automotive industry can be applied to any industry. o Designing or re-designing New Process or Product o Change/ replace a current in Product or Process o Continuous Improvement of Product /Processes FRAMEWORK o Utilizes the DMADV cycle to determine the needs of customers and then design a solution to meet those needs. Picture source: https://www.pwc.com/ FRAMEWORK o Utilises the PDCA cycle across 5 NPD phases, also referred to as the Product Quality Planning Cycle. Picture source: https://www.vhancevalencia.com/posts/six-sigma-frameworks TOOLS & TECHNIQUES o Requires tools such as QFD, FMEA, TRIZ, Design for X, DOE, Taguchi methods, etc. TOOLS & TECHNIQUES o Requires the use of quality tools, such as FMEA, MSA, SPC, PPAP. SCOPE o Largely a design scope and internal to an organisation. o Limited to a single organisation with cross functional collaboration o Highly focused on customer needs and specifications to deliver high value product/ services. SCOPE o Largely a scope across the entire product lifecycle viz. design conceptualisation to production and development of comprehensive control plans. o Intended to aggregate goals and planning activities of suppliers across the product development value chain into a single process and program. o An end-to end scope essentially scaled across functions, the entire value chain (viz. the company and its suppliers) o Implementation is not regulatory requirement, the expected process Sigma level for a product or service should be no less than 4.5 (can even be 6 or higher depending the product) Mandatory implementation requirement for Tier I automotive suppliers (APQP process standards are published, controlled and maintained by the AIAG) As mentioned above, while DFSS is has laser focus on designing, APQP is a much larger scope and scale; hence the application of DFSS methodology in APQP makes it more aligned to overall product planning and goals that are measurable and robust.
-
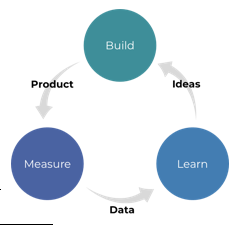
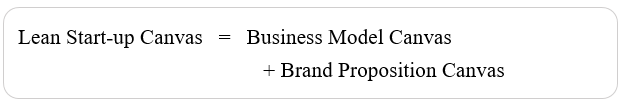
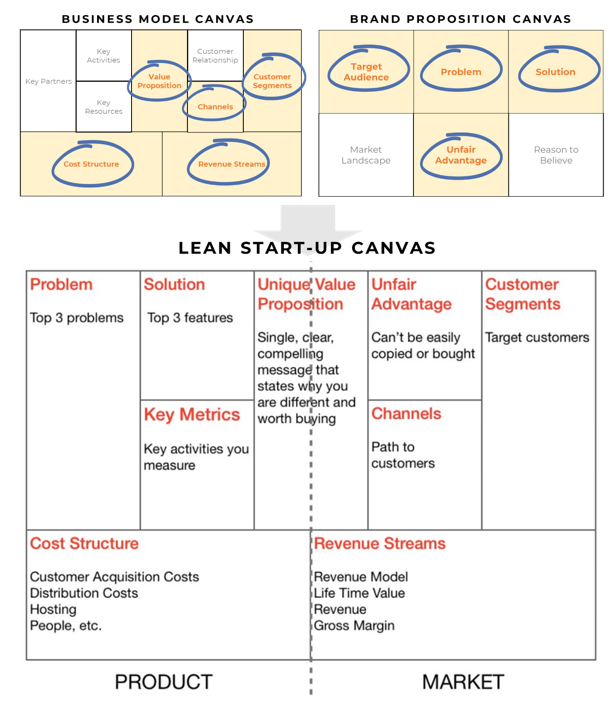
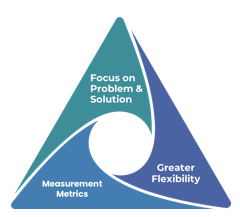
One of the primary requirements for a start-up to be successful, is to have an innovative or disruptive idea that will witness sizable market adoption. However, when they start, founders have no idea, whether their idea will actually gain any market acceptance at all. Founders and companies spend months and sometimes even years in building a perfect a product / service, to eventually learn that customers don’t even want that specific feature, or USP, or quite often than not, the product all together. This is the problem that the lean start-up solves. The Lean Start-up The lean start-up is an approach to build companies and launch products quicker, that are in-sync with customer needs. It was proposed in 2008 by Eric Ries (also the author of the book “The Lean Start-up”), with his entrepreneurial learnings from adapting customer focused development and lean practices to technology start-ups. As the name suggest, the lean start-up evolved from the lean management framework of continuous and iterative improvement through Plan Do Check Act (PDCA) cycle. Lean Principals in a Lean Start-up Testing before Investing The lean start-up demonstrates the importance of iteratively development, and involves building an MVP (Minimum Viable Product), viz. a version of the product that has just enough features to be released for testing and feedback from early customers. This approach essentially limits the exposure to associated market and financial risks, by reducing and often eliminating the need for enormous capital investment in extensive product development and expensive product launches, for ideas that not even be accepted by the market. The lean approach is centered around the concept of agile development and aims to, o Shorten product development cycles o Rapidly validate the business model’s is viability o Build products are in sync is customer requirements and wants This is achieved by framework of hypothesis-driven experimentation, iterative product releases and validated learning. Customer Centric Approach + Flexibility + Rapid, Responsive Development The lean start-up emphasizes on a customer centricity, by that it follows a rapid development and validation through a consistent customer feedback methodology (rather than intuition), prioritizing flexible and iterative development, over stringent planning. Companies use these customer feedbacks to learn if and what in the products, do the customers want and don’t, and use these learnings for validation on whether to continue to build the product, pivot and/ or enhance some product features. The company continues this cycle called the Build, Measure, learn loop, also called the lean principles. This framework hence, enables recovery more often, vis-à-vis a full-fledged product deployment. The Lean Canvas The lean canvas was devised by Ash Maurya, that helps deconstruct and brainstorm ideas from their fundamental business assumptions. Adapted from Alex Osterwalder's Business Model Canvas and optimized for Lean Start-ups, the lean canvas a has striking, and rather tactical combination of the Business Model Canvas and Brand Proposition Canvas, keeping in sight the critical aspects of and symbiosis between both the product and the market. Lean Canvas in creation of a Lean Start-up While, traditional business model canvases offer a long-term view of the business with limited capabilities for performance measurement; Start-ups really need something that keeps them focussed on the fundamental elements and targets of the business. Lean canvas model on the other hand offers constant visibility to these elements, enhanced problem solving, iterative planning & flexibility and tools to monitor goal – performance measurement metrics, the lean canvas is instrumental to the success and growth start-ups and development business, both. The General Electric – Used Case General Electric is often cited as one of the most a successful example of a large organization demonstrating the power and potential of the lean start-up approach and principles (to read more follow the link: https://hbr.org/2014/04/how-ge-applies-lean-startup-practices) Lean canvas graphic source: https://medium.com/@steve_mullen/an-introduction-to-lean-canvas-5c17c469d3e0; References: https://yonderconsulting.com/3-examples-of-lean-startup/
-
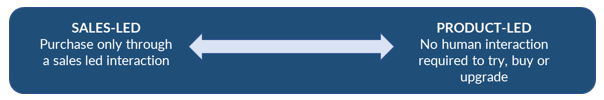
Imagine a product, so incredibly valuable – It does all the selling by itself. Ever used Zoom? Yes? So, how did you learn about Zoom? Advertisement? Banner? Sales email? That’s right, using the product itself got you acquainted to the value it brings, into the “sales” funnel, and then the product did rest of the selling. The most famous product-led success stories like Zoom, Dropbox and Calendly – all witnessed rapid growth, driven by an incredible market fit, stunning product adoption and retention. All that without any sales calls or emails to promote the product. How’s that? In a world of information overload, people control who they want to hear, see or read. And people – they love it when there’s no selling, no spamming. When it feels like a natural inclination to buy-in, when they see value before they pay; That’s when you’ve made a customer that sticks, and even more – spreads the word. Many organizations have their hopes on PLG, dreaming of becoming the next success product-led growth story. That said, there are quite a few reasons why companies can’t just switch to a product-led growth model, some of these reasons include: 1. No self-service 2. No free trial or freemium option 3. No ability to purchase online 4. Complex Pricing model 5. Complex product setup, usage and navigation Perhaps a sales-led approach would be more realistic for such products that fit the aforementioned criterions. Let’s understand what fits where and what works best for your product? PRODUCT- LED GROWTH (PLG) SALES- LED GROWTH (SLG) Suitable Candidates for PLG: Interest generated from the bottom of the funnel Instant Value creating products, leading to instant customer impact Product which is easy to understand, evaluate, adopt and integrate in existing workflows Easy to try and buy option Customer is decision maker and the end-user Suitable Candidates for SLG: Interest generated from the top of the funnel. Product where time to value is long Self-service is not available Suitable for products/ businesses with relatively smaller addressable market Complex product coupled with an enterprise sized client Customer and end-user may be different In initial phases of the product/ category, when your product is not fully established, hand holding customers becomes important. Advantages of PLG: Wider potential top of the funnel, with more customers who will have access to free-trial and/or freemium model (or if you’re offering free trials) Significantly lower customer acquisition cost (CAC) Instant the customer value and experience Increase customer retention and upsells Shorter sales cycle Higher potential for product virality Advantage of SLG: Traditional, yet proven and tested model to acquire enterprise customers Increased conversion rate and faster onboarding for complex products Ability to close high Lifetime Value (LTV) customers High level sales-end user engagement ensures easy learning of usage and relevant features. Customer specific customisation of the product/ solution Closer to customer, hence better access to customer feedbacks Disadvantages of PLG: ·Can only be utilised where product offers trial or freemium model Significant investment in product innovation, design and continuous improvement Disadvantages of SLG: Enormous investment in Sales and Marketing of the product The customer acquisition model is often leaky The organizational structure hinders product development SLG+PLG Approach Many of the successful product-led businesses have eventually integrated the traditional, tried and tested sales-led approach as they’ve have grown. This integration was essentially instrumental in · reaching out to those potential customers can could not have been reached via. product-led approach. · customer expansion such as upgrades, renewals, and allow you to target at an enterprise level. Both product-led and sales-led approaches have their prospects, time and place. Understanding when which works best and how to incorporate them together to bring the maximum value and experience to the customer is the key, because in the end, it’s the customer impact that really matters and drives long-term sustainable growth. References: https://productled.com/blog/product-led-vs-sales-led/, https://productled.com/blog/product-led-growth-definition/

-
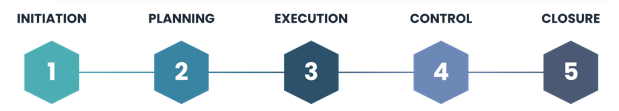
Project Management The word ‘project’ in itself indicates that project management involves completion/ delivery of specific project. Project management involves the planning, coordination and oversight of a specific outcome/ output led project, from beginning to end. Project management comprises 5 stages from Initiation to Completion (ref figure 1), which include defining the project charter, budget, timelines and objectives of the project Responsibilities of a project manager typically include the following: · Project scoping, scheduling and approvals · Resource & Budget management · Contingency management · Status reporting to stakeholders Projects are time-bound (generally short-term), and come with capital, time and/ or resource constraints, owing to which project management requires stronger tactical expertise, as it largely focuses on the operational and/ or executional aspects of the project such as delegating tasks, regular monitoring of the project progress to ensure meeting scheduled timelines, identifying and dealing with execution constraints and challenges while staying within budget. An example of project management would include development of a software that meets the pre-defined requirement, or construction of a residential apartment project within a specified budget and timeline. Program Management A program is a group of related projects managed in co-ordination together to obtain benefits, that may either not be available otherwise from individual projects and/or the collection of these projects together outweighs managing projects individually. In other words, a program is a large project, one that is made up several smaller inter-dependent projects bundled together in a single program. Program managers are strategic thinkers, who lead the end-to-end responsibility of the cross-functional program, from strategy to delivery of the set of desired outcomes on an on-going and evolving basis. Further, the objective of a program management office is focused on delivering for the company’s overarching goal and delivering higher stakeholder value. The program manager also has responsibility for: · Prioritizing and budgeting initiatives · Defining a cross-organizational roadmap · Ensuring resources capacity and availability · Managing interdependencies between projects · Ensuring program-level goals are achieved An example of program management would include a program comprising individual projects for development and testing of a software, launching it in market, building customer support infrastructure. Further, monitoring and reporting the performance of this software product on a continuous basis, throughout the various stages of the product lifecycle. PORTFOLIO MANAGEMENT: Portfolio management comprises the selection, prioritisation and control of an organisation's programs, in alignment with the organisation’s overall mission. The purpose of the portfolio management is to prioritise initiatives that propel the trajectory of the organisation towards its goals. Most often than not, portfolio management encompasses management of investments for optimising overall business returns and value. A portfolio manager is hence essentially responsible for prioritising investment decisions into various investments (viz. programs and projects), followed by executing investments on behalf of the organisation. An example of portfolio management would include investments into programs for various software products under the investments of the organisation. BROADLY, the difference may be summed up in the following table.