Jpiyush
Members
-
Joined
-
Last visited
Everything posted by Jpiyush
-
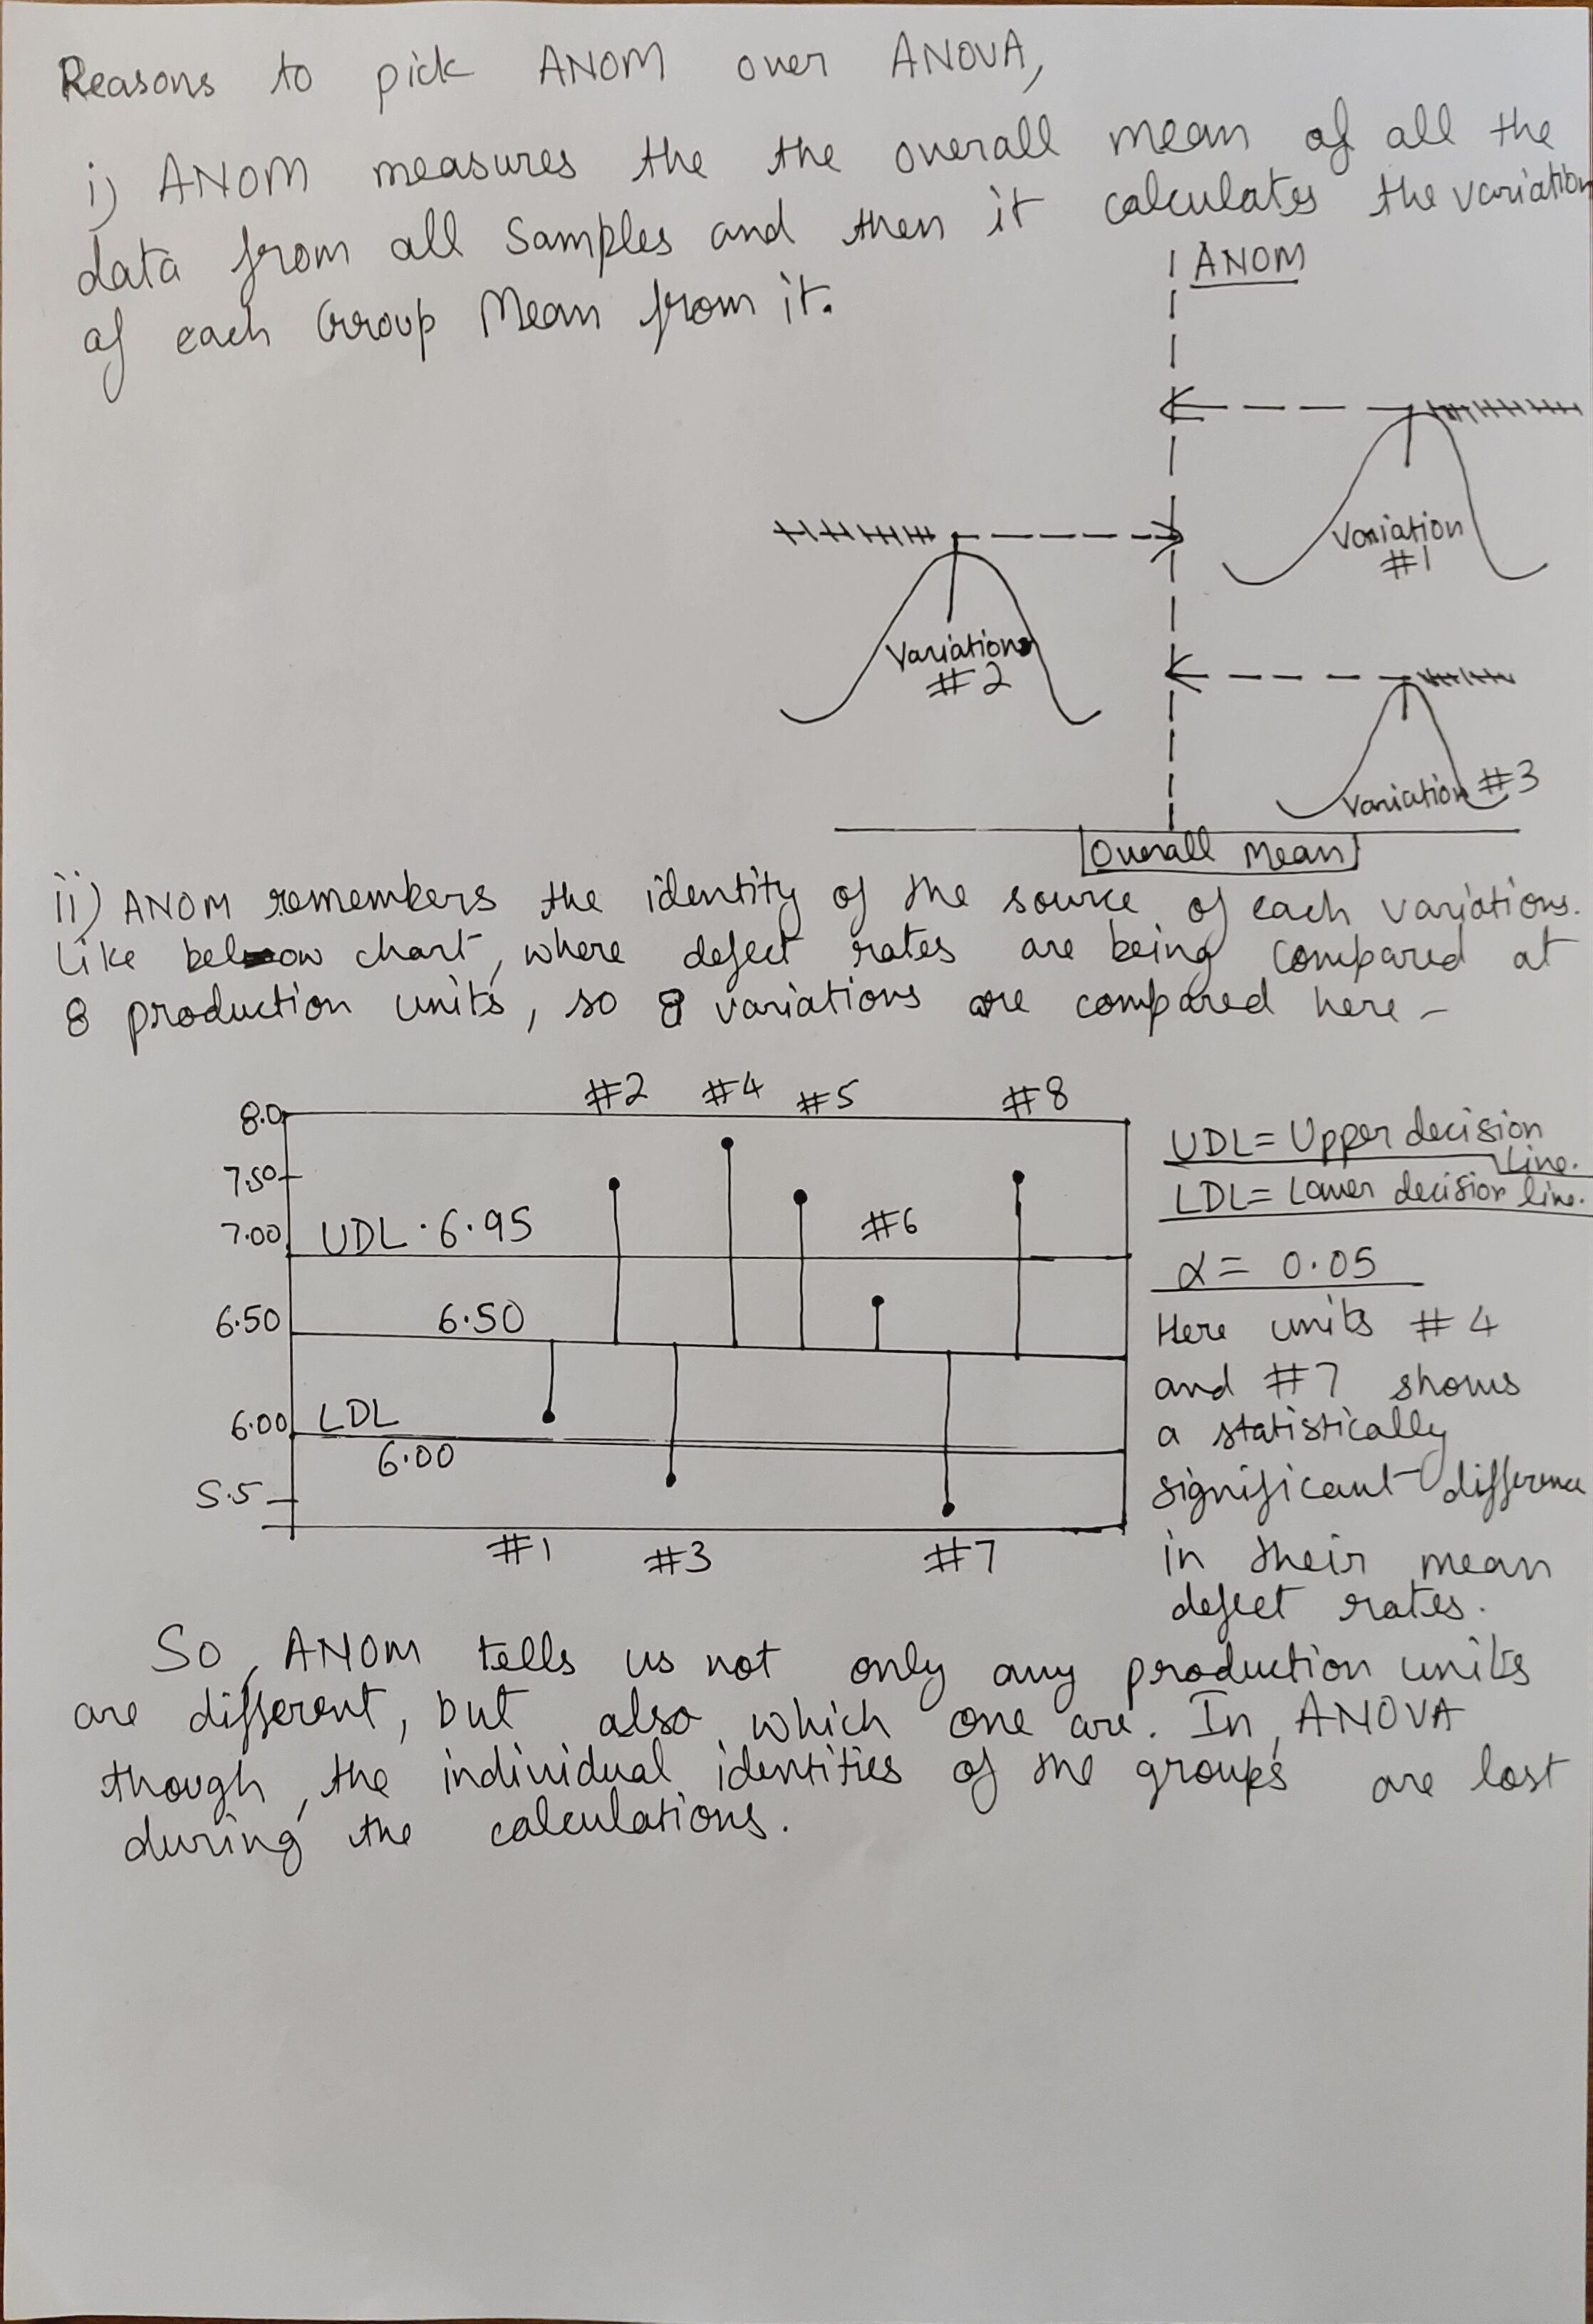
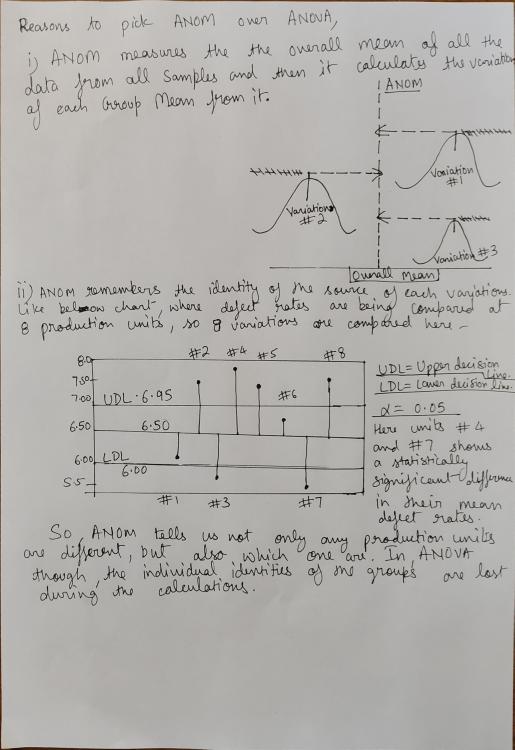
One- way Analysis of Variance(ANOVA) model is quite useful and adaptable statistical method for studying the relationship between response variable and one or further explicatory or predictor variables. In effect, ANOVA extends the two-sample t- test for testing the equivalency of two population means to a more general null hypothesis of comparing the equivalency of further than two means. ANOM or the Analysis of Means is a graphical system for presenting multiple group comparisons with an overall mean. ANOM has enjoyed great as help in quality control, and piles of extensions and operations have been bandied. The single- factor ANOVA and ANOM models are conversed and compared with each other using factual data. With the help Analysis of Variance( ANOVA) and Analysis of Means( ANOM), I'll illustrate the difference between the two analyses by answering “ which Football grounds are better for Forwards and which premises are better for Defenses? ” ANOVA and ANOM are analyses that use arbitrary samples from a population to generalize the sample results to a larger population. The null thesis for an ANOVA analysis is that the means of the comparison groups are each equal to each other. An ANOVA analysis frequently includes multiple comparisons. Multiple comparisons look at the differences between means of groups to determine which means are statistically different and by how important. The null thesis for ANOM is that all of the group means are equal to the mean of all of the data. However, also the null thesis of ANOVA is also true, If the null thesis for ANOM is true. It’s when we reject the null thesis that we find the difference in the logical pretensions. FOOTBALL STADIUM ANALYSIS# 1 USING ONE- WAY ANOVA I'm going to use a one- way ANOVA test. We can go indeed deeper into this kind of analysis by choosing particular comparisons of interest. Then we're comparing all of the football premises to the fields where the smallest pretensions were scored Old Trafford. The results over show which premises are better Scorers premises than Old Trafford. The list includes 19 premises , most specially BET365 colosseum in Staffordshire. The altitude in different is well- known for creating a terrain that’s good for Scorers. This ANOVA information is veritably useful. We can see the colosseums that are better strikers premises than Old Trafford and which premises are indistinguishable from the same. However, we could compare every field to every other field or every field to a single, chosen ground, If we did different sets of multiple comparisons. The difference between the groups is the key here. With ANOM, we answer a different question. What if we want to classify premises as Strikers favoring ground , neutral premises , and Defender's colosseums? The points on the graph are the mean Ground factors. The center line represents the overall mean. The outside lines are decision limits that show which premises are different from the overall mean. FOOTBALL STADIUM ANALYSIS# 2 USING ANOM Recall that rather of testing whether means are equal, ANOM tests whether the means are equal to the overall mean. Minitab can help with the graph depiction. You can follow this way with the same dataset to get the results. The points on the graph are the mean colosseum factors. The center line represents the overall mean. The outside lines are decision limits that show which premises are different from the overall mean. STATISTICAL ANALYSIS IMPROVES DECISION MAKING Using an analysis that answers the right question for your operation is crucial to making good opinions. See the differences among ANOVA and ANOM. In the ANOVA analysis, we got two orders • Indistinguishable from Old Trafford, Manchester. • More for Scoring premises than Old Trafford, Manchester. For ANOM, we get three orders • Lower than the overall mean • Indistinguishable from the overall mean • Advanced than the overall mean In the ANOVA analysis, London Stadium is indistinguishable from Old Trafford, so we'd tend to suppose of it as a demesne that favors songwriters. In the ANOM analysis, London colosseum is indistinguishable from the overall mean, so we'd suppose of it as a neutral demesne with respect to pretensions. In the ANOVA analysis, we saw that 19 premises were better for Strikers than Old Trafford. In the ANOM analysis, we saw that 4 premises were better for Strikers than the overall normal.
-
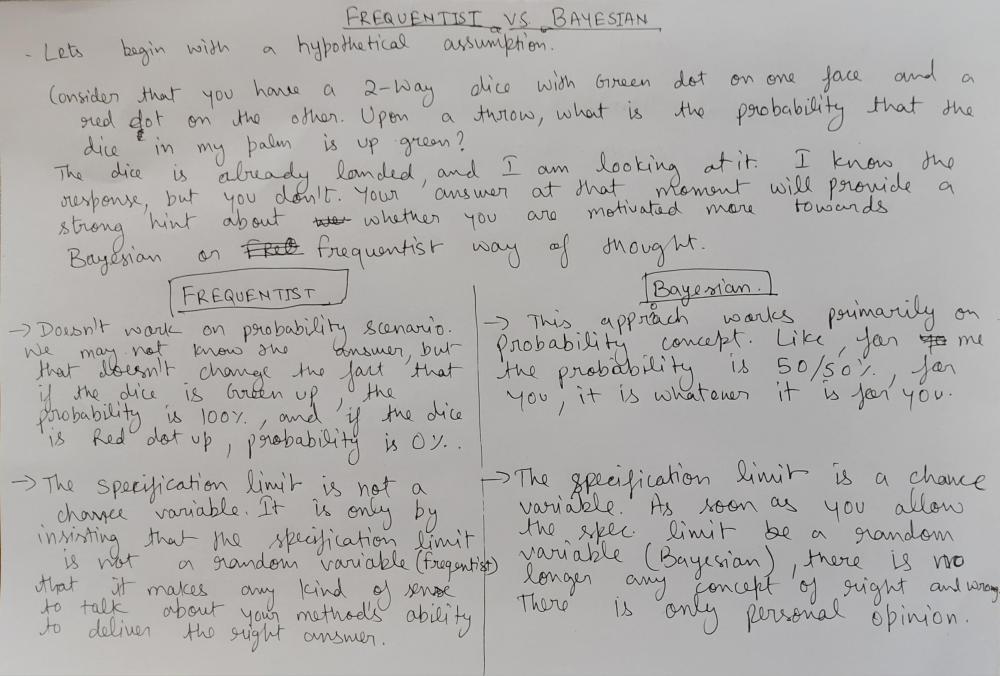
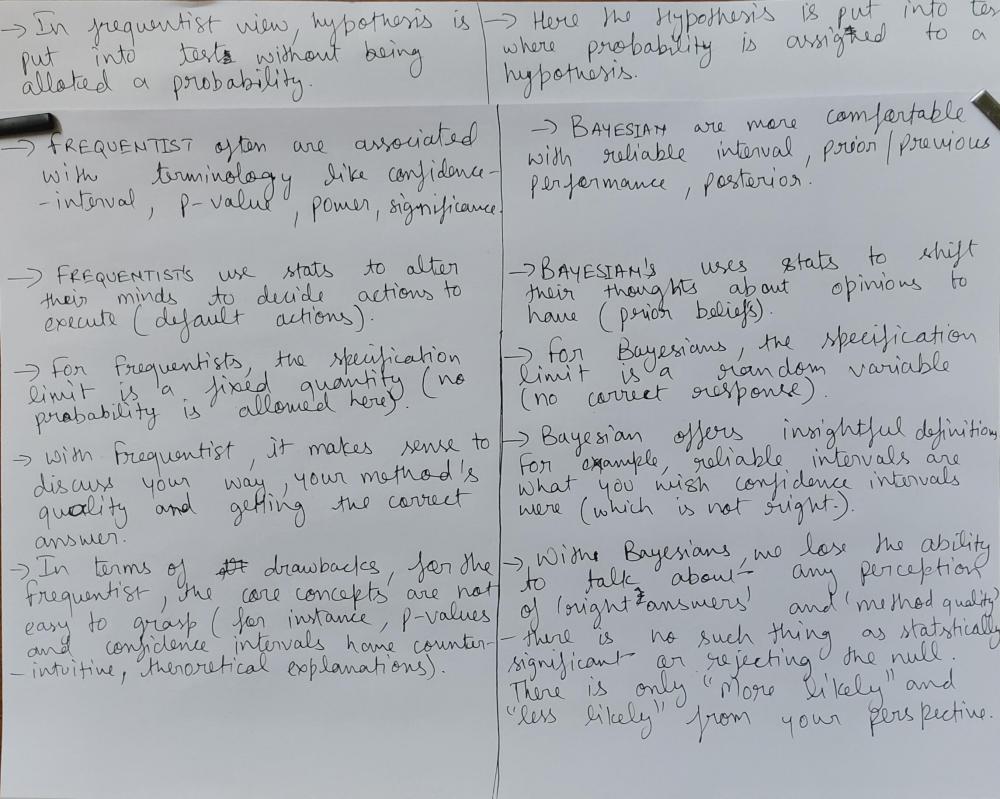
Frequentist statistics, which could also be described as experimental or inductive, rely on the law of observations. In a frequentist model, probability is the limit of the relative frequency of an event after numerous trials. In other words, this system calculates the probability that the trial would have the same issues if you were to replicate the same conditions again. This model only uses data from the current trial when assessing issues. When applying frequentist statistics or using a tool that uses a frequentist model, you'll presumably hear the term p- value. A p- value is the advised probability of carrying an effect at least as extreme as the one in your sample data, assuming the verity of the null thesis. For illustration, a small p- value means that there's a small chance that your results could be fully arbitrary. A large p- value means that your results have a high probability of being arbitrary and not due to anything you did in the trial. In short, flash reverse that the lower the p- value, the more statistically significant your results. Unfortunately, people constantly misinterpret what p- value represents. P- value is basically the probability of a false positive rested on the data in the trial. It doesn't tell you the probability of a specific event actually passing and it doesn't tell you the probability that a variant is better than the control. P- values are probability statements about the data sample not about the thesis itself. So if you ran an A/ B test where the conversion rate of the variant was 10 advanced than the conversion rate of the control, and this trial had a p- value of0.01 it would mean that the observed result is statistically significant. Bayesian statistics, which is theoretical/deductive, enables us to combine the information provided by data with a priori knowledge from previous studies or expert opinions Bayesian statistics are named after champion Thomas Bayes who believed that “probability is orderly opinion, and that conclusion from data is nothing other than the modification of similar opinion in the light of applicable new information. With Bayesian statistics, probability indicates a degree of belief in an event. This system is different from the frequentist methodology in several ways. One of the big differences is that probability expresses the chance of an event end. Although the computation can be extremely complex, this system seems to be a simpler and further intuitive approach for A/ B testing. fairly simply, a Bayesian methodology will tell you the probability that a variant is better than an original or vice versa. The Bayesian generality of probability is also further conditional. It uses former and posterior knowledge as well as current trial data to prognosticate issues. Since life doesn’t be in a vacuum, we constantly must make hypotheticals when running trials. But the Bayesian approach attempts to regard former knowledge and data that could impact the end results.
-
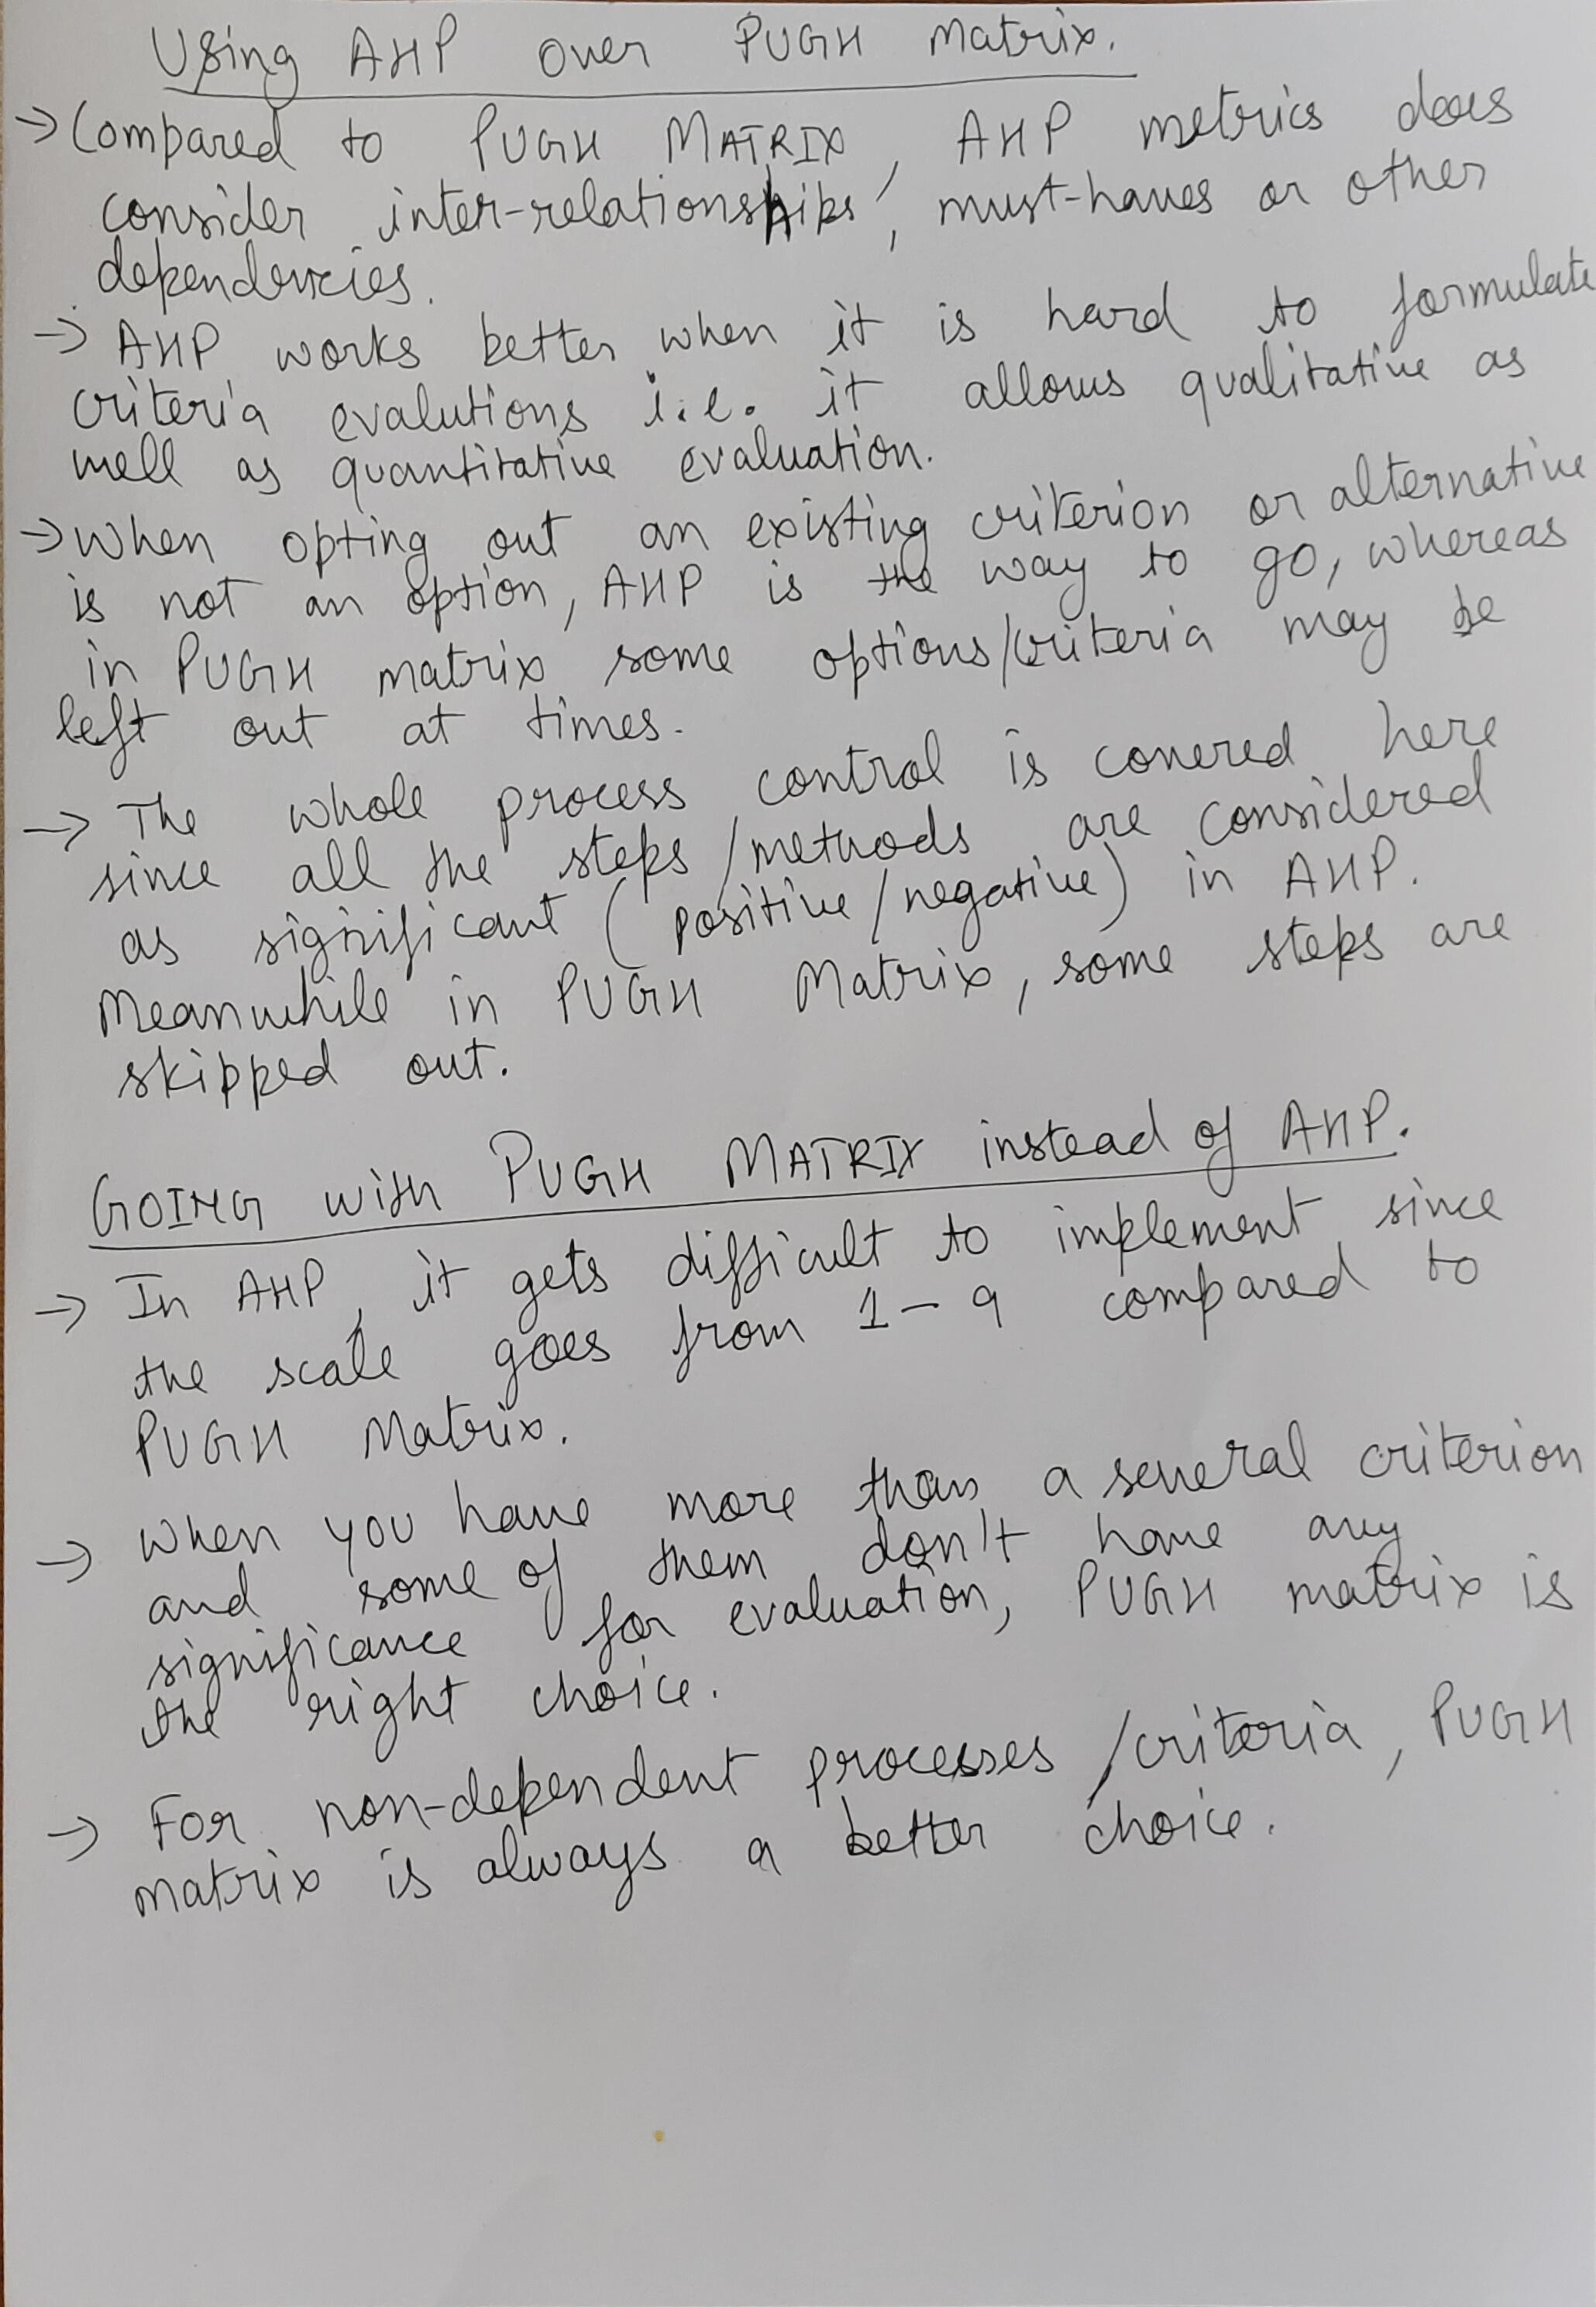
The Pugh Matrix is a criteria- grounded decision matrix which uses criteria scoring to determine which of several implicit results or options should be named. The fashion gets its name from Stuart Pugh and has come a standard part of Six Sigma methodology. It's generally used after the development of the VOC( Voice of the client) and after the creation of a QFD( Quality Function Design). The Pugh Matrix has some of other names as well, including Decision matrix/ grid Selection matrix/ grid Problem matrix occasion analysis Criteria standing form Criteria- grounded matrix The Pugh Matrix Allows the critic to organize colorful criteria( or features) of a result in a structured way for easy comparison Facilitates a team- based process for chastened conception generation and selection Allows the critic to develop a optimal result which is a mongrel of other strong results Sample Pugh Matrix The way for creating a Pugh Matrix are as follows · Identify applicable user demand or criteria. The illustration shows veritably general criteria. · Develop weights for each of the conditions. This is voluntary for weighting the scores. colorful weighting strategies can be used. · Induce several feasible options for a result. · Elect one of the options as a base. This is frequently a current state result. · Estimate each volition against the baseline scoring it as positive, negative or equal in meeting the criteria. · Total the values from each volition, multiplying each value by its weight if the voluntary scoring medium was used. · Combine the best candidates of each volition to produce an optimal hybrid result. Analytic Hierarchy Process The multi- criteria programming made through the use of the logical scale process is a fashion for decision making in complex surroundings in which numerous variables or criteria are considered in the prioritization and selection of preferences or systems. AHP was chased in the 1970s by T. Saaty and has been Extensively studied and is presently used in decision making for complex scripts, where people work together to make opinions when mortal comprehensions, judgments, and consequences have long- term impacts. The operation of AHP begins with a problem being perished into a scale of criteria to be more fluently anatomized and compared in an independent manner. After this logical scale is constructed, the decision makers can fully assess the preferences by making quintet comparisons for each of the chosen conditions. This comparison may use concrete data from the options or mortal judgments to input subjacent information (Saaty, 2008). Illustration of a Hierarchy of Criteria/ objects exhibition 2 – illustration of a Hierarchy of Criteria/ objects AHP transforms the comparisons, which are most constantly empirical, into numerical values that are farther reused and compared. The weight of each factor allows the assessment of each one of the principles inside the defined scale. This capability of converting empirical data into fine models is the main distinctive donation of the AHP fashion when varied with other comparing ways. After all the comparisons have been made, and the relative weights between each of the criteria to be estimated have been established, the numerical probability of each volition is calculated. This probability determines the liability that the volition must fulfill the awaited thing. The more advanced the probability, the better the chances the volition must satisfy the final thing of the portfolio. The fine computation involved in the AHP process may at first feel simple, but when dealing with further complex cases, the analyses and computations become deeper and more total.


-
A project/design artifact is the attestation a company produces that defines and supports a design's process. Artifacts generally relate to design operation and include documents, labors, specific deliverables, goals and templates. They help align systems with the objects of an organization, address the requirements of stakeholders and define a team’s prospects. Basic Artifacts include charters, client analyses and business cases. Management may frequently modernize artifacts to reflect changes in the compass of a design. 10 design artifact types 1. Strategy Artifacts Strategy Artifacts addresses attestation that relates to a project's inauguration. Creating these artifacts is generally the first step of a design, as they help guide a crew's work moving forward. These artifacts frequently remain the same throughout an entire design. Common strategy artifacts include design proposals, charters, vision statements and roadmaps. These documents define crucial rudiments of a design similar as its description, compass, resources, schedule and liabilities. These artifacts are created in Define phase of a DMAIC project. 2. Communication plan An effective squad working on a design frequently creates a communication plan to agree on appropriate and effective ways to convey significant information. For illustration, they can develop strategies to communicate effectively about discussions, issues, document reviews, access to deliverables and the status of a design. A group generally creates their communication plan at the startup of a design/project. This plan is again used mostly in Define phase of a DMAIC project. 3. Logs and registers This artifact relate to design operation logs and registers that project group members dissect daily, as it helps them to measure a design's process and determine their tasks for a particular day. Logs and registers include risk registers, supposition logs, backlogs and stakeholder registers. This part is used in Measure phase mostly. 4. Release specifications A project team uses release specifications to test raw particulars , units in development and end products. These specifications allow a group to measure the showing of a product before its use or release. Release specifications generally include vision statements and evaluation criteria, while vision statements frequently include the contract between a inventor and a buyer. Evaluation criteria refers to the conditions operation labor force may use to determine whether a design met its pretensions. This is again used Measure phase mostly. 5. General plans Another important design artifact is plans that directors develop to determine how they can optimally insure a design's progression and effectiveness. This artifact may be in one or several documents and include both textual and visual rudiments. You may encounter general plans related to logistics, quality, releases, compass operation, replication and tests while working on a design. Analyse phase is where this is mostly utilized. 6. Reports Effective design operation also frequently involves a series of reports. Some typical reports may cover the quality, status and pitfalls of a design. Another piece of attestation that you may include in this order of design vestiges is formal records for stakeholder use. Analyse and Improve phase is where these reports are being used. 7. Grading charts Grading/Hierarchy maps describe the connections between different corridor of a design in detailed sections. They include breakdown structures of work processes, association, products and pitfalls. Depending on the design you are completing, a head may produce variety of options of each breakdown at a slow or fast pace or forget certain Grading maps. You might consider evolving on these vestiges constantly. These are associated with Define, Improve and Control phases. 8. Visual data and information This order refers to anything that a director might not consider to be a traditional document. This includes inflow maps, dashboards, traceability matrices and velocity maps. Visual data sources can make it easier for a group to understand information about a design. A project manager may provide visual information sources after they complete data analysis and use tools to modernize them automatically. This step is utilized in Control phase. 9. Baseline These represent approved performances of the plan to which they relate. For instance, these include budgets, scope , corner schedules and performance dimension . A project manager generally creates and updates these metrics throughout a design's duration. Again, this is mainly used during Control phase. 10. Agreements and contracts This order refers to any fairly binding agreements that apply to a design. Some systems include contracts, while others may not bear the use of these types of documents. Fixed price contracts, time and refund contracts and cost payment contracts are all common agreements you might encounter while working on a design. This is applicable to Define and maybe measure phase. The 5 Phases for Project Artifacts are as follows, Initiating Planning Executing Monitor and Closing Closing Here is a brief breakdown.

-
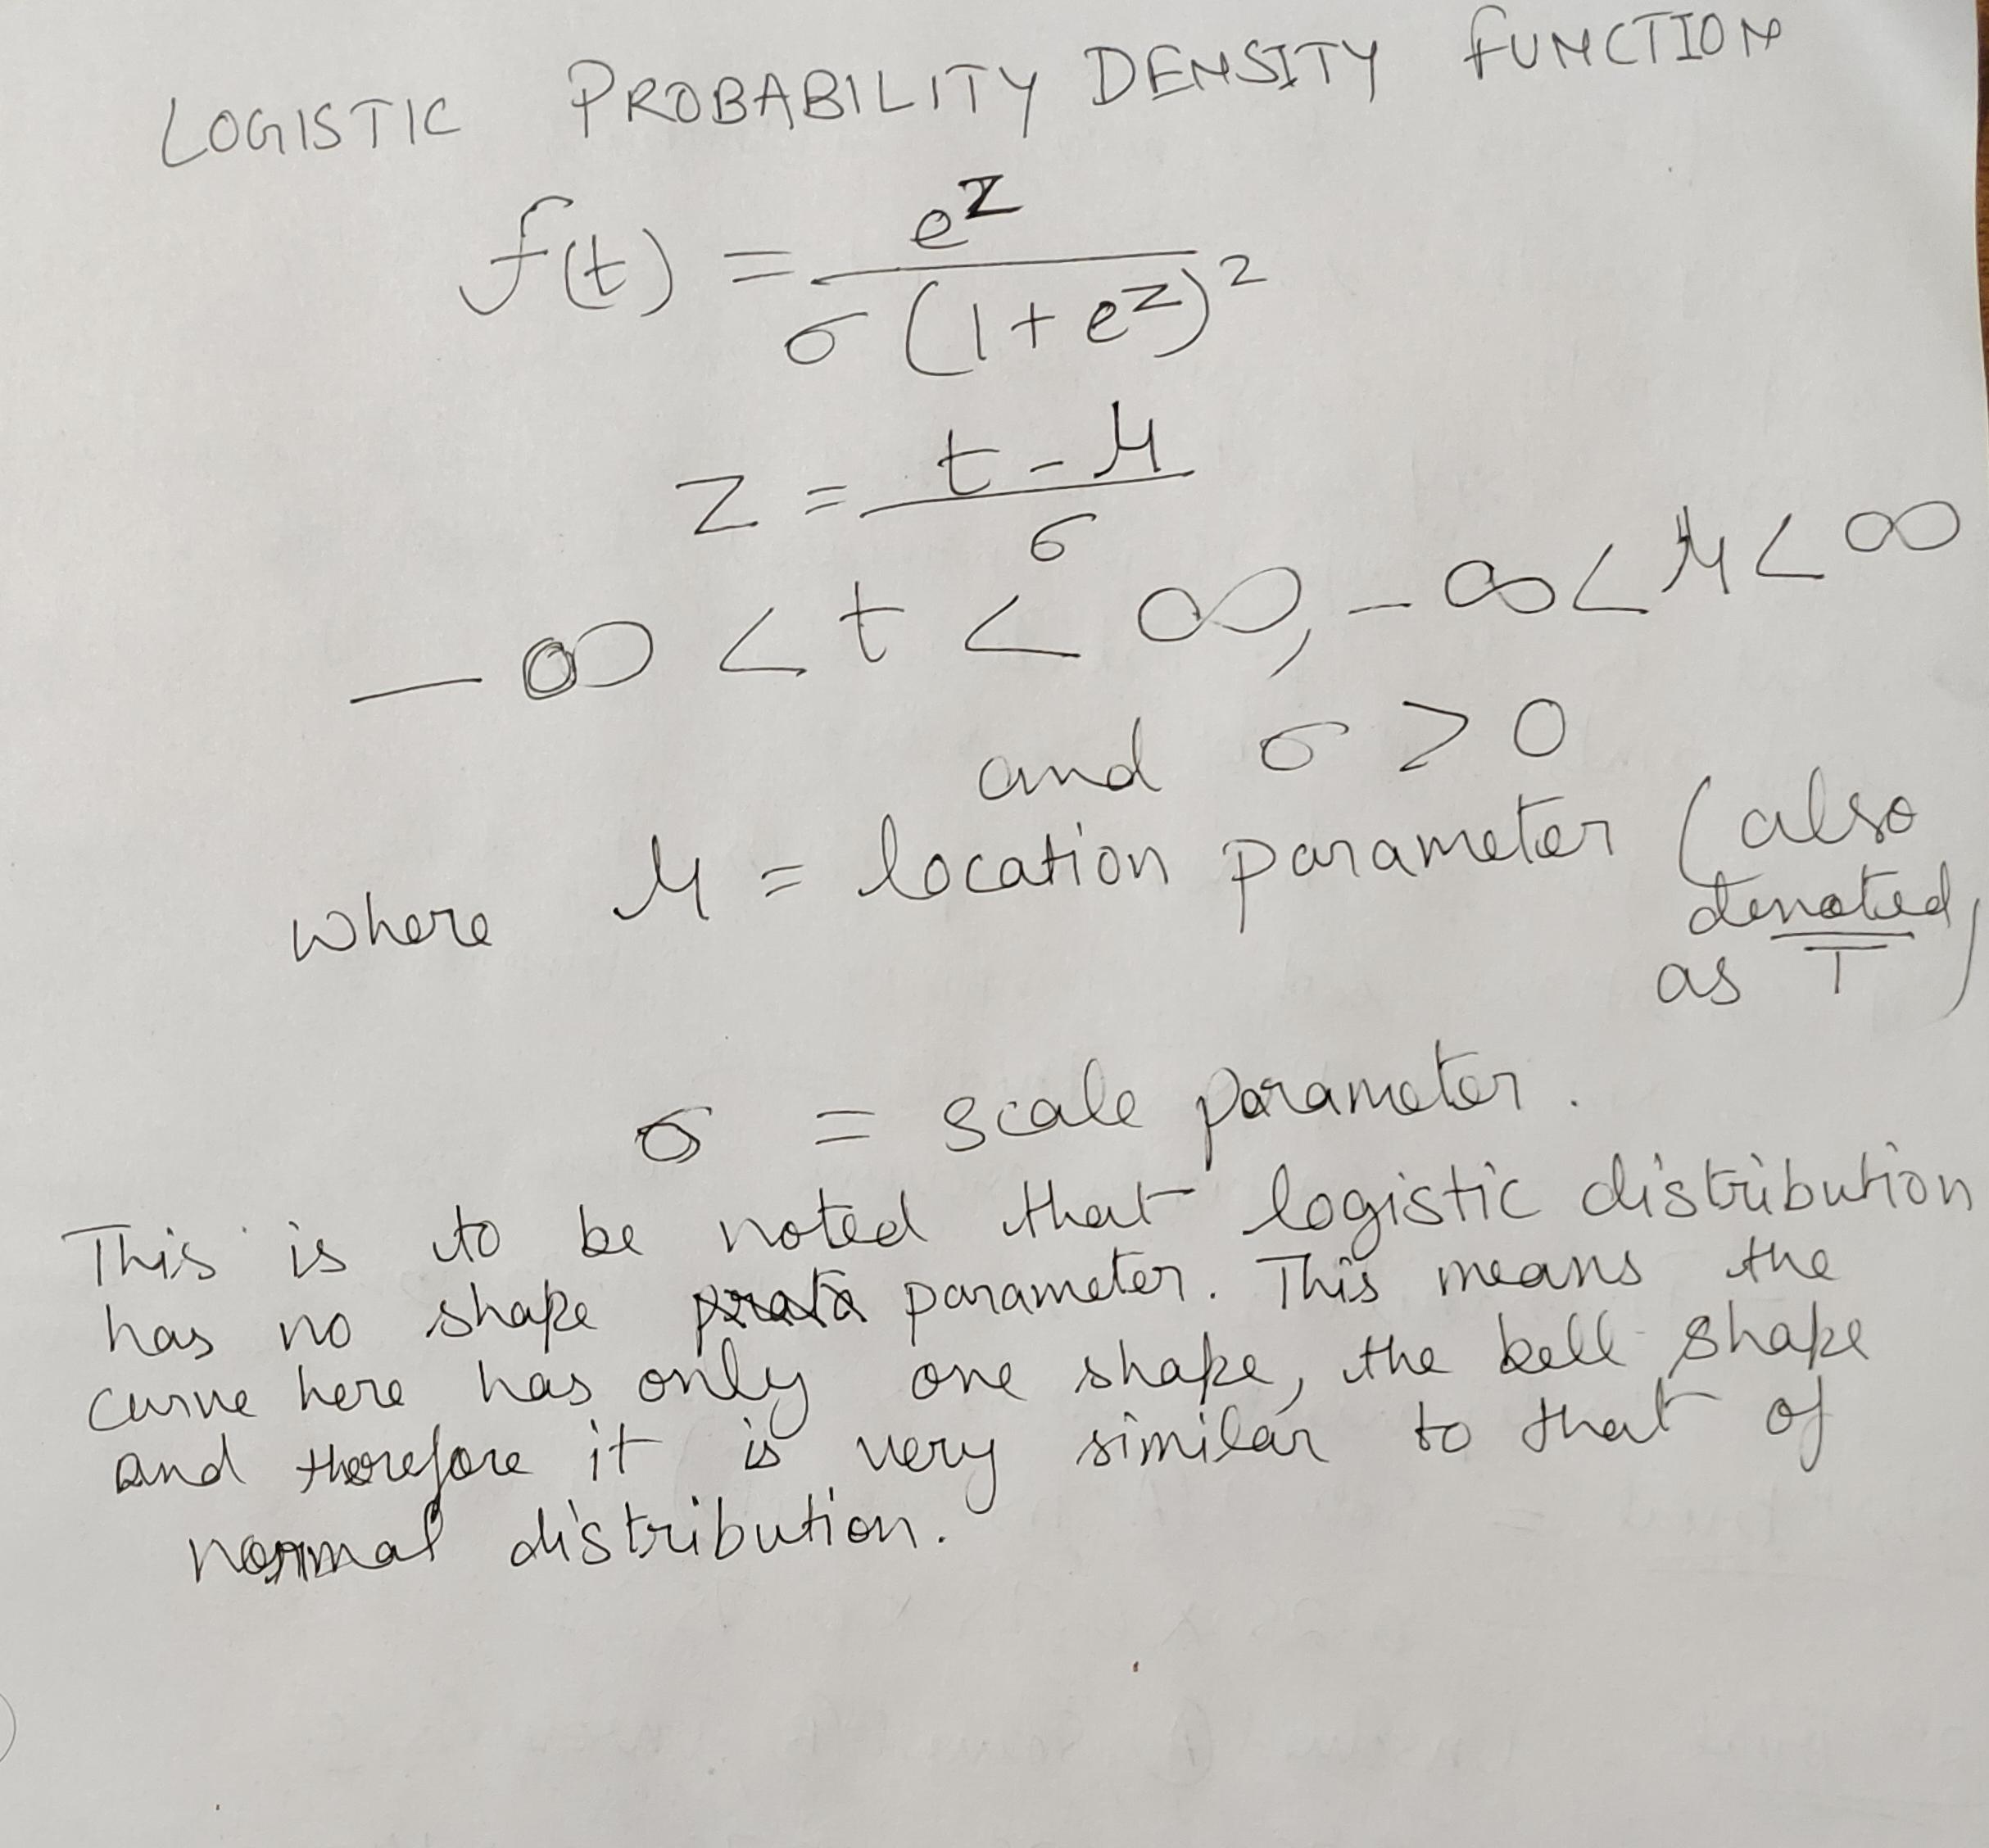
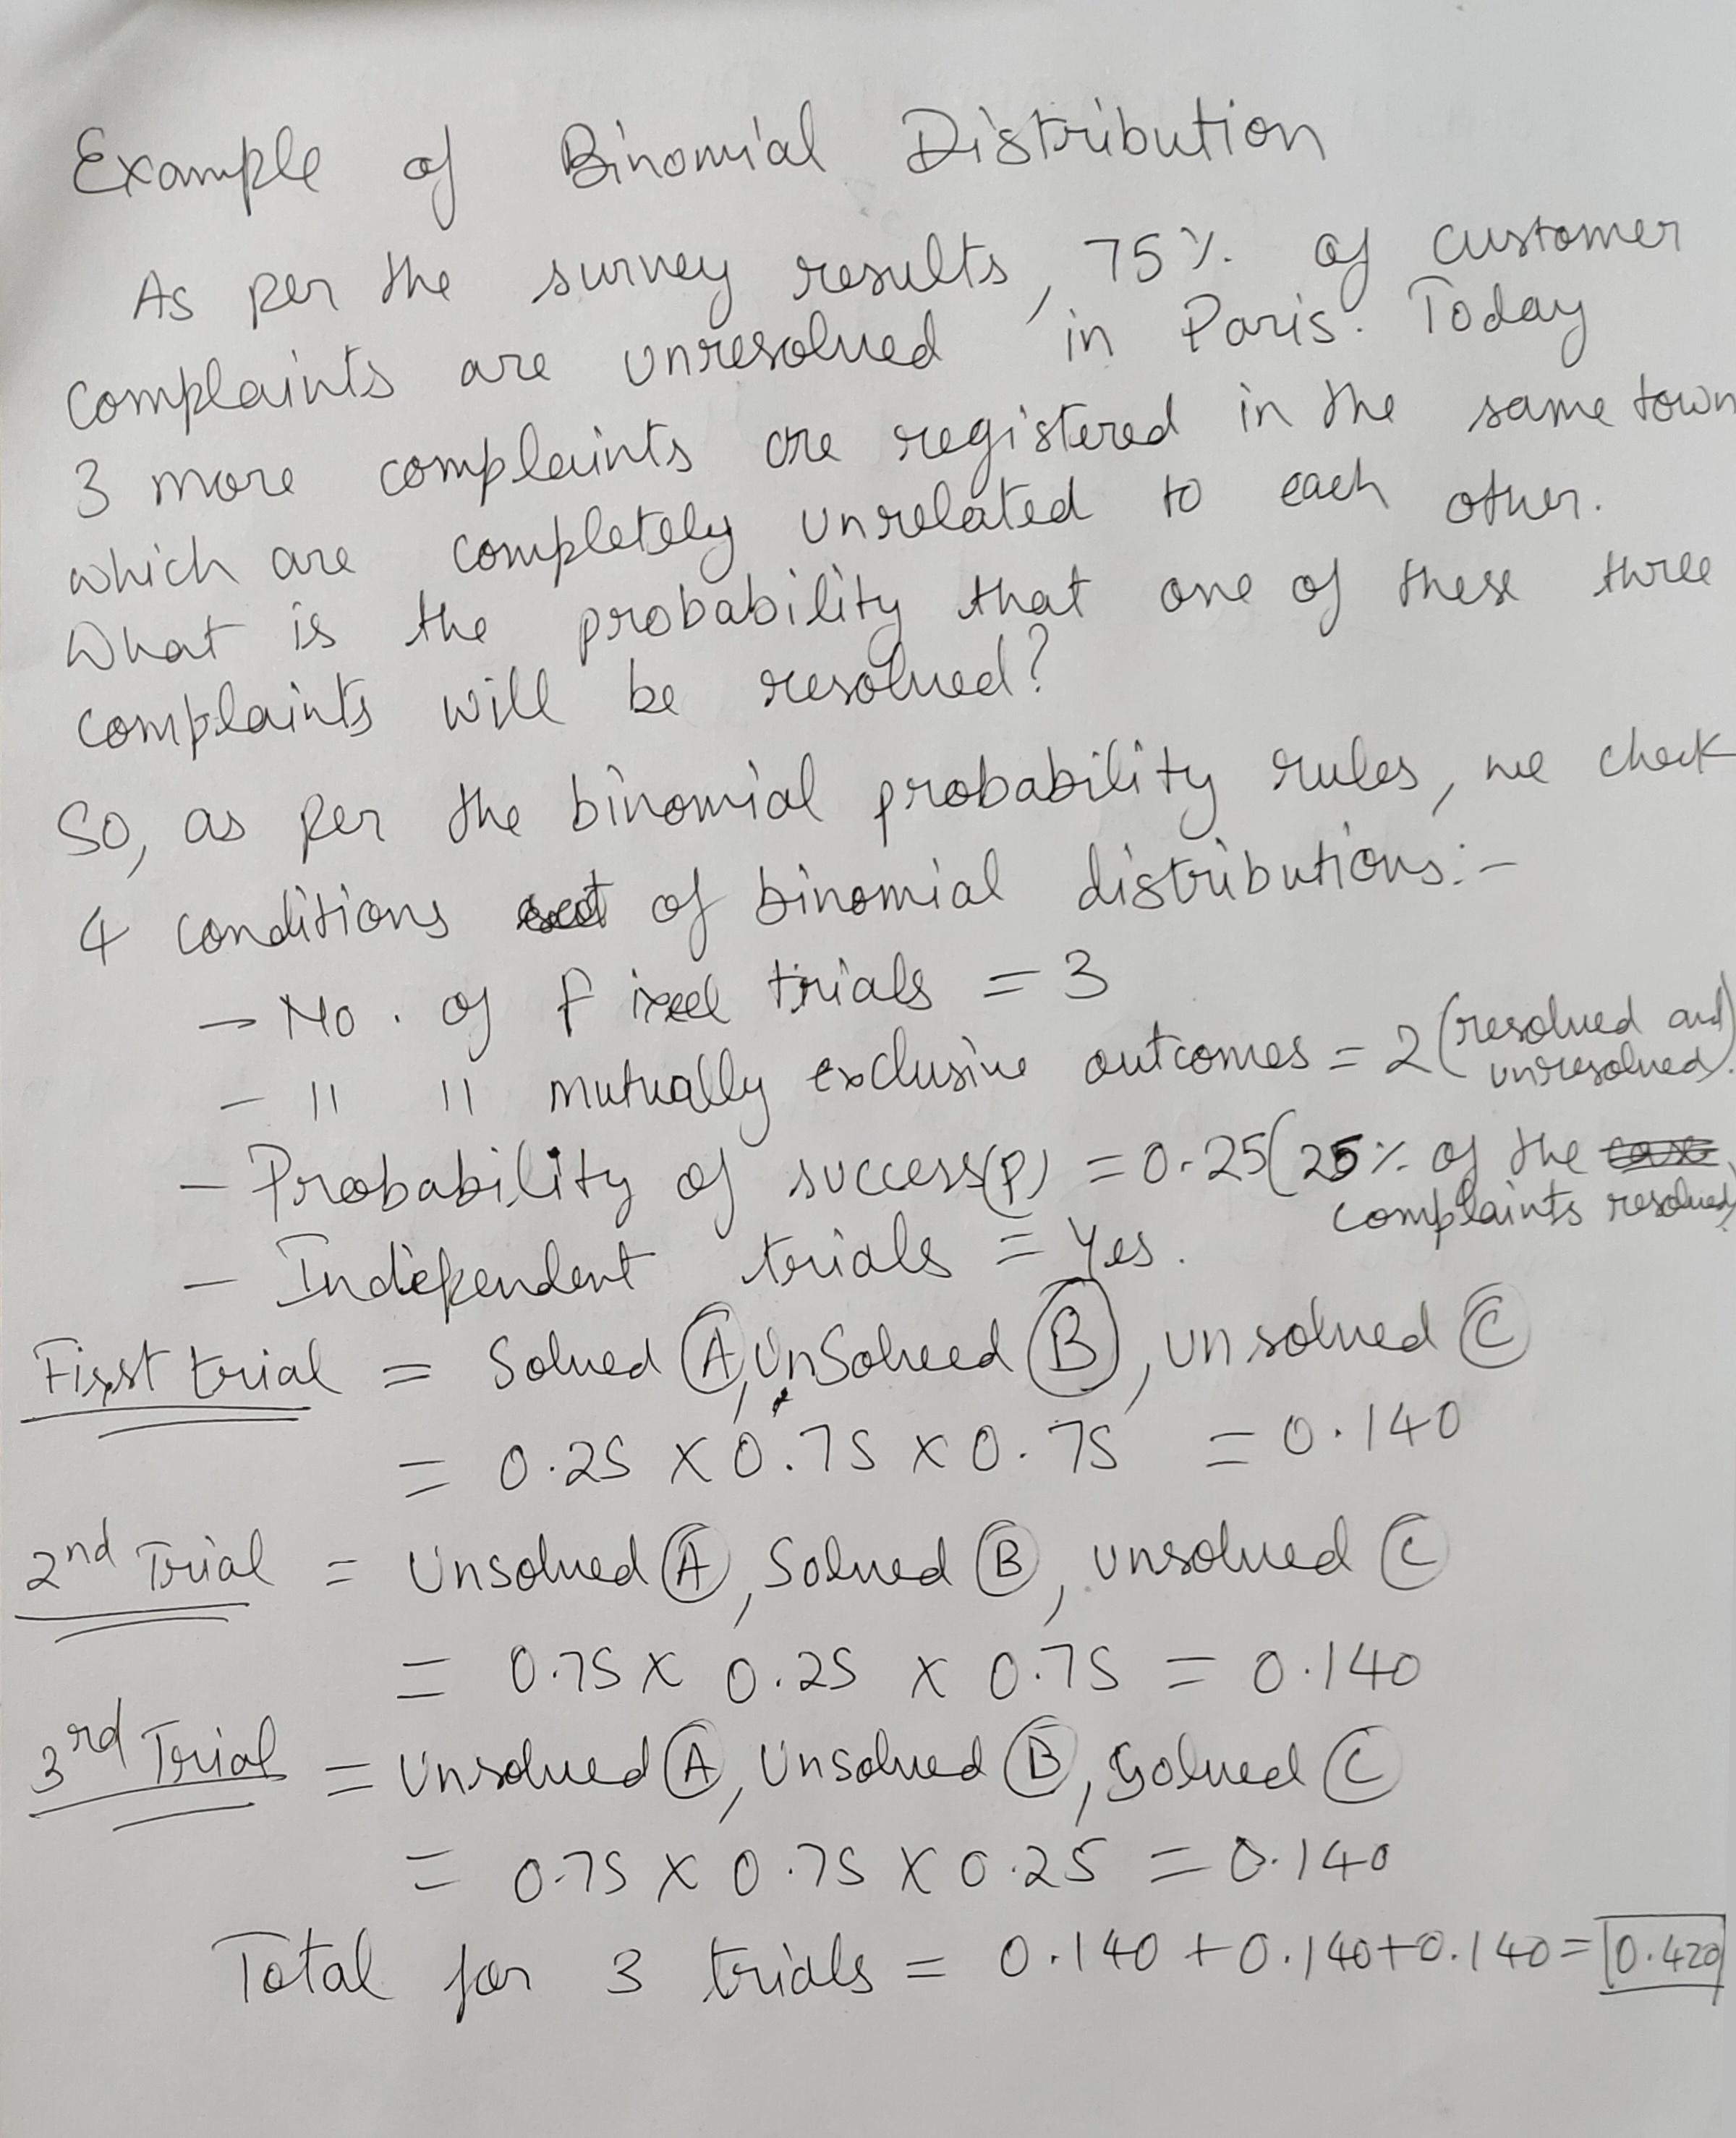
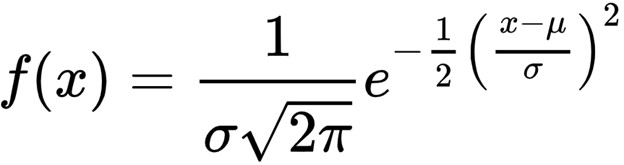
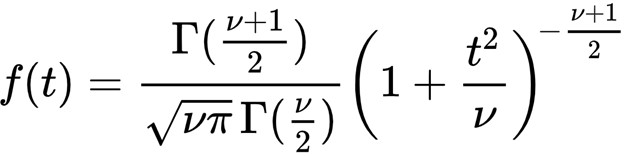
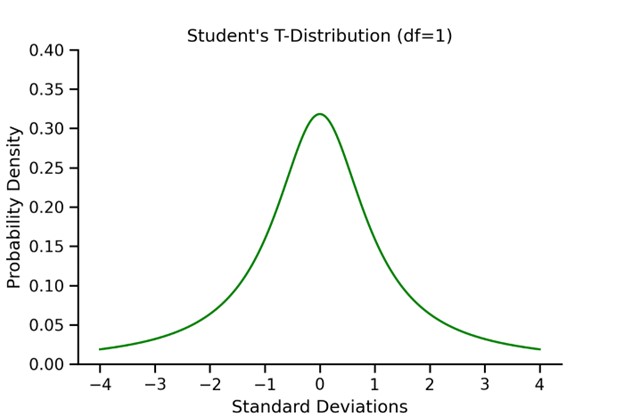
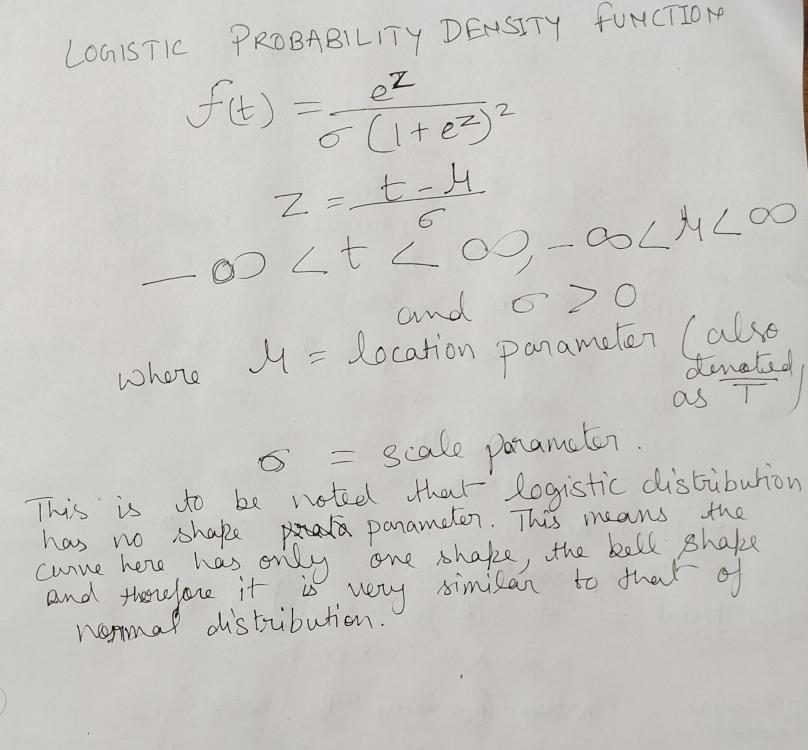
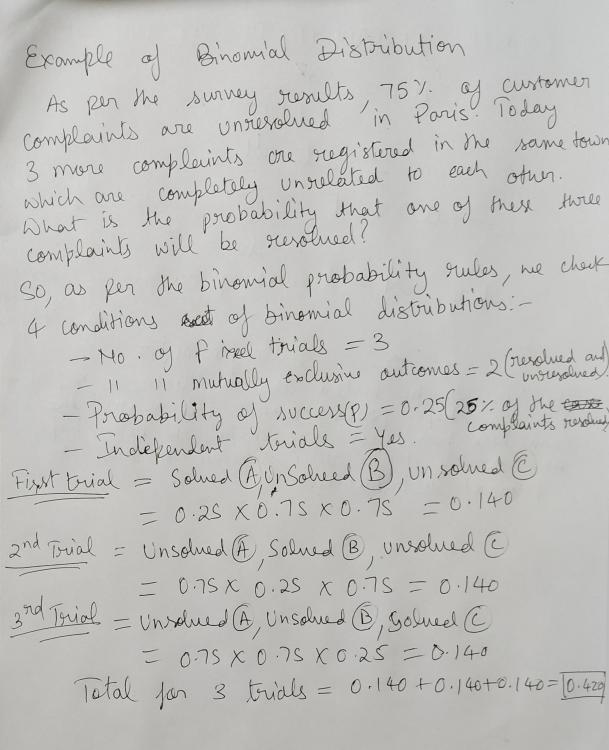
Student’s t- distribution is occasionally used over the normal distribution. numerous introductory statistics and data wisdom courses give a explanation for the use of t- distributions along the lines of it being useful in situations where either the sample size is small and/ or the population’s standard divagation is unknown. While correct, the explanation remains abstracted through such an explanation and learners may achieve a more important understanding through a clear and simple visualization. The Normal Distribution The normal distribution, also occasionally appertained to as a bell wind, is one of the most constantly used distributions and frequently the starting point for learning about distributions in general due to its relative simplicity. Given a mean( μ) and standard divagation( σ), a normal distribution can be modeled with the following probability viscosity function The probability viscosity function for a normal distribution Student’s T- Distribution The t- distribution is analogous to the normal distribution in numerous ways but doesn't assume knowledge of the population mean and standard divagation the way the normal distribution does. The probability viscosity function of the t- distribution is as follows, where Γ represents the gamma function and ν represents the degrees of freedom The probability viscosity function for Student’s t- distribution Importantly, the degrees of freedom, calculated as one lower than the sample size in utmost situations, has a large impact on the shape of the distribution at lower values. Let’s fantasize a t- distribution with a single degree of freedom. A Visual Comparison Now that we ’ve seen both the standard normal distribution and a t- distribution with a single degree of freedom, let’s plot them together to see how they compare. Major Differences With only a single degree of freedom, the t- distribution is important flatter and has fatter tails than the standard normal distribution. The power of the t- distribution comes from its capability to acclimate for lower sample sizes(and thus less degrees of freedom) by effectively having a more conservative estimate of probability viscosity. At advanced degrees of freedom, the t- distribution approximates the normal distribution, making it useful at both small and large sample sizes. The vitality below shows a comparison between the t- distribution and the normal distribution at degrees of freedom ranging from 1 to 50. SO, not only does Student’s t- distribution not bear information regarding the population mean and standard deviation (which are infrequently known in real world trials), but it also has increased inflexibility at colorful sample sizes. These parcels make it much more seductive to use over the normal distribution in utmost cases. Logistic vs Normal Distribution The logistic and normal distributions have a relatively analogous shape. still, the logistic distribution has heavier tails, which frequently increases the robustness of analyses grounded on it compared with using the normal distribution. The distribution has operations in trustability and survival analysis. The accretive distribution function has been used for modelling growth functions and as a forbearance distribution in the analysis of double data, leading to the extensively used logit model. The logistic distribution has been used for growth models and is used in a certain type of regression known as the logistic regression. It has also operations in modeling life data. The shape of the logistic distribution and the normal distribution are veritably analogous. There are some who argue that the logistic distribution is not a good fit for modeling continuance data because the left- hand limit of the distribution extends to negative perpetuity. This could possibly affect in modeling negative times- to- failure. still, handed that the distribution in question has a fairly high mean and a fairly small position parameter, the issue of negative failure times shouldn't present itself as a problem. Difference between Binomial vs Normal Distribution 1) The main difference between the binomial and normal distributions is that the binomial distribution is a separate distribution whereas the normal distribution is a nonstop distribution. This means that a binomial arbitrary variable can only take integer values similar as 1, 2, 3,etc. whereas the normal variable can take any real number value similar as1.2 or2.314,etc. 2) The alternate difference between them is that a binomial arbitrary variable has a finite range whereas the normal distribution has an horizonless range. A binomial arbitrary variable can only take finitely numerous values 1, 2,., n. On the other hand, a normal arbitrary variable can take any value between minus perpetuity to plus perpetuity, and thus its range is unbounded. 3) The binomial distribution is limited in its operations. It's only used in situations where a trial can have only two possible issues – success or failure. For illustration, when tossing a coin numerous times we use the binomial distribution to calculate chances (since tossing a coin has only two issues – heads or tails). On the other hand, the normal distribution finds numerous operations in real- life situations similar as modelling the height or weight distribution of a population. The normal distribution can in fact be used to calculate chances for binomial distribution using the system of the normal approximation to binomial.


-
Analysis of Variance (ANOVA) , a statistical system that is employed to check if the means of two or farther groups are significantly different from each other. ANOVA checks the influence of one or farther features by comparing the mean of different trials. Some of the basic terms used more often in Anova are briefly explained below, Hypothesis A thesis is a refined guess about commodity in any process around us. It should be testable either by trial or observation. Like any other kind of thesis used in statistics, ANOVA also uses a Null hypothesis & an Alternate hypothesis. The Null hypothesis in ANOVA is accepted when all means are equal. therefore, they can be counted as a part of a larger set of the crowd. Whereas the alternate hypothesis is only respectable when at least one of the sample means differs from the rest of the means. In mathematical form, they can be represented as: where belong to any two sample means out of all the samples considered for the test. Between Group Variability When samples differ from each other by a big periphery, their individual means would also differ. The difference between the individual means and grand mean would thus also be significant. similar variability between the distributions called Between- group variability. It refers to variations between the distributions of individual groups( or situations) as the values within each group are different. We can measure BGV the same way we calculate the standard deviation. If given the sample means and Grand mean, we can calculate it as: We also want to consider each squared deviation by the size of the sample. In other words, a deviation is given higher weight if it is from a larger sample set. Within Group Variability As the spread(variability) of each sample is increased, their distributions lap and they come part of a big population. Let’s consider another distribution of the same three samples but with lower variability. Although the means of samples are analogous to the samples in the below image, they feel to belong to different populations. Such variations within a sample are denoted by Within- group variation. It refers to variations caused by differences within individual groups (or situations) as all the values within the group are varying. Each sample is looked at on its own and variability between the individual points in the sample is calculated. In other words, no relations between samples are considered. Types of Anova Tests - There are three types of ANOVA tests 1 – One Way ANOVA --One way ANOVA analysis of friction is generally called a one- factor test in relation to the dependent subject and independent variable. While being used my statisticians for comparing the means of groups independent of each other using the Analysis of Variance measure formula. A single independent variable with at least two situations. The one way Analysis of Variance is relatively analogous to the t- test. 2 – Two Way ANOVA-- The pre-requisite for conducting a two- way Anova test is the presence of two independent variables; we can perform it in two ways – Two way ANOVA with replication or repeated measures analysis of friction – is done when the two independent groups with dependent variables do different tasks. Two-way ANOVA without replication – is done when one has a single group that they've to double test like one tests a player before and after a basketball game. Also, we must meet the ensuing conditions for its applicability:- · The population should be near normal distribution. · All samples should be independent. · Dissonances of the population have to be equal. · There should be an equal- sized sample in the group. 3 - N- Way ANOVA- It applies to multiple variables that affect the dependent variable.


- 10 replies
-
2
-
- anova variants
- anova
- ancova
- manova
-
Tagged with:
-
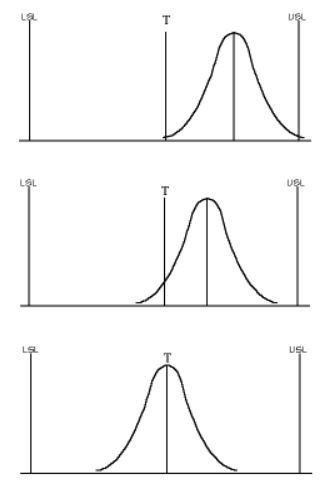
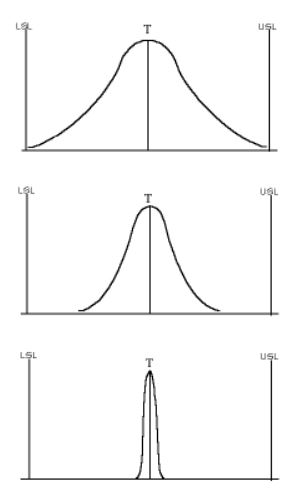
The Cp and Cpk are quite familiar capability indices commonly used to ensure that a process is running and how it is expanded compared to the tolerance (Cp), or that it stays well within specifications (Cpk). One example for Cp and Cpm is that of an Airport Runaway. Cp tells us the width of the Runaway compared to the width of the airplane. If it is a personal plane, the runaway is fairly wide compared to the width, and i wouldn't worry much about staying on the road. This would yield high Cp value, but if it is a medium size plane, it would take moderate effort to keep closer to the center line, hence medium level os Cp value, However, if it is an international flight with maximum size plane, the pilot have to be extra careful to keep it within the safe zone on the Runaway, therefore resulting in low Cp value. We can relate above example with the process by assuming the plane size as the processess on production line and Runaway as the tolerance level. Now, Cpk tells us how close we are moving the plane to the shoulder of the road. You get a high Cpk when you drive in the center of the center lane. The closer you get to the shoulder, the lower the Cpk. Alternatively , another sort of capability index exists: the Cpm, which is much less famous and used even less frequently. The main difference between the Cpm and the other capability indices is here the bias from the target is directly taken into consideration in the Cpm. This bias is mainly the difference between the process average and the target. In Minitab, Cpm is calculated automatically, as soon as expected / targeted value is entered into a capability analysis . To obtain a best Cpm value, the process needs to be right on target, whereas to obtain a satisfactory Cpk value, a process simply needs to stay well within specifications. This might seem to lead to the same conclusion; however, there is an obvious and major difference: with the Cpm, a more inflicting drawback is put in place for not being right on target. Cpm or Cpmk yields much better outcomes compared to cpk since it takes in account the target itself. In cases where only one specification is provided, the calculation of cpk is rather insignificant, but the Cpm can be calculated. Lets take an example here, Lets consider our subject is handling a process with a decent process capability index, where Cpk, has never dipped below 2 and typically averages beyond 3. Given this high degree of capability, subject might consider further eradicating the variation near the target. While the Cpk and Ppk are well informed and quite common indices, they may not provide as much information as our subject desires to continue to further enhance the process. This is moderately significant if the target is not the center-point of specifications. On the other hand, Cpm utilizes the target when measuing Std deviation. Like the sigma of individual formulae, compares each reading to a reference value, instead the data is compared to the traget value. These diffreneces are then squared. As a result , any observation that is farther from the traget value will raise the std deviation. Cpm is prefered to Cp because it measures process location and standard deviation. In the below image, the process remains unchanged, as the process is more middled, Cpm gets better , Here, Cpm is good at top, better in mid and best at last. But once the subject keeps target as center, we even better Cpm"( last slope). Boradly speaking, when we have both upper and lower specs in a process, mostly we get the target somewhere near the middle point. As per VOC, we should see the possibility of Target value being logical and feasable , before , then perhaps see to the possibility of moving the target value towards One specification . From excellence point of view, this makes more sense to have the least possible compromise with respect to the target value and Cpm capability indices helps us to measure and publish this part.
-
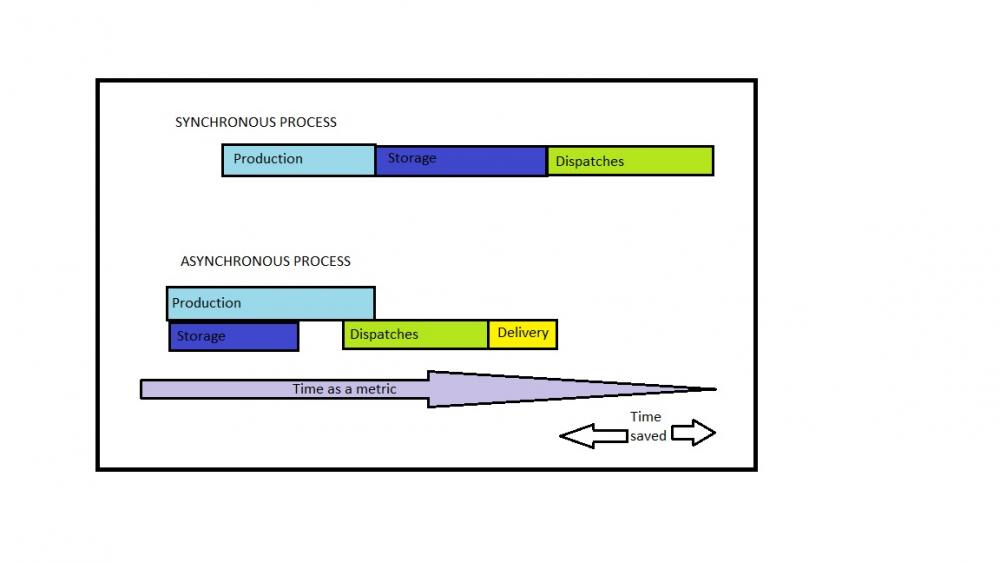
Synchronous Execution: Synchronous pertains to some connection/ dependency like the processes which are interconnected. When you perform something synchronously, you wait for it to be completed before moving on to next step in the process. In Synchronous operations, tasks are performed one at a time and only when previous step is completed , the following is unblocked/ available. For example, in a simple process of preparing a Cake involves steps like measuring flour, adding ingredients, preparing batter, oiling the baking pan, pre-heating the Oven, baking the cake base, preparing the toppings and so and so forth. Here, the next step cannot be executed unless the previous one is completed, otherwise the target results shall not be attained. Another example could be a movie hall scene, where you are in a line to get a ticket. You cannot buy it until everybody ahead of you gets theirs , and the same applies to the people in the queue behind you. For Synchronous execution means the execution occurs in a single series. 100->200->300->400If those sets in the series are routines, 100 will run, then finish, then only 200 will begin, then be completed, then 300 will start, and so on. Synchronization denotes to two or more processes with start and end points, rather than their executions. In this example, Process 100’s endpoint is synchronized with Process 200’s start points: SYNCHRONOUS |--------100--------| |--------200--------| |---------300--------| When a task is performed synchronously, you wait for a task to be over before moving on to another task. One task depends on the end of previous one. Synchronous (one thread): 1 thread -> |<----A---->||<------B------>||<-----C----->| Synchronous (multi-threaded): thread A -> |<---A---->| \ thread B ------------> ->|<----B---------->| \ thread C ----------------------------------> ->|<------C----->| Asynchronous Process: When one conducts a task asynchronously, it can move on to another/next step before it finishes. On the other hand, asynchronous process do not have to have their start and endpoints synchronized: ASYNCHRONOUS |--------1001--------| |--------2002--------| |-------3003------| |-------4004------| Where Process 1001 overlaps Process 2002 and so on, they’re running concurrently. When an activity/step is executed asynchronously, one can directly move to another task before even the previous step has been concluded. Here, one task does not depend on the other or rather completion of one step does not define kick off to the other/next step. Simple example for Asynchronous process could be a food court scenario, where you are ordering food with many other people. Other people had also ordered their food items, and independently they don’t have to wait for your food to be prepared and served to you before they can order/ be served. In the back kitchen, chefs are continuously cooking, serving, and taking new orders. People will get their food served as soon as it is cooked so the beginning and conclusion of steps is not at all dependent. Another basic example is the difference between old Landline phones, where call merging / conference call like option were not available, makes them uniquely Synchronous whereas in present times, all such functions and more could be managed quite easily, without one function dependency on the other. To conclude with Synchronous/Asynchronous process, one should focus on the steps or tasks and whether they are independent of each other or not. Say, if you are designing a system, the first step you need to take is to identify the dependencies between processes and define which you can execute singly/individually, which needs to be executed as a consquence/ conclusion of other processes. Take a look at the image over. On the top, you can see that in Synchronous process, the tasks are executed in a successional way; there is not concurrent step, and the next step is always post the completion of the last step. The products are the first to be manufactured, stored, and eventually dispatched. Now imagine that you did an analysis and concluded that Production line could be connected to an automated process which can store the finished goods as soon as they are produced and there is not waiting time for such action, and vice-versa, but that to execute dispatches you need the information from products first — there’s a reliance. In that case, the first two tasks can be executed asynchronously, but orders will only be executed when products are mostly completed — so, synchronously. As a result, by applying resemblant automation and asynchronous programming when dealing with independent tasks, you ’re suitable to perform these tasks way quicker than with Synchronous process because they ’re executed at the same time. This way, your system releases precious information/data/product/outcome before and it’s ready to execute other processes that queued. If the precision and accuracy are critical to the customer, the quality deviations should be restricted at all costs, then Synchronous processes are considered more reliable since they tend to have more checkpoints with detail-oriented transits between stages. Whereas, if automation is preferred with focus on digital tools, targeting huge efficiency and time saving is a key factor, then one may incline towards Asynchronous processes.
-
Berkson’s Paradox, also known as Berkson’s falseness or Berkson’s bias is the counter-intuitive idea that events which feel to be identified actually are not. Take two events, A and B, which are fully independent events( for illustration, lung cancer and diabetes). still, the presence of diabetes will make the presence of lung cancer more likely, If a study selects for both the presence of A( lung cancer) and B( diabetes). Intimately, this makes no sense, but the data seems to back thiscounter-intuitive notion up, showing that there is, in fact, a connection. Berkson wrote about the incongruity in 1946. His original paper showed that two conditions, which have no real relationship, can be what he called ‘ spuriously associated ‘ in sanitarium- grounded case control studies. still, the idea wasn’t extensively accepted until 1979, when David Sackett of McMaster University handed strong substantiation that Berkson’s incongruity does, in fact, live. To understand this, consider a particular children’s Hospital during an influenza dread. We ’re going to prove thecounter-intuitive idea that having influenza offers some protection against appendicitis. 10% of the general public has Influenza. In the sanitarium, full of sick children, the odds are of course higher; 30 percent of the children may have been admitted for influenza. Now suppose 10 of the children were admitted for appendicitis. There will be some imbrication; we assume a child with appendicitis is just as likely to get flu as any other child, and a child with flu can still have appendicitis. The percent of appendicitis cases with influenza would be 10 of 10,(0.10 *0.10 = 0.01) or 1 of Hospital cases. Reasons for hospital admissions/100 children: Influenza (blue), Appendicitis (red), both (red/blue). still, he has 30 chance of having influenza, and a 10 chance of having epilepsy/ storms, If you choose one sanitarium child aimlessly. That's to say, 10 out of 100 children will have epilepsy/ storms, and 30 out of a hundred will have influenza. Now let’s calculate a new chance a non influenza child’s chance of having appendicitis. You're choosing from all the children in the unheroic boxed area( 70 children) below. This is what we know, The thirty influenza cases outside of the unheroic box includes the appendicitis/ influenza( red/ blue) children. In our illustration, that’s just one child, Out of the 100 children, there were 10 total appendicitis cases, so there will be 9 among the seventy non-influenza cases we ’re picking from now. So we can calculate the new chance a non influenza child has a 9/ 70 = 12.9/ 100, or chance, of having appendicitis. That’s advanced than the 10 rate of appendicitis among all children. So Indeed though these two events are entirely independent, the inner- sanitarium statistics make it look like having influenza is some small insurance against appendicitis.


-
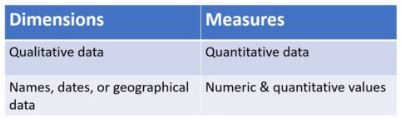
Measurements is the assignment of a number to a specific of an object or event, which can be compared with other objects or events. The compass and operation of dimension are dependent on the environment and discipline. In the natural lores and engineering, measures don't apply to nominal parcels of objects or events, which is harmonious with the guidelines of the International vocabulary of metrology published by the International Bureau of Weights and Measures. still, in other fields similar as statistics as well as the social and behavioral lores, measures can have multiple situations, which would include nominal, ordinal, interval and ratescales.Measurement is a foundation of trade, wisdom, technology, and quantitative exploration in numerous disciplines. Historically, numerous dimension systems was for the varied fields of mortal actuality to grease comparisons in these fields. frequently these were achieved by original agreements between trading mates or collaborators. Since the 18th century, developments progressed towards unifying, extensively accepted norms that redounded in the ultramodern International System of Units( SI). This system reduces all physical measures to a fine combination of seven base units. The wisdom of dimension is pursued in the field of metrology. Measurement Instruments and systems Measuring systems or instruments comprise a number of rudiments. An element is thus needed in differencing the object and in seeing its confines as well as its frequence. The information is then processed through the system via physical signals. These physical signals are also put in comparison with a reference signal that's known and has been multiplied or subdivided for suiting the range of the dimension that's needed. The reference signal on the other hand is attained from the known volume by calibrating. The comparison, still, can be an analog process where the signals are in a nonstop dimension and are also made equal. Another process of comparison process is known as quantization and this is attained by counting, that's to divide the signal into colorful equal corridor with known sizes and also add up all the number of corridor. The function of the measuring systems facilitates the introductory process that's being mentioned over. The physical signal is farther amplified to make sure that it's strong for the completion of the dimension. There's also a way of reducing the declination of the dimension during its progress throughout the system, i.e., there can be a conversion of the signal to a enciphered or digital form. Dimension -The dimension of a fine space( or object) is informally defined as the minimal number of equals demanded to specify any point within it. therefore a line has a dimension of one because only one match is demanded to specify a point on it – for illustration, the point at 5 on a number line. A face similar as a aeroplane or the face of a cylinder or sphere has a dimension of two because two equals are demanded to specify a point on it – for illustration, both a latitude and longitude are needed to detect a point on the face of a sphere. The inside of a cell, a cylinder or a sphere is three- dimensional because three equals are demanded to detect a point within these spaces. In classical mechanics, space and time are different orders and relate to absolute space and time. That generality of the world is a four- dimensional space but not the bone that was set up necessary to describe electromagnetism. The four confines of spacetime correspond of events that aren't absolutely defined spatially and temporally, but rather are known relative to the stir of an bystander. Minkowski space first approximates the macrocosm without graveness; thepseudo-Riemannian manifolds of general reciprocity describe spacetime with matter and graveness. Ten confines are used to describe string proposition, eleven confines can describe supergravity and M- proposition, and the state- space of amount mechanics is an horizonless- dimensional function space. The conception of dimension isn't confined to physical objects. High- dimensional spaces constantly do in mathematics and the lores. They may be parameter spaces or configuration spaces similar as in Lagrangian or Hamiltonian mechanics; these are abstract spaces, independent of the physical space we live in. Dimension in mathematics When we say the confines of a thing in mathematics, it refers to the measure of the size let’s say the height, length, and breadth of an object or the distance or the region of space that's in one direction. In simpler terms, gives us the measure of the length, range, and height of any object in question. There are three different types of confines grounded on the object. 1. One- dimensional or 1D objects An illustration of this is a line member that can be drawn on a face. It's a 1D object because this object has only length without range. 2. Two- dimensional or 2D objects 2D shapes relate to those objects in figure that have flat- aeroplane numbers having only two confines i.e., length and range. 3. Three- dimensional or 3D objects These are solids numbers or objects that are generally appertained to as 3- dimensional numbers or objects or shapes and they correspond of three confines – length, range, and height. Key Differences could be as below, In the English language, the word dimension can have further than one meaning. Dimension can mean the length, breadth, or height of an object or 3 confines in physics. still, it can also mean or explained how an object takes up space in the 3 said confines. dimension on the other hand is the act or results of what the confines of the object are( volume). A dimension is purely a power within a polynomial expression which describes, for case, degrees of freedom of the factors of a certain unrestricted system. Measurement is the difference between equals within a dimension! Confines on a delineation can be specified exactly, although the usual practice is to have a tolerance since you can not make effects exact. Measurement implies a tool to estimate the confines of an living object. Measures have forbearance too, grounded on the essential delicacy of the tool. The tool making the dimension has to be accurate enough to determine if a part is made within the specified forbearance.
-
Mafia Offer- As cheezy as it sounds, is something an offer that you make to your customers , which is as good that they just cannot refuse amd your competetors cannot match the same either. It is also pertaining to the operational improvements/ incentives which gives the MAFIA offer a competetive advantage. It is simply an offer you make to your prospective and current customers that they just cannot walk away from and your competetion simply cannot counter in short time period. In today's cut-throat marketing world, the product/services we have to offer has to have better service, quality, delivery time ,response time etc. which in turn should be more of value/significance compared to the premium price they are paying. Unique Selling Proposition- This is a marketing concept which refers to any factor(s) or aspect(s) of the product/service which makes it unique to the rest of the competetors/ market while promoting its unique/extra pro's to the customers/ consumers. This becomes more of a Branding strategy for any marketing team to leave a reputable impression in customer's eyes and hence driving the sales to the peak. It is your statement of definite value , providing answers to the questions below, What is that i am offering that no one else is able/willing to offer? What is that my current customers are looking for in contrast to my competetion? What makes my product/service unmatchable and special to my customers? Key differences, between MAFIA Offer and USP or Unique Selling Proposition are as follows, USP's deal with what we are already doing , summerizes it with specifically targetting one or few customers dealing with issues or gaps with the products/services being offered. These cases do not fall under the MAFIA offer category as they do not offer Operational/ technological precedence as it intends to in MAFIA offer. Another area where a Mafia Offer is steps ahead of other concepts as it targets to fix the core issues customers are facing as it is related to doing business with the market/industry. Other concept deals with customers problems or symptoms on more temporary level. Mafia offer enables us to make operational changes to built/provide that special product/service/quality that has the wow factor that becomes unrefusable to your customers and gives you an operational upperhand, makes your product/service Unique. Whereas one of the common disadvantage USP's carry is failure to deliver the Uniqueness because it will require customer scrutiny, therefore it fails to live upto the customer expectations.
-
A Robot is an autonomous machine/equipment that performs its tasks without any human intervention, whereas a Cobot is an artificial intelligent robot that performs tasks in collaboration with Human workers, therefore it is different as compared to automatic robots , the Cobots are programmable and they work arm in arm with humans . So, in simpler words , they are designed to work with humans and not for humans. Just like Industrial robots, many COBOTS are being majorly used in Manufacturing industries, like Automobiles, Engines, motors, painting etc, where they can handle more risky jobs like deburring and polishing etc. Cobots key addon over a typical industrial robot is the flexibility to be programmable and ease of use for changing of tasks like in polishing/painting job, a COBOT could change its movement and rotate the brush/ sprayer according to the user's requirement, where a similar task with a Robotic system would require some serious modification and at an expense too. Notably, key differences with COBOTS are as follows, Partnership with Humans- As mentioned above, Cobots perform as an assistant to human operators and could work alongside humans, with minimal to no human intervention to finish the task assigned. These machines are not designed with human safety as a key priority they just do their task. Safety- Cobots are designed with safety features which allow effortless collaboration for them with human workspace. They are able to detect and stop movement with slightest of human touch to prevent any injury to the humans in the vicinity. This prevents to machine guard these human friendly equipment's. Ease of Use- Collaborative robots or Cobots are relatively easy to program and are exceptionally adaptive. Where traditional robots require heavy programming and maintenance, cobots can be operative without much coding and are more manageable with least instructions. This becomes even more fruitful when operators are able to modify their operations and have them perform variety of tasks. Functionality- In terms of Functionality , cobots are highly exceptional ,especially when they could be moved and utilized in variety of areas in production. They could be mounted on any surface, walls or even ceilings. Also, their light weight makes them even more durable and manageable. As for service industry, because of their speed and accuracy, Cobots can be a useful asset to service industries with easy to setup,, more agile and more precision for better and expected outcomes. Whether it is Banks, Mechanics etc it would be an exciting prospect for more Cobotic workforce especially for the sectors where human regulation is still preferred compared to complete automation.
-
The Kepner Tregoe analysis is based on methodology where the problem is disconnected from the decision, also termed as PSDM ( problem solving and decision making). Both inventors Charles Kepner and Benjamin Tregoe came up with the method where they dived in depth about the troubleshooting skills of people. Under traditional methods , problem’s are worked upon after four basic questions are answered, which are 1. What is the issue? 2. Why did it happen? 3. What needs to be done? 4. What needs to be done to prevent it from happening again? Whereas Kepner Tregoe method aka rational processes , this traditional pattern is modified and four step rational processes in which four fundamental questions are being asked , which are as follows , Situation analysis- Here we shed some light on the problem/ issue. Problem analysis- Here real cause of the problem and the connection between the cause and result are being looked into: Decision analysis- After utilizing decision making tools , choices are made to produce potential solutions. Potential Problem analysis- At this point preventative actions are developed and future occurrence precautions are proposed. KT matrix is root cause analysis used in organizational decision making. There are eight major steps involved in KT matrix , 1. create a decision statement 2. define operational objectives 3. weigh operational objectives 4. generate a list of alternatives 5. assign relative scores to each alternative 6. rank the highest scoring alternatives 7. generate a list of problems 8. Compare rankings . For example- In order to focus more on customer satisfaction in 2014, Microsoft customer care and support utilized the KT method into its CSS systems and metrics . To be more accurate, the rational processes of this approach were used by the technical and legal team members to find the actual cause within time frame , more accurately with better decisions making and least problem reoccurrence. Key areas of focus for the CSS team were , - increase customer satisfaction and teamwork - customer handling experience to be best in class - reduce key metrics like DTS ( days to solve ) and TMPI ( times minute per incident). After 3 months results were quite evident with DTS reduced by an average of 1 per day case , TMPI deduced about 27 mins per case and cyst satisfaction was up by 3.3%. Some of the notable advantages it possesses could be , but not limited to , a. It allows businesses to make smart decisions in critical issues which are often subject to biases such as emotion or time constraints. b. Based on company requirements, it is quite competent to prioritize key factors by assigning numerical scores . c. It is rigorous decision making technique with a measurable evaluation of decisions and their options as well .
-
Grubb’s test is used for a minimum mono outlier in observation in a single attribute data (like employees salaries in an industry ) with normal distribution, whereas Boxplot is more of a visual technique for the same with more flexibility in terms of comparison between sets of data or groups , gives more direct representation of the distribution of data. I guess Grubb’s test is limited since it could detect only one outlier at a time even though it is useful in detection of an outlier. I would prefer BOXPLOT as this gives more visual validation summary for mean, dispersion or density more efficiently.