Satinder Singh
Members
-
Joined
-
Last visited
-
The Sparsity of Effects principle is a fundamental concept in the Design of Experiments (DoE). It involves systematically planning and conducting experiments to optimize results and gain insights into the relationships between variables. It states that in most experimental systems, only a small number of factors or variables significantly affect the response or outcome of interest, while the majority of factors have little to no effect. This principle helps researchers in DoE by guiding them to focus their efforts on the few critical factors that have a substantial impact on the response variable. By identifying and studying these influential factors, researchers can gain a deeper understanding of the underlying system or process without wasting resources on investigating irrelevant or negligible factors. To illustrate the Sparsity of Effects principle, let's consider an example. Imagine a researcher is investigating the factors affecting the yield of a chemical reaction in a manufacturing process. The researcher wants to identify the critical factors that have a significant effect on the yield. The researcher decides to conduct a factorial experiment where they vary four factors: 1. Temperature 2. Reaction time 3. Catalyst concentration 4. Stirring speed Each factor has two levels: high and low. Therefore, a full factorial design would require conducting 2^4 = 16 experimental runs. After performing the experiments and analyzing the data, the researcher obtains the following results: Factor | Yield (%) Temperature | 65 Reaction time | 82 Catalyst concentration | 70 Stirring speed | 67 From these results, the researcher can observe that only the reaction time (Time) factor has a substantial effect on the yield, as changing its level from low to high significantly increases the yield. The other factors, temperature (Temp), catalyst concentration (Catalyst), and stirring speed (Stirring), do not show a noticeable impact on the yield. Based on the Sparsity of Effects principle, the researcher can conclude that the reaction time is the critical factor influencing the yield, while the other factors can be considered negligible in this specific experimental system. This understanding allows the researcher to focus further investigations and optimization efforts specifically on the reaction time factor, saving time, resources, and effort. By leveraging the Sparsity of Effects principle, researchers can streamline their experimental design, reduce complexity, and efficiently allocate their resources to study the factors that truly matter in their field of study.
-
Exponentially Weighted Moving Average (EWMA) Control chart It is a statistical process control chart used to monitor and control a process. It is a modified version of the traditional control chart unlike traditional control charts, which use fixed time intervals to calculate the control limits. An EWMA chart uses exponentially decreasing weights to give greater emphasis to more recent data. It uses a moving average to detect changes in the mean value of a process. An EWMA control chart is different from traditional control chart. The key difference between the EWMA control chart and the traditional control chart is that the EWMA places more weight on recent data points while gradually decreasing the weight given to older data points. In an EWMA chart, each data point is given a weight based on its age, with older data points given smaller weights. The weight assigned to each data point is determined by a smoothing parameter called lambda (λ), which ranges between 0 and 1. A larger value of lambda gives more weight to recent data A smaller value of lambda gives more weight to historical data i.e. less weight to recent data Advantages of EWMA chart: - It can detect smaller shifts in the process mean and respond more quickly to these shifts. - It is more sensitive to changes in the process than traditional control charts, reducing the risk of producing non-conforming products - It requires less data to establish the control limits. Disadvantages of EWMA chart: - It may not be appropriate for all types of processes. - It may not be suitable for processes with long-term trends or seasonal patterns - It is more complex to calculate than traditional control charts. It requires the selection of an appropriate value of lambda, which can be subjective and may vary depending on the process. - It may produce false alarms if there is a sudden increase in the data. For example, let's say a manufacturing company produces ball bearings with a target diameter of 10 millimeters. The company uses an EWMA chart to monitor the process and detect any deviations from the target diameter. The company decides to set the value of lambda to 0.2 based on historical data. After analyzing the data, the EWMA chart detects a shift in the process mean on the 6th day of production. The company investigates and finds that a machine was not calibrated properly, causing the deviation from the target diameter. The company quickly takes corrective action, reducing the risk of producing non-conforming products. Without the EWMA chart, the deviation may not have been detected until much later, resulting in more non-conforming products being produced.
-
A Job Breakdown Sheet (JBS) is a tool used to document the steps and tasks required to complete a particular job or process with the goal of identifying opportunities for improvement. The JBS generally includes information such as : 1. Important information necessary for the completion of the tasks. 2. The sequence of tasks 3. The tools to be used in the tasks 4. The materials required in the tasks 5. The time required for each task Breaking down tasks into smaller steps, makes it easier to identify potential areas for improvement and to develop targeted solutions. Using JBS has both advantages and disadvantages to it which are as follow Advantages of using Job Breakdown Sheet (JBS) as a process improvement tool are: 1. Standardization of Processes: A JBS can be used to document the best practices for a particular job or process, which can be used as a standard for future iterations of the same job or process. This includes the sequece of the steps and the way in which it is been done 2. Improved Process Efficiency: By breaking down a process into its individual steps, a JBS can help identify inefficiencies and bottlenecks in the process. This can lead to process improvements that result in increased efficiency and productivity. 3. Training and Development: JBS can serve as a training tool for new employees or as a refresher for existing employees. By breaking down a process into its individual steps, a JBS can help employees understand the overall process and the role they play in it. Disadvantages of using Job Breakdown Sheet as a process improvement tool include: 1. Time-Consuming: Developing a JBS can be a time-consuming process, particularly for complex processes or jobs. 2. Overemphasis on Process: Focusing heavily on the process can lead to a negligence of other important factors such as employee morale, customer satisfaction, and innovation. 3. Limited Scope: A JBS is designed to document the steps required to complete a particular job or process, and may not be useful for broader process improvement initiatives. 4. Limits Creativity : Some employees may feel that being required to follow a strict set of procedures limits their creativity or autonomy A Job Breakdown Sheet (JBS) can be integrated into the broader Lean Six Sigma DMAIC (Define, Measure, Analyze, Improve, Control) framework and by using it during the Measure & Analyze phases. a) During the Measure phase: JBS can be used to document the current process b) During the Analyze phase: JBS can be used to identify inefficiencies and areas for improvement. The information gathered from the JBS can then be used to develop and implement improvements during the improve phase, and to develop controls during the control phase to ensure that the improvements are sustained over time.
-
APQP, stands for “Advanced Product Quality Planning” it is a framework of techniques and procedures to develop new products in manufacturing and extensively used in the automotive industry. Basically, it is a structured approach to the new process or product development which ensures that the voice of customer is clearly translated into technical specifications. It is Implemented in 5 Phases, which are as follow: Phase 1: Planning. Planning is directed at understanding the customer’s requirement and includes gathering data to define what the customer wants and then using the information to create specifications. The output of this phase is product design and quality goals. Phase 2: Product Design and Development. This phase is directed at finishing the “product design” followed by defining material specifications, equipment requirements, doing FMEA and then finally establishing product prototype. Phase 3: Process Design and Development. This phase focuses on planning the manufacturing “process” that will produce the new product keeping product specifications, product quality, and production costs in mind. Phase 4: Product and Process Validation. This is the test phase for validating the manufacturing process and the final product. This involves performing trial runs for testing product output, reconciling adjustments before moving to the final phase. Phase 5: Feedback and Continuous Improvement. This Phase focuses on the full-scale production, with emphasis on evaluating and improving processes by reducing process variations, identifying issues, and implementing corrective actions. Where as DFSS, stands for Design For Six Sigma. It is more of an approach than a defined methodology used to develop new processes or products at Six Sigma quality levels. It focuses on gaining a deep insight into customer requirements and using them for creating new product or service. The aim is to design products and processes by minimizing defects and variations in the process. There are multiple methodologies for implementing DFSS, one of the most common technique is DMADV which is as follow: 1. Define The Define stage is meant for defining the Project Charter, Communication Plan and Risk Assessment / Management Plan. 2. Measure In measure stage the focus is on collecting customer requirements. 3. Analyze In measure stage the focus is on understanding customer requirements and then translating them into measurable design performance or functional requirements which is then converted to develop multiple concept level design. 4. Design In measure stage the preliminary “design is determined”, few tools used in this phase are Failure Modes and Effects Analysis (FMEA), Tolerance Stack Analysis, Design Of Experiment (DOE) 5. Verify In this stage, the team introduces the design of the product or process and performs the validation testing to verify if it meets the customer requirements. Both APQP and DFSS are used for new product development but the aim is bit which becomes the reason for using one approach over the other and the difference in the aim is as follow: The primary goal of DFSS is to “reduce variation”, it is intended for use when you must replace a product instead of redesigning. Its application is in various industries like finance, marketing, basic engineering, process industries, waste management, and electronics The primary goal of APQP is to create a “product quality plan” which will support development of a product or service for customer satisfaction. It is primarily used in automotive industry
-
Heinrich accident triangle is a theory of Industrial accident prevention, which is also known as Bird’s triangle. It shows the relationship between the three types of accidents. 1. Serious accidents 2. Minor accidents 3. Near misses It is generally depicted as a pyramid where serious accidents comes at the top (tip of the pyramid), minor accidents in the middle (middle part of the pyramid) and near misses comes at the bottom (base of the pyramid). Heinrich’s theory is based on the probability and assumption that number of accidents are inversely proportional to the severity of those accidents and if we are able to reduce the number of near misses and minor accidents the number of serious accidents will automatically reduce. There are few limitations of Heinrich accidents which are as follow: 1. It blames too much on worker: This theory blames too much on the individual without considering the root cause of the accident. Which encourages a culture where individual not even report the problem. 2. It focuses too much on reducing minor accidents: This theory over states the relationship between minor accidents and serious accidents which intern lead to a problem like ignoring more serious but less likely accidents. These Limitations can be overcome by 1. Focusing on finding out the root causes of the problem. Introducing better management systems that can eliminate the root causes of accidents. For instance, using safety systems like LOTO (Lockout tagout), Confined space entry, machine guards, PTW (Permit to Work) 2. Focusing on more serious but less likely risks also, as they can also cause serious accidents 3. Corrective actions must be taken to manage ongoing risks.
-
Jishu Hozen is a Japanese word which means autonomous maintenance. It follows the core principle of Total Productive Maintenance by giving more control and authority to the operators to maintain their machine. It is a method that provides machine operators the responsibility for basic maintenance tasks, such as: lubrication, cleaning, tightening, , safety checks and inspections rather than depending on dedicated maintenance technicians so that the later ones can concentrate more on the complex problems. There are 7 steps for successful implementation of Jishu Hozen which are as follow : 1. Increase operator’s Knowledge: Machine’s operator must know the ins and outs of their machines. This involves training the operator to a level where he becomes familiar with the technical details of how the machine’s components work. Operators must be trained to identify faults, fix abnormalities, set optimum equipment conditions and detect deviations from optimum performance. 2. Initial Machine Cleaning and Inspection Once operators are trained, they are now capable of performing inspections and cleanings. This step involves getting equipment to a place where it’s almost “like new”. Operators must be looking for: leaks, loose bolts, lubrication, cracks, dust and dirt, smells, and heat. 3. Remove Causes of Contamination To ensure equipment doesn’t deteriorate, do not allow operators to contain contamination with them by promoting a culture of cleanliness and encouraging them to identify the causes of contamination. 4. Develop Standards for Lubrication and Inspection It is very important to document and have a record of standards on cleaning, inspecting and lubrication 5. Inspection and Monitoring It is very important to inspect and monitor that all the steps have been followed rigorously sa it helps in preventative maintenance tasks, they can be structured, scheduled and started automatically. 6. Standardize Visual Maintenance Taking steps to make equipment more visual is important as it helps to identify the problematic areas quickly. For instance replacing translucent covers with transparent ones, labelling on levers, and developing a tag system. 7. Strive for Continuous Improvement It’s important to continuously evaluate the standards and procedures created, to see where there is room for improvement. Continuous improvement is one of the most important pillar of TPM.
-
A Bowling Chart is a visual way to monitor Key KPIs which helps in comparing actual matrix to targets. It is termed as bowling chart because of its similarities with the appearance of a bowling scorecard. These charts can easily represent how often goals are met or missed but they do not showcase how we are improving over a period of time. For every KPI on a Bowling Chart, there are two rows: 1. The target value 2. The actual value There are three colours used on the chart 1. Red : This signifies, KPI performing worse 2. Yellow : This signifies, KPI has not met the primary target 3. Green : This signifies, KPI has met or overachieved the target Policy Deployment process consist of 1. Reviewing the strategic goals of an organization and aligning the company’s resources towards meeting those goals. 2. Cascading actionable goals down throughout the organization and when all of the cascaded goals are compiled, they will add up to meet the strategic goals. 3. Each organization within the company must do its part to achieve its target else the company will be unable to reach its strategic goals. Policy deployment process requires continuous review of progress, allowing leaders to act on deviations from the plan. Bowling chart is the best tool which simplistically represents weather KPI is met or not and also highlights it which makes it common yet and effective tool to track Organization's Progress and hence frequently used for the purpose of Policy deployment.
-
Rapid application development (RAD) is a methodology used in software development. It focuses on rapid prototype development, release, taking feedback and making changes as required. In this prototypes are developed, functions are tested without any effect on the end product. While requirement gathering design's problems aren't always noticeable. By using (RAD) and making prototype one can showcase a smaller version of the proposed product this will intern highlight two important things 1. Design Problems for the developers 2. Requirement refining opportunity for the customer Which intern help in delivering a better product to the customer. RAD is equally applicable for the outside software market, even the model was discovered long back and very effective in today’s competitive marketplace where technology is changing at a very high speed. RAD is applicable for outside software market also because of the following reason: 1. With the use of this methodology customer can see and feel the product even before the actual product is prepared, which help in determining which aspects are worthwhile and which can be revised or discarded. 2. It is possible to see the production process and decide if any steps can be changed, combined or even removed. This eventually helps in determining the production cost of the product. Since prototyping can be done lot many other industries hence same can be applied there.
-
Back casting is the alternative to forecasting and is a method that starts with the defining a desirable future by working backwards to identify the steps needed to get there. Back casting is the method that provides the framework for disruptive innovation and that happens in jumps unlike the incremental innovation. This can be achieved by following the given steps: 1. Beginning with the end in the mind 2. Look backwards from the vision to the present (baselining of the present situation) 3. Defining what changes are required to achieve the desired future 4. Establishing policy and strategy to implement the changes required 5. Move step by step towards the vision There are two ways of doing back casting 1. Back casting by scenarios : Imagining the future picture and then defining the steps to achieve it. 2. Back casting form Principles : Success is defined by the principle (Sustainability principles) Application of back casting in problem solving: 1. Back casting can be used to solve long term Problems, as sustainability would require more than marginal changes at many levels of society it is an approach that focus on the problem to be solved rather than on present conditions and current trends, is better suited to achieving real solutions than a traditional forecasting approach and since back casting follow this approach it must be implemented in that way. 2. It is important agent in determining the direction the technology development must take end in specifying the targets. 3. It determines the pace at which this development process must take effect by to be set for this purpose toward determining the nature and scope of the technological challenge. It can thus serve to direct the search process toward new sustainable technology 4. Back casting can be considered for the prediction of the unknown values independent labels that might have existed to explain the known values of the dependent variable 5. Back casting is better used for solving sustainability problems.
-
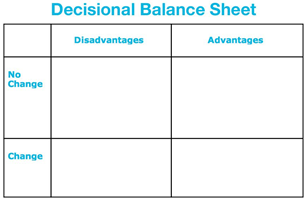
Decision Balance Sheet: Decision Balance sheet is a simple tool which helps in making decision by comparing the advantages and disadvantages of both the scenarios where we are going ahead or not going ahead with the change or the solution proposed. How Decision tree can be made. 1. We need to create four quadrants as shown in the picture, each quadrant represents a different Scenario a. 1st quadrant (Top left): Represents the disadvantages if there is no change/ Solution proposed is not implemented b. 2nd quadrant (Top right): Represents the advantages if there is no change/ Solution proposed is not implemented c. 3rd quadrant (Bottom left): Represents the disadvantages if the change/ Solution proposed is implemented d. 4th quadrant (Bottom right): Represents the advantages if the change/ Solution proposed is implemented 2. Mention all the advantages and disadvantages in all the quadrants 3. Now we need to take into consideration the two most quadrants (1st quadrant and the 4th quadrant) as comparing this will tell us the benefits that we will receive if we go for the change along with the disadvantages if in case we don’t go ahead with the change. It helps in the following ways: 1. Helps in making the definite decision as in a single glance the advantages of the change and the disadvantages of no change can be seen 2. It helps in reaffirming, why we are going for the change 3. It improves the understanding of the change and people are bound to see both the positives and the negatives of the change. 4. It speeds up the decision making 5. The only drawback that it has is that it is difficult to compare different options of the change