RahulGarg
Members
-
Joined
-
Last visited
Everything posted by RahulGarg
-
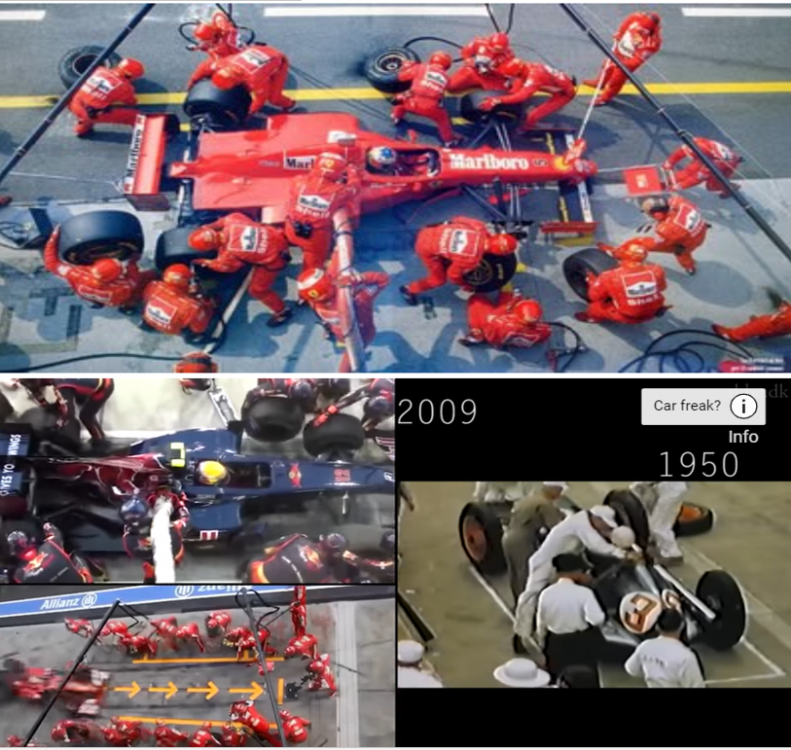
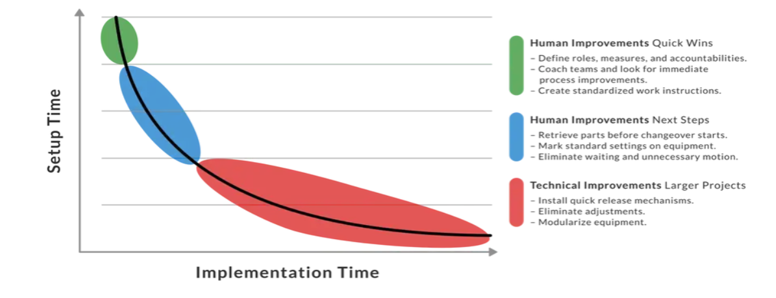
OTED – An Abbreviation for One touch Exchange of Dies and it is closely related to SMED (Single Minute Exchange of Dies) but OTED is much more difficult to implement than SMED. OTED is one of the more advanced and efficient methods of SMED concept that only occurs after many simpler Set-up reducing activities. Example – Pit Crew team’s Operations Improvement Over a Period of Time and Moving towards OTED from SMED Concept Image Source : https://www.leansixsigmadefinition.com/glossary/smed/ Ideally changeovers shall take < 100 secs OR even less than one minute. OTED Needs the following actions to take place : · Elimination of the adjustments · Freedom from screw fastenings · Moving towards strength and precision · Precise and close fits · The functional burdens of dies as compared to machines · The separation of die material and die function · Advanced Insertion methods The one-touch target simply means that an Exchange can be done with just a single motion, rather than following the multiple steps. An OTED aims to achieve the setup time of 15-20 secs against the set up time of single digit minutes in SMED. To achieve the SMED / OTED , typically below set of steps / operations are focused upon : 1. Develop and complete the external set-up checklist. 2. Develop and complete set-up reduction observation forms – Classify the activities into 4 buckets i.e. P- Preparation Activities, R – Replacement Activities, L – Locating Activities and A - Adjusting Activities. And also categorise the operations into internal / external. Internal Activities – Activities / Operations those can be performed when the Machine is shut down External Activities – Activities / Operations that can be performed even if the Machine is running 3. Convert the Internal Activities to External Activities – Most Important and Brainy Step 4. Bring Standardisation concept into the process operations 5. Use Clamps and One Touch Fasteners 6. Use Intermediate Jigs 7. Adopt Parallel Operations 8. Eliminate the Adjustment Activities 9. Use Mechanisation as last resort Set Up Time Reduction Benefits as Evident in below graph : Companies Using / Aim to use the OTED Concept in Automobile Sector : Some of the Examples of Evident OTED Concept in day to day Operations in Services and Manufacturing Sector : Services : Ø Reduction of Employee Onboarding Time from Month of Sigle Day / Few Hrs Ø Reduction of New system / laptop configuration time from earlier in days to few hrs Ø Account Opening process in banks earlier in days to now in with in hrs Ø Credit Card Issuance earlier in Weeks to now in 1-2 days Ø Shift in Entertainment Sector from earlier CD Writing / DVD methods to watch the movie / shows now to OTT platforms (Amazon Prime / Spotify etc.) Ø Notes Making in Educations Sector – Earlier Manually by students to now instant as instructor / teacher is speaking Ø Medical – Waiting for a specialised doctor for a complex surgery now to done locally by videoconferencing / telephony techniques Ø Concept of Agile in Software Development Manufacturing : 1. Reduction in Machine Set up Time in Toyota to Single Digit Minute or a minute with SMED / OTED 2. Reduction in Plastic Moulding Set up Operations time 3. F1 Pit Stops 4. Computerised Colours Mixing as per Shade Card against the manual earlier 5. Designing of shapes / building as per 3D Printing than earlier manually in designing softwares

-
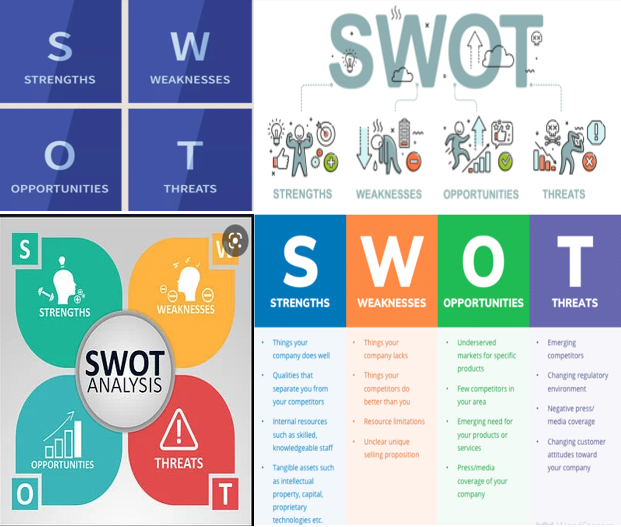
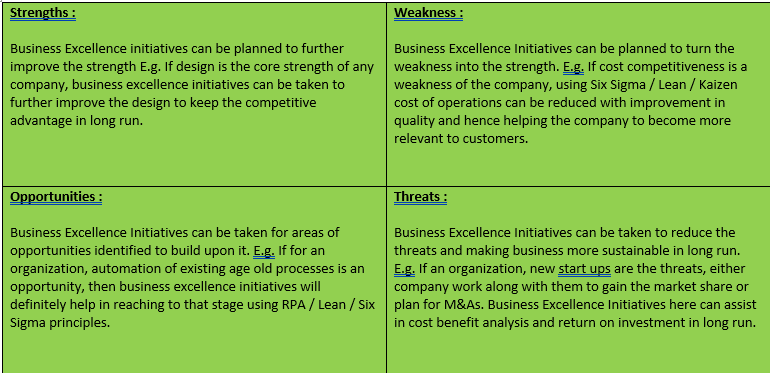
SWOT (Strengths, Weakness, Opportunities & Threats) Analysis is a very important and widely used tool in strategic planning across major multinational companies for doing the high level analysis with their competitors. This tool may help a person, team, organization and at all the levels to analyze on : Strengths : What you do well and give you an advantage over the others Weaknesses : What you don’t do well and put you at weak position compared to competitors Opportunities : Elements available in the environment which you can use to gain competitive advantage over the others Threats : Elements present in the environment which may cause troubles for the company in long run. Pictorial Representation of the Tool : Where this is tool is primarily used ? i) Strategic Planning ii) Corporate Affairs Planning iii) Marketing strategy Planning iv) New Products Launch v) New Mergers and Acquisitions vi) New Campaign Launch vii) New Policy Deployment viii) New Customer Segment Penetration etc. Limitations : i) SWOT Analysis may act as a starting point for strategic building overall, but does not tell us how to gain the competitive advantage. ii) In the rapidly changing environment, it may be challenging to perform and adhere to SWOT analysis with long horizon. iii) Sometimes putting too much focus on one strength may take the focus out from the weakness E.g. Focusing more on cost part may bring the quality down. iv) It may result in generating the too many ideas and put the one in dilemma which one to use v) This method does not prioritize the issues Example of SWOT Analysis in my company (a software major and IT giant) : How SWOT Analysis can be used for Business Excellence Initiatives? SWOT analysis can be used to identify the Strengths, Weaknesses, Opportunities and Threats of a particular business / domain / vertical / segment etc. and accordingly six sigma interventions can be planned in those areas as shown in below grid : Famous Companies used successfully SWOT Analysis to gain competitive advantage or even gained using it : Other popular tools / techniques similar to SWOT : PESTLE Analysis, Porter 5 forces Model, SOAR Analysis, Noise Analysis etc. So we see here SWOT Analysis lays the foundational stone for the Six Sigma initiatives and good and proactive organizations / companies with great vision build upon the areas surfaced out post SWOT analysis by their Business Excellence initiatives to gain the competitive advantage in short as well as in long run !


-
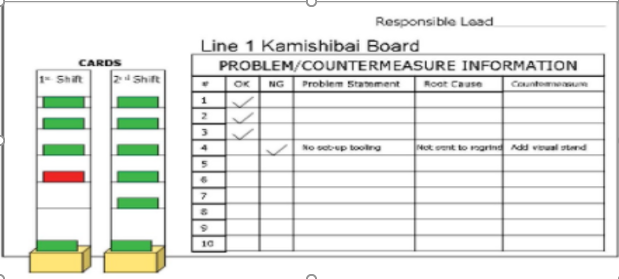
Kamishibai board is a visual control center in the workplace which is used for performing audits especially in a manufacturing process. A number of cards are placed on a board and ensures that the safety and cleanliness of workplace is maintained and that quality checks are being performed to ensure adherence to laid down processes. The Name Kamishbai has its origin to Japaneese traditional storyetelling practice where Children are taught to build up a mini-theatre and show the pictures as they tell the story as we see the storytelling supported by a storyboard in cards in Kamishibai concept / board. Kamishibai Cards look like the Kanban board in the manufacturing processes and Toyota is widely using this concept to do their daily / weekly / monthly audits of the processes. Toyota used this term 1st un 2006 at a seminar where emphasis was to how better track the day to day activities and guide people if something deviates from the planned output. Usage of Kamishibai boards found in tacking many processes / activities in manufacturing plant like production, maintenance, sourcing and procurement etc. Why Kamishibai is used ? Objective of using Kamishibai is not a fault finding process. The proper use of a Kamishibai is to train the mind and eyes of the involved person’s to see problems (deviations from the standard output), identify improvements even though these are small, and teach others also to see and solve these kind of problems. In Kamishibai framework, diligently completing the audits is also as critical to success of it as the result of the audit itself. The purpose is not to find the mistakes, however the problems should certainly be made visible. The purpose is to get into the habit of checking the important activities each day. The Kamishibai card is printed on both sides where one side is green and other side is red. To help the people who may be color blind, a symbol should be added to identify go (O) and no-go (X) conditions. How Kamishibai helps the Manufacturing ? Using the Kamishibai board, one can easily track and improve the daily / weekly / monthly conformance to the laid down standards. Like a supervisor for maintenance can use this method to track the critical maintenance activities checkpoints in daily / weekly / monthly basis and bring the problems to surface using this method. These boards are located very near to actual workplace. Kamishibai board is used during the Gemba walk by the leaders and this add more effectiveness and structure to the Gemba walks which may be aimless otherwise. Kamishibai systems specify the 5W1H (who, what, where, when, why and how) for confirming process standards. How Kamishibai can be helpful in Service Sector ? I can think of various standard processes which can be tracked, visualized and improved using the Kamishibai board : 1. Audits Planning and Tracking Process – Daily / Weekly / Monthly tracking of critical deliverables. 2. Administration - Daily / Weekly / Monthly tracking of transport, maintenance etc. E.g. Transport team may use it to day to day critical activities as below : 1. HR team may use Kamishibai dashboard in Recruitment function to track the candidate fitment for required profile. 2. SCM / Procurement team may use it for tracking the materials receipt / responsibility and their conformance to standards. 3. Internal IT teams may use this method to track incoming / outgoing / WIP faulty systems on day to day or shift to shift basis. 4. Software development may use the same to track day to day activities related to daily submissions to client / increment / work quantum they have to complete and same way critical deliverables for the month / week / quarter. Some of Famous Companies using Kamishibai : So if we see since Kamishibai is an effective tracking and improving tool, it can be used across sectors / industries for tracking day to day activities and to surface out the problems and improve the same by taking the counter actions on the same. The usage of this tool is independent of nature of sector (Manufacturing / Sector) as we saw.


-
RAPID Matrix is a tool to help in defining what during a project and emphasizes on the decision making roles. This tool helps in avoiding the ambiguity on who is responsible / accountable for in a particular project / endeavor. Who developed the RAPID Matrix and why ? This matrix was created by world renowned consultancy firm Bane Consulting to fasten te decision making process. Bane Consulting developed this matrix to accelerate the decision making as firm believed strongly that Performance and High Quality decision making goes hand in hand. In other words it may be said that high performance is strongly related to Quality of Decision Making (Fast / Accurate / Relevant / Long Term Vision etc.). Its depicted Mathematically as below: High Performance (PH) = f (High Quality Decision Making (QD)) RAPID Matrix assigns the key owner for each role and when the roles are clearly defined and delineated, the team / organizations / individuals are able to make decisions more accurately and swiftly. RAPID requires a lot of practice and discipline. Not every decision requires the level of effort and investment that goes into creating the RAPID roles. Successful adopters begin with the decisions that they rely on to run their businesses day to day. And, of course, to be effective, RAPID needs support throughout the organization: among its leaders, in its culture and as recognized part of its daily processes. RAPID® is a registered trademark of Bain and is widely used worldwide for decision making and fast tracking the same in any complex organization. What RAPID stands for? R – Recommend – Who should be recommending an action? A – Agree – Who all should agree before it can be moved forward? P – Perform – Who will be performing the actions required for implementation? I – Input – Whose inputs are required to check the feasibility? D – Decide -Who decides to bring decision to closure and channelizes the decision to implement? RAPID Matrix Diagram: Let’s see RAPID Matrix Implementation in Six Sigma / Process Improvement World: Let’s now understand what DACI Matrix is. DACI decision-making framework designed to improve a team’s effectiveness and velocity of the projects, by assigning the involved team member’s specific roles and responsibilities when it comes to group decisions. What DACI stands for ? D - Driver (the person who drives the decision) A - Approver (the person who makes the decision) C - Contributors (the people or teams whose knowledge helps in the project) I - Informed (the people which may be affected by decisions and therefore needs to be kept in loop or informed on the process changes etc. ). Who developed the DACI Matrix and why? DACI matrix was developed by Intuit and is considered to be a variant of the RACI Matrix. Application of DACI in Website Launch Process: Let’s see what can be DACI Matrix for Running Six Sigma Projects in an Organization: D - Driver – Project Lead / Process Expert (Who is doing the Six Sigma Project / guiding the project) A - Approver – Decision Maker (Process Owner / Sponsor can be Approvers) C - Contributor – Advisor (Project Mentor / Champion can be a Contributor) I - Informed (Team Members / Team Leaders / SMEs /etc. that will be affected by the process change post the project completion) DACI tool is very useful in making the fast / cross functional decisions and are usually used effectively in a complex hierarchy organization. What RACI Matrix is? RACI Matrix is a responsibility grid that maps every task or milestone or any key decision involved in completing a particular project and it assigns the roles those are Responsible / Accountable / Consulted / Informed during a project. R – Responsible (Person who is primarily responsible for doing the action) A – Accountable (Person who is accountable for outcome for action done by Responsible Person) C – Consulted (Subject Matter Expertise whose inputs can be taken / consulted during a project) I – Informed (Persons / teams who needs to be informed about the progress of the project / outcome) Lets understand the RACI Matrix for Six Sigma Framework Deployment Again: RACI Matrix Example for a Sales Strategy Formulation and Deployment: Lets now understand the Difference between RAPID / DACI / RACI by below table : So if we see overall, RAPID / DACI frameworks are focused upon strategic decision making and accelerating the decision making process, however RACI is more towards task oriented and pushing these tasks / milestones planned for completion within stipulated timelines.


-
Backcasting is problem solving and planning method that definies a desirable future state and then suggest to work in backward direction to attain that outcome. As forecasting is about predicting the future basis the current trend and variables performance; backcasting focuses on policies / techniques / ways to attain the desired future state. Backcasting is like setting a Goal for the future and work backward on it to attain the same in stipulated timelines. This techniques was proposed by John B. Robinson in 1990. Steps in Backcasting process : 1. Identify a Meaningful Problem to Solve 2. Define a Future State Solution that lives Outside of Today’s Constraints 3. Backcasting a Path that leads to a Future State Examples of Backcasting / Examples : Companies use backcasting techniques to define the vision more clearly and then work on it in an innovative way Linking this to Google GPS example. Define Problem : People who are new to a place find it challenging to get the correct address. Future State : Reach to destination without any hassles / challenge and on your own independently. Implement Backcasting : Developed GPS solution linking destinations via coordinates / satellites and given us that solution on our phone to be it more user friendly. Equipped it with Voice solution and alternative route suggestion using Machine Learning algorithms and concepts. Companies Successfuly used Backcasting Concept :


-
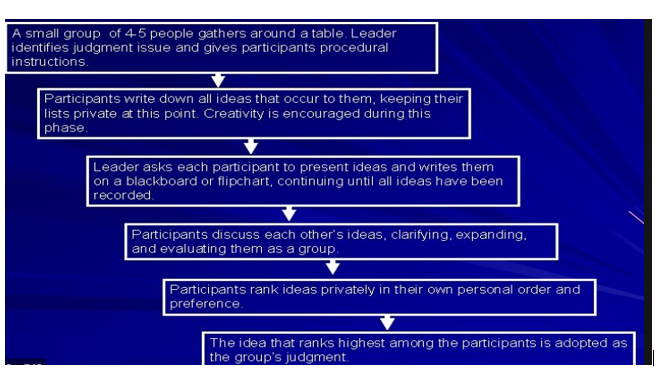
Delphi method was initially conceived in 1950s by Olaf Helmer and Norman Dalkey of RAND (Research and Development) Corporation. This name came from Oracle of Delphi, a priestess at a temple of Apollo in ancient Greece known for her prophecies. Delphi method allows experts to work towards a mutual agreement by series of questionnaires rounds and providing related feedback to further progress the discussion with each round. The experts' responses may change as rounds are completed based on the information put forward by other experts participating in the analysis. Flow of the Delphi method is as depicted hereunder : Key Steps in Delphi method: i) Facilitator selects the team of experts based on the topic being covered ii) Once all participants are confirmed, each participant is sent a questionnaire with instructions iii) Participants / Experts comment on each topic based on their personal opinions, experience, or previous research. iv) The questionnaires are returned to the facilitator who groups the comments and prepares copies of the information. v) Collected comments are sent to each participant and they can comment further on the same vi) At the end of each comment session, all questionnaires are returned to the facilitator vii) Facilitator decides if another round is necessary or if the results are ready for publishing viii) The questionnaire rounds may be repeated any number of times as necessary to achieve a general consensus. ix) Conclude the final result / outcome of the process In contrary to Delphi method, Nominal group technique (NGT) is a structured method for group brainstorming that encourages contributions from everyone and facilitates quick agreement on the relative importance of issues, problems, or solutions. Here the team members start by writing down their ideas, then selecting which idea they judge is the best. Once team members are ready, everyone shares their favorite idea, and the suggestions are discussed and prioritized by group using a point system. NGT consolidates the importance ratings of individual group members into the final weighted priorities of the group. When NGT is used ? · Some group members are much more vocal than other group members · Some group members has the tendency to think better in silence · There is concern about some members not participating in discussion · The group does not generate quantities of ideas comfortably · Some of the group members or all members are new · The issue is controversial or there is heated conflict or disagreement Steps in NGT : When Delphi Technique is preferred over Nominal Group Technique (NGT) : i) When the decision to be taken are strategic in nature and lot of scenarios and subjectivity is involved before reaching to the final consensus. E.g. Mergers and Acquisitions of companies, New Product Development, Foraying into new Geographies and segments for Existing Product Penetration. ii) Complex Problem which needs opinions from the experts from the different fields. E.g. Staring a new company, Choosing a career option, Doing a large investment in any company / sector. iii) When its not possible to interact face to face and experts are located across the different parts of the world. E.g. Building the vaccine during the Corona-virus pandemic, Organisation of any big event such as Olympics, Commonwealth games. iv) When there are severe consequences of the decision going wrong and there is no room of error. You want it right first time anyhow. E.g. Final of any big event like Olympics, World Cup, treatment of the patient in ICU / at last stage etc. v) When an innovative / new product to be launched within the shorter time period / timelines. E.g. Adoption of New technology – Mahindra moving to Electric Vehicle Segment, Amazon moving to E Commerce Sector / Cloud Segment with AWS etc.

-
ECRS is a lean method / approach for process activity optimization, and if use this by keeping 7 types of waste in mind and combination with other efforts such SMED, 5WHY´s or 5S it will be a wonderful tool to implement. For clear understanding we can use the other lean manufacturing tools such as VSM (Value stream mapping) to identify the steps which can be filtered for ECRS scope. ECRS, stands for : · Eliminate · Combine · Rearrange · Simplify 1. Eliminate – Here, it’s important to identify the steps that can be quickly eliminated or not adding any value to the end output or kind of Non Value added in nature. Usually elimination is done for the steps that results in a cost. Overheads, reworks, material costs, etc. are possible targets for elimination. The critical requirement of elimination is to obtain same process performance with an improved efficiency. Questions asked in elimination step : · What is the possibility to eliminate root cause/ basic cause? · What is the importance of this step? 2. Combine - When work cannot be completely eliminated, then try to combine them. Here, see if two steps can be merged together and made as one step in place of two OR if any one person can do both the steps in place of 2 persons doing 2 different steps. Though it is efficient to break down a process into the simple operations; excessive handling of documented information, materials, tools and equipment may add to more time to be spent in maintaining the same. Such situations can be identified and improved by simply combining two or more steps. So when analyzing ECRS, team must evaluate possibilities to combine process steps as relevant. Questions used in Combine step : · Is there any possibility to combining this step with other steps? · Can someone else can do this step ? · Can the same person/ same machine do several steps in operations ? 3. Rearrange – Here, see if we can change the order of the steps to make the overall process more efficient. Rearrange is the least feasible option in real world scenarios of applying ECRS to process improvements, due to initial process flow design analysis in PDCA cycle designing stage. Questions used in rearrange step : · What is the possibility to re-arrange this step in the process ? · What is the possibility to re-arrange process flow from the current state ? 4. Simplify – The Golden rule here regardless of the situation is to simplify the flow anyhow. Usually, we want to Eliminate first but, if not, then Combine, Rearrange, and Simplify will be really helpful. After the steps of Elimination, Combining, Rearranging are done, the step Simplify is taken up. Here, the over-all process level issues are examined first and then the detail of the operation is studied. Questions used in simplify step : · What is the possibility to make this step simple ? · What is the requirement of collected information from this step? · How do others do this step? · How will a layman look at this step ? Lets see a real life examples of ECRS : How these 4 steps are covered in Telecom Revolution (Landline to Basic Mobiles to Android Mobiles) : Eliminate : Mobile phones have eliminated several old items from our day to day life e.g. Camera, Wrist watches, Alarm Clocks, Calendar, Diary etc. Combine : In mobile phones, there are lot of places where in several activities which are combined under 1 utility e.g. Clock Utility. Here, Alarm, Stopwatch, Timer and Clock functions are combined under this particular app. Rearrange : In earlier cell phones, when you were changing your phone you have to manually transfer your data / contacts but now there are apps available which can copy data as is from your current phone to new phone and create a mirror image of your data . So this step of data transfer is rearranged / redesigned. Also in earlier phones there was no favorites / option to add frequently used apps on home page and with the passage of time those things have been re imagined and rearranged. Simplify : Usage of dictionary and Auto-suggest of words has made the typing activity more simpler than it was before. Few Examples from Different Sectors / Companies using this approach :


-
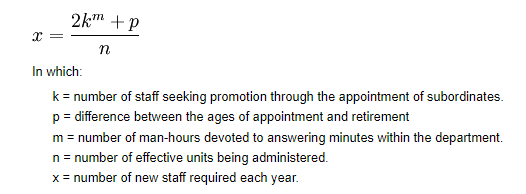
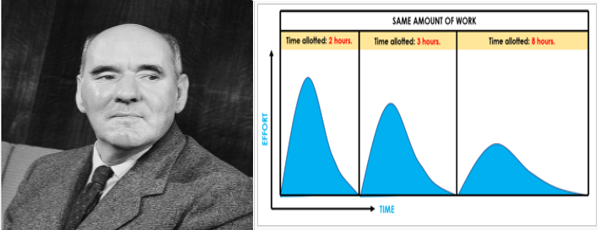
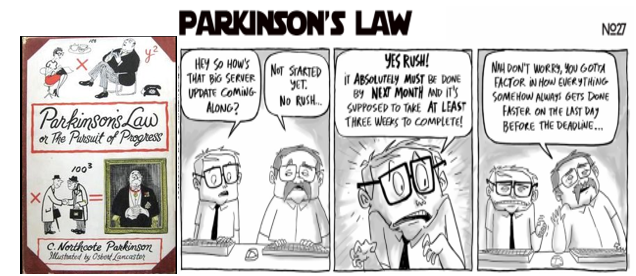
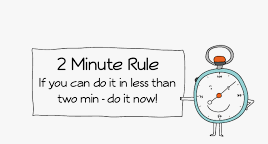
Parkinson's law is known for its famous statement i.e. "work expands so as to fill the time available for its completion". This law is also applied into growth of bureaucracy in an organization. Cyril Northcote Parkinson published this law in one of his famous books i.e. The Economist in year 1955. Current form of the law is not the one to which Parkinson referred initially, but rather it was a mathematical equation describing the rate at which bureaucracies expand over the period of time. The thought that triggered this law was “Increase in the number of the employees at Colonial Office of British empire though there was considerable decline in the number of colonies that the office has to administer. He thought over the same and explained this growth primarily due to 2 reasons i.e. i) An official wants to multiply the subordinates, not rivals and ii) Official make work for each other. He also noticed that number employed in a bureaucracy increased by 5-7% per year though the work has not increased at all or even if decreased as depicted in formula below : The Law not only applies to individuals, but also teams, organizations, armed forces, universities, corporations etc. Famous Corollaries derived from Parkinson’s law : i) Work complicates to fill in the available time ii) If you wait until the last minute, it only takes a minute to do iii) Work contracts to fit in the time we give it iv) In the world of computers , Data expands to fill the space available for storage v) In corporate offices, In ten hours a day you have time to fall twice as far behind your commitments as in five hours a day Examples / Evidences of Parkinson’s law in day to day tasks / events : i) An elderly lady can spend a whole day merely composing and sending a postcard. An hour spent to find postcard, another hour in looking for spectacles, an hour and a half in composition of the same, and another thirty minutes in deciding whether to wear a coat or not when heading to the postbox. However a busy person could complete the same task in a few minutes. ii) Sometimes we see this also in the game of Cricket, teams usually play all the overs (50 overs) even to chase a small target (200 / 250 runs) and in T20-T20 they make same runs in 20 overs as well. Again Parkinson coming into the play here. iii) In a construction projects, if Labor is per day basis, same amount of work takes almost double of the time than the contract basis work. Clearly Parkinson coming into picture. iv) In Engineering degree / programs, students cover the same amount of syllabus at last night of the exam that was supposed to be done in the complete semester. v) During Deepawali / festivals, if we start cleaning / decorating our houses 2 weeks before or 2 days before, there would be almost same amount of the output / result that will reflect at the day of Deepawali. vi) We see often in Bollywood movies or typical Indian serials that they keep on pulling the story too much to either complete the 3 hours of movie or to extend to the maximum episodes in a serial. Again, Parkinson law is writing its script here. vii) During travel to a particular place, we see sometime we take more time than required but same distance in case of any emergency or if less time is available gets traveled in lesser time too. Again it’s the Parkinson effect ! viii) In consulting assignments, if the billing is per day basis, team take more than required time to complete the same amount of work / assignment than they take if Billing is fixed / assignment. How to use Parkinson’s law to Improve the Team’s Productivity ? i) Make deadlines for everything for the completion e.g. all the activities in project. ii) Break down your project into tasks and Measure the each activity time that it normally take to complete (Industry sources, estimation techniques e.g. Planning Poker in Agile etc., surveys etc.) like we normally do in project management as WBS (Work Breakdown Structure) iii) Allocate the time to team as per the realistic time it takes and do not allocate without any logic or basis the instincts but there shall be some measurement in place. Scope of work must be clear. iv) Track the time taken by the team to complete the tasks. v) Take small breaks to improve upon the productivity and keep yourself aligned to activity. vi) Make your team aware what is the definition of done or the completion vii) Challenge the tea and Next time, when you give the same activity to team, reduce the time to half to complete the same activity and you may offer the incentives to do the same or early finisher will get the high incentives – Constantly push the team for higher efficiency. viii) You will wonder that the team is able to complete the same in half of the time than they took initially and also learning curve is coming into picture. Also, the team wont be distracted by the distractions around as they have a tight deadline in hand. ix) It shall be clear to team what to do next or task to pick up post completion of a task. Ways to improve Productivity : i) Time Boxing : It’s important that you focus on time instead of tasks. This concept is known as time boxing. It involves setting / allocating a particular amount of the time to work on task, regardless of complexity. Tesla CEO Elon Musk uses this strategy to get more done in less time. He’s famous for his ability to handle / juggle between multiple projects and accomplish his goals despite of his quite hectic schedule. ii) Tow minutes Rule : This is a basic rule of the Getting Things Done (GTD) method, created by productivity consultant David Allen. It works on the principle that any task we can perform in less than two minutes must be completed immediately, rather than be scheduled or postponed. iii) Follow Pareto Principle , ABC techniques for prioritization of your tasks Its rightly described by Parkinson in below sentence : “It is not the business of the botanist to eradicate the weeds. Enough for him if he can tell us just how fast they grow” - C. Northcote Parkinson

-
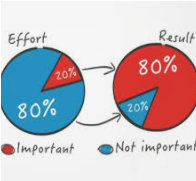
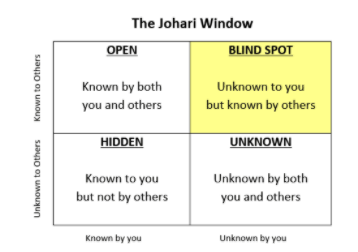
Blindspots analysis is a method to surface out the old, partial, or wrong assumptions in a decision maker’s mental scheme of the environment. Michael Porter used the term "blind spots" for referring the conventional wisdom which no longer holds true, but which still guides the business strategy. This concept / technique was further explored and popularized by Barbara Tuchman, in her book The March of Folly (1984), to describe political decisions and strategies which were clearly wrong in their assumptions. How to uncover the Blind Spots ? Despite the fact that organizations do careful research before making any decisions, it can still go wrong. Often, something important is missed or alternative options are not considered and, as a result, wrong / not best decisions are made. In many cases, so called 'blind spots' are not taken into account while making the decisions. Ben Gilad proposed 3 step "Gilad method" to identify the blind spots in his book named Business Blindspots. Step 1 : Conduct a Porter’s Industry Structure i.e. 5 force analysis on a given industry or market, augmented with identification of possible change drivers, which are defined as trends with the potential to have considerable effect on the balance of power among the five Porter forces. Step 2 : Collect competitive intelligence on the target company’s top executives assumptions regarding the same industry structure as in Step 1. Sources of the information may include annual reports, letters to shareholders, autobiographies, interviews in the press, public appearances and speeches, industry meetings, conference calls with security analysts etc. and all other statements regarding vision. Step 3 : Compare the results of Step 2 with the analysis in Step 1. Any contradiction with the analysis in Step 1 may be a potential blindspot. Also, Johari Window concept also touches upon these blind spots as depicted below and describes the blind spot as an area which is unknown to you but known to others. Why blind spots occurs and examples ? I. Top leaders are completely ignorant of strategically important issues. E.g. Yahoo Search Engine vs Google Search Engine, IBM Failure to capture Personal Computer Market. II. Top management may be aware about the strategically important issues, but they do not interpret them correctly. E.g. Ebay merger with Skype, Blackberry Phones failed to capture touch screen market, Macy’s failure to move to digital selling space, Failure of Polaroid Cameras to move from Print to Digital Photography, Motorola failed to sense the 3G movement / upgradations required in their phone softwares. III. Leaders are aware of problems being caused by outdated assumptions and interpretations but discovers these problems too late and as a result of it they also acts too late. E.g. Kodak, Nokia, Xerox etc. failed to sense the changes in market trend at earlier stages and which caused huge loss to their businesses. Companies who understood the Blind Spots quite early and build upon it to gain the huge success : Underlying assumptions: Blindspots Analysis is an assumption about biases of decision making at top of the organizations (business, government etc.) exceeding views / thoughts of their subordinates or outsiders. While the top executives in business and government organizations are smart, intelligent, and capable people, they are also vulnerable to several decision biases that come with powerful positions, including cognitive dissonance, overconfidence, and sometimes ego-involvement. The impaired ability of leaders to see reality for what it is, and the more objective analysis of analysts and mid-level planners means that Step 3 of the Blindspots Analysis can be very effective and powerful method for pointing to potential blind spot. What are the sources of Blindspot ? i) Invalid assumptions – such as corporate myths or other unchallenged assumptions E.g. If my cost is low, I will get the more business. (Quality is not important) ii) Winner’s curse – or a belief that investment will always be valuable. E.g. If I buy a new property in a particular area, prices will always go up. iii) Escalating commitment – when a company doubles down on a particular plan to its detriment. E.g. Company doubles the manpower thinking it will yield more profit and ignoring the other angles say skills, machines, efficiency etc. iv) Constrained perspective – Where gains and losses are assessed individually, and not as part of a larger picture. E.g. If I take up the new job, I will get these many benefits and If I don’t take I will loss this much money but ignoring the future growth and evolution points. v) Over-confidence – encompassing confirmation bias, an illusion of control, or a belief that past performance is a predictor of future success. E.g. If I work for 9 hrs, I will get the good rating but same may not be true in new normal and you may need to work more and learn new things too. vi) Information filtering – where failure is not seen as a learning experience. This also occurs when a diverse range of opinions is not considered when making decisions. E.g. You started a project late in past and that’s why you were not able to deliver the same to your customer ontime and again this time you are repeating the same mistake. vii) Reasoning by analogy – or decisions based on a limited sample set or anecdotal evidence. E.g. You are predicting the performance of a QA with 2-3 samples out of 100 samples which may not be true replica of his / her performance. Sample size may needs to be increased. viii) Groupthink or herd mentality – an effect where a group makes a safe and conservative decision that is sub-optimal. E.g. As a group, sometime we decide not to change and stick to old way of driving the things say Appraisal ratings on excel with limited criterion which may not work in environment / workforce dynamics changing at a faster pace.


-
FIFO and LIFO are methods used in the cost of goods sold calculations in financial accounting. FIFO stands for First in First out and it assumes that the oldest products / materials / items in a company’s inventory have been sold first and goes by those production costs. However contrary to it, The LIFO stands for Last In First Out and this method assumes that the most recent products in a company’s inventory have been sold first and uses costs of recent products instead. These methods are used to manage assumptions of costs related to inventory, stock repurchases (if purchased at different prices), and various other accounting purposes. Below diagram clearly explains the difference between the two methods : If we want to understand LIFO and FIFO concept in Day to Day activities, Imagine a Railway Ticket counter for FIFO : (Person who gets in queue 1st is the 1st to get out normally ) However imagine a Ticket Checker following the concept of LIFO i.e. The Person who got into the train last shall be checked for ticket 1st (As probability of not having ticket is high). Lets understand the difference between the two methods and benefits of each one of these with Financial Aspects now ! FIFO (First In First Out) : In FIFO method, oldest inventory items are recorded as sold first (but this does not necessarily mean that the exact oldest physical object was tracked and sold). Here, the cost associated with the inventory that was purchased first is the cost expensed first.A company might use the LIFO method for accounting purposes, even if it uses FIFO (First In First Out) method for inventory management purposes (i.e., for the actual storage, shelving, and sale of its merchandise). E.g. If a company that sells many perishable goods, such as a supermarket chain, is likely to follow the FIFO method when managing inventory so that goods with earlier expiry dates are sold first and goods with later expiry dates thereafter. However, this does not mean that same company can not use LIFO method for accounting for its merchandise management. While using the FIFO method, the cost of inventory reported on the balance sheet represents the cost of the inventory which was purchased most recently. FIFO most closely represents the flow of inventory, as businesses are likely to sell the oldest inventory first. Lets see this with example as below where say company XYZ has following inventory in had of 600 units those were purchased at different point of time with cost as mentioned : Number of Units Cost (INR) 100 units (1st) 100 INR 200 units (2nd) 150 INR 300 units (3rd) 200 INR Now say company sells 550 units and then the company would expense the cost of 1st 100 units at 100 INR (Lot 1) and next 200 units at 150 INR (Lot 2) and remaining 250 units at 200 INR (Lot 3) using the FIFO method. So here the total cost of Sales will be (100*100) + (200*150) + (250*200) = 10000 + 30000 + 50000 = 90000 INR. And cost of remaining inventory i.e. 50 units (600 total – 550 sold) will be calculated as per cost / unit for the latest lot i.e. 50*200 = 10000 INR and hence the balance sheet will show this amount as Inventory Value. As per FIFO method, company will have low cost of goods sold and high inventory value and therefore profits here will be shown as high (Profit = Sales – Cost of Goods Sold) due to lower cost of Goods sold and hence company will be liable to pay higher taxes. LIFO : (Last In First Out) In this method, most recently produced items are recorded as sold first. From 1970s, some U.S. companies shifted towards the use of LIFO, which reduces their income taxes at the times of inflation, but International Financial Reporting Standards (IFRS) banned LIFO method and hence more companies returned to FIFO. LIFO method is used only in United States and it is governed by the Generally Accepted Accounting Principles (GAAP). Section 472 of the Internal Revenue Code throws the light on how to use the LIFO method. In the example above, company XYZ using LIFO would expense the cost associated with the first 300 units at 200 INR, next 200 units at 150 INR, and the remaining 50 units at 100 INR. Under LIFO, the total cost of sales would be = (300*200) + (200*150) + (100*50) = 95000 and the ending inventory would be calculated as follows : Remaining 50 units = 50*100 = 5000 INR, so here the balance sheet will show 5000 INR as Inventory value in contrary to 10000 INR using FIFO and profit here will be shown as low due to higher cost of Goods Sold and hence the company would be paying the less taxes here than using the FIFO method. The difference in value of inventory calculated using the LIFO and FIFO methods is called as LIFO reserve which is 10000 INR – 5000 INR = 5000 INR in this example and This reserve is the amount by which company’s taxable income has been deferred by using the LIFO method.As a rule in the United States, publicly traded entities which use LIFO for taxation purposes must also use LIFO for financial reporting purposes as well and such companies should report LIFO reserve to its shareholders. Examples of the Companies that use LIFO method : (US Only) General Electric, Walmart, DOW, Caterpillar and ExxonMobil etc. Examples of companies that uses FIFO method : Sectors Prefer to use LIFO Methods : Where there is high difference in prices of goods / materials purchased) i.e. Petroleum, Pharmaceuticals , Retail etc. Sectors use FIFO Method : Where the Shelf Life is quite less and not much variation in Prices on daily basis. E.g. Dairy Products, Fruits and Vegetable Vendors, Courier Services etc. So in nutshell, Companies use LIFO to take tax benefits and to trade off the inflation effects on profits in highly price volatile industries. However, this is used in US only as its banned everwhere else. FIFO is worldwide accepted and simple and clear method of accounting and largely companies use this only.


-
The Cynefin framework is a conceptual framework used to aid the decision-making process. This framework was created in 1999 by Dave Snowden while working at IBM Global Services; it has been described as a "sensemaking device". This word means habitat. Cynefin offers five decision domains—obvious / simple / clear, complicated, complex, chaotic, and disorder—that help managers to identify how they perceive situations and make sense of their own and other people's behaviour. Simple / Obvious / Clear This domain represents the "known knowns" which means there are certain rules in place, situation is also stable, and the relationship between cause and effect is also clear : if you do X, expect Y. The advice in such a situation is to "sense – categorize – respond”: establish the facts i.e. Sense, Categorize, and then respond by following a rule or applying any best practice. This is the domain of legal structures, SOPs etc. E.g. AHT (Average Handle Time) at a helpdesk is recorded high (Sense), Identify which type of calls are taking more time (Categorise) and create some SOPs / Scripts or templates against those type of calls to get these over faster. Here, managers must avoid of forcing situations into this domain by over-simplifying, or by becoming complacent. When success breeds complacency ("best practice is, by definition, past practice"), there can be a dangerous clockwise shift into the chaotic domain. Complicated This domain consists of the "known unknowns". Here the relationship between cause and effect requires some analysis or the expertise; there are a range of right answers. The framework recommends "sense, analyze and then respond": assess the facts first, analyze, and apply the appropriate good operating practice. Here, it is possible to work rationally toward a decision, but doing so may need the refined judgment and expertise. This is the area of engineers, surgeons, intelligence analysts, lawyers, and other experts. Artificial intelligence also copes up well here: Deep Blue plays chess as if it were a complicated problem, looking at every possible sequence of moves. Complex The complex domain means "unknown unknowns". Cause and effect can only be deduced in retrospect, and usually there are no right answers as such. This process as per Cynefin is "probe–sense–respond". E.g. Stock Market Investments. You may invest in the stock market basis the past performance of the share, market indices (probe), sense the future prospects and finally make the investment. But there are no right answers here as such. Chaotic In this domain, cause and effect are unclear. Here the events are too confusing & pressing to wait for any knowledge-based response”. Action and any kind of action is the first and only way to respond appropriately and then sense and respond. Here, immediate action is not to discover the patterns but to stop the the bleeding immediately. E.g. Corona virus Wave 2 eruption in India. Government has to take action 1st i.e. Impose immediate Lockdown / Mask / Sanitization guidelines / travel restrictions etc., Sense the effects of these measures over a period of time and then respond the crisis created by available health infrastructure. Disorder / Confusion This domain in the center represents situations where there is no clarity about which of the other domains applies in this situations. Here, we must break down the situation into further smaller parts and then assign each to one of the other four domains. Leaders can then make decisions accordingly. Applications : This framework has wide applications and can be used in: · Policy-making · Product development · Markets · Supply chain management · Branding · Software Development · Emergency Management Some critics find this framework too difficult and confusing overall as it needs a more rigorous base / foundation, and also it covers too limited a selection of possible contexts. Also there is another criticism is that terms used in this framework such as known, knowable, sense, and categorize are not very clear and creates ambiguity while applying the same in practical scenarios.

-
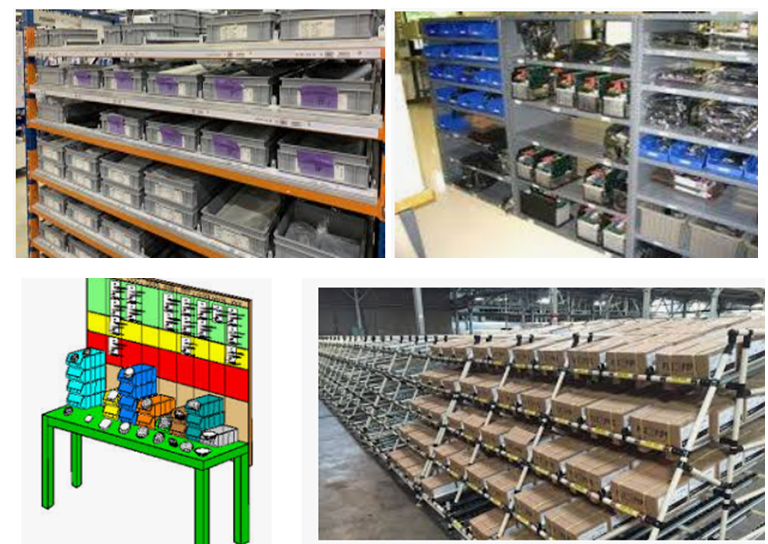
The term supermarket in lean six sigma refers to a predetermined market or space to be used for storage / inventory. The supermarket carries the necessary "supplies" for a work area that is close to it. When a customer (internal / external) needs an item they can take the same from the supermarket. The supermarket then replenishes their supplies based on the downstream demand. Supermarkets prevent overstocking and help to lower the inventory levels. Supermarkets normally are located near the supplying process to help that process see customer usage and requirements. Each item in a supermarket has a designated location from where a material handler take out the products in amounts needed by the downstream process. As an item is removed, a signal to make more or to replenish (such as a kanban card or an empty bin) is taken by the material handler to the supplying process. Toyota implemented first supermarket in year 1953 in machine shop of main plant. Toyota executive Taiichi Ohno got the idea of the supermarket from photos of American supermarkets showing goods arrayed on shelves by specific location for withdrawal by customers. A supermarket is nothing but a series of parallel FIFO (First in First Out) lanes sorted by product. This term in manufacturing originated from the normal retail supermarket. The key of a supermarket (both retail and manufacturing) is that taking out any part or product gives a signal to replenish this part (via Kanban). Therefore, a supermarket also aims to keep all the required parts in stock, while at the same time avoiding overproduction. Diagram of a Process with Supermarket (ꓱ) : Diagram of a Process with Supermarket at 3 different locations i.e. close to Supplier, close to Customer and between the processes : How Supermarkets Look like in real? When to use Supermarkets? i) Use Supermarkets when there is difference in lot sizes at different processes ii) Use Supermarket if Material Flow Splits Up into Different Directions iii) A supermarket is also strongly recommended if two processes have very different cycle times. iv) Use Supermarket when there are different shift patterns v) Use Supermarket when next process creates different variants of the product vi) Use Supermarket if there is merging of the material flows vii) Use Supermarket when there is large distance between the processes viii) Use Supermarkets in case of very high demand on flexibility and Reaction time ix) Use Supermarket whenever there is change in responsibility Characteristics of a Good Supermarket: i) Supermarkets must aim at reducing the overproduction and inventory in the process where it’s not possible to eliminate the inventory completely or deployment of the one piece or continuous flow ii) Supermarket must work on a pull system i.e. as and when signal is received to replenish the supply at process or by customer via a Kanban, it should be able to supply that demand and at the same time supplier also shall be able to replenish the goods consumed in supermarket. iii) A good supermarket must be able to supply the right quantity of goods at the right time and there shall be sufficient stock of material / goods to meet the customer’s demand iv) Supermarkets should be close to close to Supplier / Supply Source so that immediate process / processes can take the material or supplies needed for doing the operations at that process OR Supermarkets can also be close to Customer as well so that customer may take up the finished goods as required from the supermarket. v) A good supermarket must aim to develop a continuous kind of flow and shall not allow any disruption in the operations / production by maintaining the adequate quantity of products / materials / parts for the downstream process vi) A good supermarket shall be sensitive to customer demand / process demand and shall be able to replenish the stock as per stakeholders / process requirement by usage of technology say RFID at Amazon / Kanban in manufacturing vii) A good supermarket shall have place for everything and everything at its place i.e. it must follow the principles of 5S, Lean, JIT etc. viii) Visual Controls / ANDON / Signage / Labels can be used in a supermarket to make it more structured / easy to refer


-
Obeya, in Japanese means “large room”, involves bringing together various departmental leaders in the organization to focus on big picture issues involved with a single project or initiative. Creating an Obeya room is similar to creating a “war room,” a command center that brings together leaders from across departments in an organization. Basketball game offers a suitable analogy to Obeya. A basketball team has three-point shooters, defensive specialists, and mid-range shooters, those who work “in the paint” near the basket, and players who see the whole court well and distribute the ball to other players so they can score in match effectively. Each player has their own skill sets and work hard on perfecting them. However, to win, a smart coach practices the team together, building upon their skills to create an effective team. Philosophy behind obeya comes from Lean. Ultimately, everything must focus on how the final product – the result of different specialists working together – creates value for the customer. How this concept of ‘Obeya’ Originated ? This concept originated in Toyota while production of its one of its famous and innovative model i.e. Prius in 1990s. Chief Engineer of the G21 (Global 21st Century) project for Prius at Toyota, Takeshi Uchiyamada “felt that he lacked the necessary authority to make the optimal decisions, and thought he could be overrun by experienced discipline leaders in a way that was not optimal for the project as such”. He realized that to create the new car in a compressed timeline, he must integrate the efforts of diverse experts in engineering, design and production – everyone who had a contribution in the final product. Eventually, the meetings started to include people from the other domains too, such as representatives of marketing and sales. He met with leaders from each area two to three times a week, with the number of meetings increasing as the project deadline approached. Using the concept of Obeya, Prius reached the market 15 years ahead of the competition and remained a market leader in electric vehicles for over a decade. This huge success achieved using Obeya drew the attention of another industries and other Businesses leaders and they started using this concept in their respective organizations. Famous companies using the concept of Obeya now are : Toyota, Nike, Boeing, and Volvo. How Obeya is formed ? During the product and process development, all individuals involved in managerial planning meet in a "great room" to speed up the communication and decision-making process. This is intended to increase efficiency and bring a better information flow to the project. Often associated in product development, an Obeya room can also be a place for software development, a command center, managing new business strategy, workflow and project management during a new software or a business platform development. This tool motivates people to work together without any distractions and creates a great atmosphere to generate new ideas. Similar to traditional “war rooms,” an Obeya will contain visually engaging charts and graphs depicting such information as program timing, milestones and progress-to-date etc. . In some companies, they term it as an iObeya or Adrenaline Room. iOberya is a virtual digital Visual Management Platform which mimics the Obeya room atmosphere / layout virtually. Key components of the Obeya Room includes Charts, Graphs, A3 Sheets, Visual tools like signage, Labelling etc. Sample layout of Obeya Room as below : OKRs (Objectives and Key Results) for Obeya : i) Rapid Decision Making ii) Reduction of Rework iii) Avoidance of Unnecessary Discussions iv) Better Information Flow in Organization / Across Departments v) Quick Ideas Generation vi) Savings on Efforts and Cost vii) Removal or reduction of 7 kind of Wastes as per Lean (WORMPIT / TIMWOOD) and Waste of Intellect too Key Benefits to Organization post Obeya Creation : i) Improvement in Team Efficiency : A project’s leadership team can save time by bringing helpful visuals, necessary information, and vital resources together in one place which results in effective collaboration and resulting into team efficiency. ii) Focus : Having key team / functional members in the same room for discussions means that project leaders can focus on the right issues iii) Working Together : An Obeya fosters an environment in which employees can work together across the disciplines and in real-time, rather than connecting via e-mail or in rushed meetings Key areas those can be improved in an Organization using Obeya Concept : SLAs / KPIs Performance Customer Satisfaction Financial Performance Employee Satisfaction Infrastructure Improvement Technological Upgradations Employee Recruitment Timelines etc. Physical Obeya Limits : One drawback of the physical Obeya is that the Obeya Room is not suitable for an international team or remote working team. If someone can’t be there in-person, it becomes difficult to include them in the meeting via a webcam because the practicality of an Obeya Room is to interact live and view the different panels. So to sum up, given the above Obeya Benefits, its is imperative that organizations and specially the large organizations must use the concept of Obeya to improve the interdepartmental communications and to improve the decision making process. Since in large organizations, sometimes departments work in silos and information flow from one department to another is not proper which causes rework and delay in decision making too often. Hence it’s recommended that large organizations must use the concept of Obeya to improve the trust, focus, communication, work visibility, clarity of thought process etc. between the departments.


-
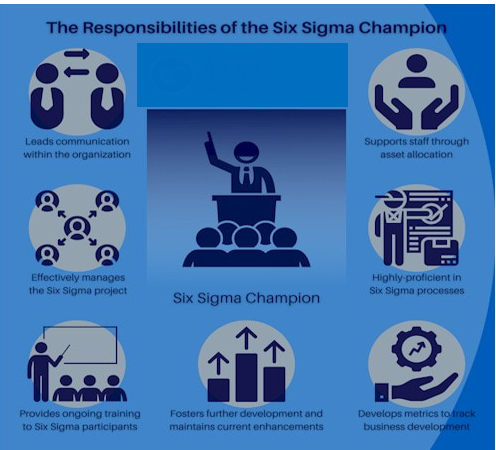
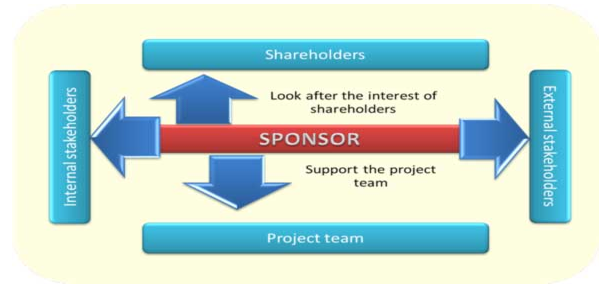
Yes, its necessary to have a sponsor and a champion for a successful lean six sigma program or a project as per the key deliverables and expectation from both the roles. Lets 1st understand these roles and sum it up at the last with an example. What is a Six Sigma Champion ? The Six Sigma Champion is an individual who translates the mission, vision, and values into a Six Sigma deployment strategy which supports the goals of the company. They do the same by determining which projects to deploy and identifying resource needs and removal of roadblocks if there are any. Six Sigma Project Champions drive the performance of project black belts and green belts and are responsible for the outcome of Six Sigma projects under their guidance. They communicate the link between Six Sigma and the business strategy and identify the black belt and green belts for the projects based on skillsets and requirements of the project. The Champion plays a significant role in the success of a Six Sigma project, typically approving, reviewing, or managing the project by providing the resources, eliminating bottlenecks, and diffusing the conflict. The champion is not expected to do a project, but they are expected at a high level to have detailed understanding of the process and also the requirements of Six Sigma. The Champion is expected to have the process as well as Six Sigma knowledge at the level that they can explain a project to both Six Sigma belts and executive leaders. The Champions play a very important role in a successful Lean Six Sigma initiative. They act as mentors to project teams and also a bridge between black belts and the organization top management. Without champions, efforts can become entangled with internal bottlenecks, become misaligned with core business objectives, lose focus and track of time, and may not yield expected benefits. Champions are typically members of the leadership group who sponsor projects and mentor teams working on those projects. To be effective in their roles, champions must be trained in the essentials of the Six Sigma Methodology. Project Sponsor: When you're doing a Six Sigma project, you must have a Project Sponsor. A Project Sponsor is, finally, the person responsible for the project and it usually is a senior manager / senior person in system. the Project Sponsor is the person who: - Defines the goals and objectives of the Six Sigma project; - Evaluates the results of the project at the time of closure - Signs off the resources those are needed for the project. Below Diagram in nutshell explains the coordination done by the Project Sponsor with Leadership as well as project teams. Sponsor role in a Six Sigma project is to make sure that everything is on track in order to the project to be completed successfully. Sponsors are key stakeholders in any Project as they determine the success of the Project. This indicates that the roles and responsibilities of the Sponsors are equally important and challenging. Key Responsibilities of a Project Sponsor: · To identify and review a project that would benefit the organization and ensures that it is aligned with the company’s business goals and strategies. · Ensure that right team members as per the project requirement are selected for the project. The Sponsor works with the Project Leader and other stakeholders to get the right Team Members. · Keep track of the Project and ensure that it progresses without any kind of bottlenecks. The Sponsor shall review the Project Plan and contribute towards successful planning and progression of the Project. · Be a link between the Project Members and organization’s other stakeholders and get the required buy-in required for smooth movement of the Project. The Sponsor should be at a level where he has high influence on the other stakeholders and good hold on the Process Owners. · Approving any financials that are required for completion of the Project. The Ownership of a Project success primarily lies with the Sponsor as they have to deal with all the financial loss/gain and therefore a financially sound stakeholder is suitable for this role. · Should ensure that the completed Project is handed over to the Process Owners back and shows sustained improvements over the period of time. E.g. : A six sigma design project is taken up to improve the speed of an existing age old internal employee management portal built on an obsolete technology. So lets see here the role of the project sponsor and champion. Here the project sponsor will approve the budget for new technology, infrastructure, people, consultancy etc. as required for building up of the new portal or upgradation and also communicate the advantages of the new system over the old system to the leadership team and once the new system is developed, handover / takeover process is smooth from the development team to operations team / end users. If during the development of new system, any bottlenecks are encountered say less time / budget available to team, then the sponsor will negotiate the same and get the required approvals from the top leadership. Project Champion here will translate the vision / mission of the senior leadership which in this case may be to provide better user experience quickly into the six sigma project i.e. to improve the downloading speed of the existing employee portal. So accordingly the six sigma champions align the technical resources /six sigma belts for the project who will do the necessary analysis using the DMAIC / DMADV methodologies and champions / leaders will be responsible for the final outcome or end objective of the project is achieved i.e. improve the downloading speed of the employee portal. Hence, if we see here the sponsors if are responsible for removing the financial obstacles in a six sigma Programme and champions are responsible to communicate the six sigma language to top leadership in a language that others are able to comprehend and allocating the necessary resources for the project other than financial resources.
-
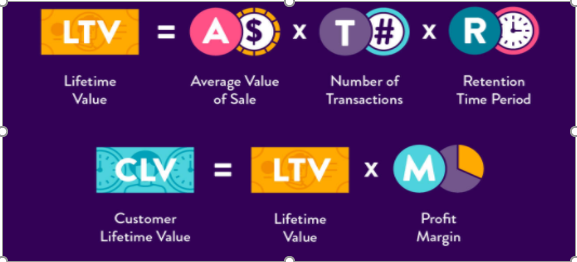
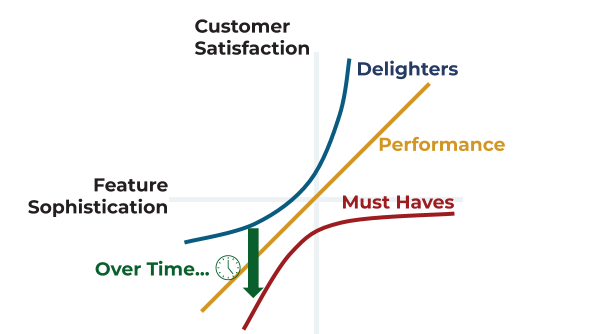
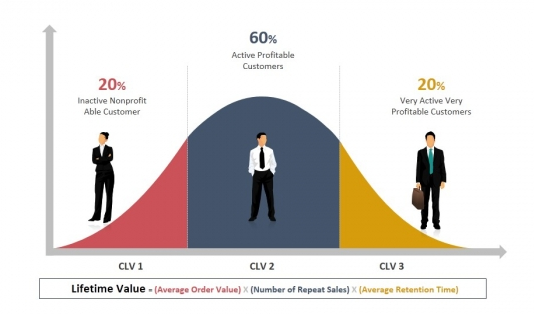
Customer lifetime value (CLV) is the metric that indicates total revenue a business can reasonably expect from a single customer account throughout the business relationship, and it is one of the key metrics that any organization must measure and focus upon to maximize to stay relevant in competition. Businesses use customer lifetime value to know which customer segments are most valuable to the company and where they shall put their efforts proportionately to yield maximum return to business. The longer a customer buys something from a company, generally the greater their lifetime value is. This metric is targeted by the customer support teams / success teams and their aim is to maximize the CLV because it is often said that cost of acquiring a new customer is 5 to 10 times more than retaining the existing customer and hence the customer loyalty and retention is of so much importance to any company. Why CLV is so important to a Business ? i) It directly affects your revenue ii) It boosts customer loyalty and retention iii) It helps you target your ideal customers iv) It reduces customer acquisition costs (depicted below) How to Increase CLV ? i) Improve the customer on boarding process ii) Provide Value Added Services to Customers regularly iii) Offer High end Customer Service and 24*7 support (Chat / Social Media / Bots etc.) iv) Build Customer relationship v) Listen to Customer Feedback vi) Detect pain points early and provide solutions vii) Offer Personalized experience to your customer viii) Digitize the customer connects / interactions ix) Offer easy billing cycle / payment plans x) Do the up selling / cross selling with loyal customers xi) Increase the quality / value of your product / service and price in proportion xii) Increase your average order value xiii) Under promise and Over deliver xiv) Focus on delighters as per Kano model (picture below) Example of Customer Lifetime Value : i) Travel Booking companies / portals often track and focus on CLV as : CLV = Number of trips* Avg, Spending per Trip* # of years associated with company E.g. Make My Trip.com, Yatra.com, GoIbibo.com etc. ii) Food Chains companies / portals often track and focus on CLV as : CLV = Number of customer visits* Avg. Spending per Visit* # of years associated with company E.g. Mcdonald, Starbucks, Pizza Hut, Chaos, Grofers, Bigbasket etc. iii) Retail Chains / portals often track and focus on CLV as : CLV = Number of customer visits at store* Avg. Spending per visit* # of years associated with retail chain E.g. : Spencers, Future Group, Pantaloons, Lifestyle, Home Center etc. To conclude, for increasing the CLV, companies provide excellent customer service, promotions, gifts, loyalty schemes / bonus points etc. and try to maximize the CLV as much as possible. Six Sigma Projects on NPS Improvement / CSAT improvement / Reduction of the customer complaints / concerns etc. focus on improvement of CLV by retaining the existing customer and providing them the excellent customer service. Also, if your CLV is low it may result into loss for the business in long run as lost customers / dissatisfied customer will not only hit the revenue by disengaging themselves from your organization but also the dissatisfaction / bad experience felt by them can lead to bad publicity / negative marketing of your organization and loss of new customers / prospects in long run.
-
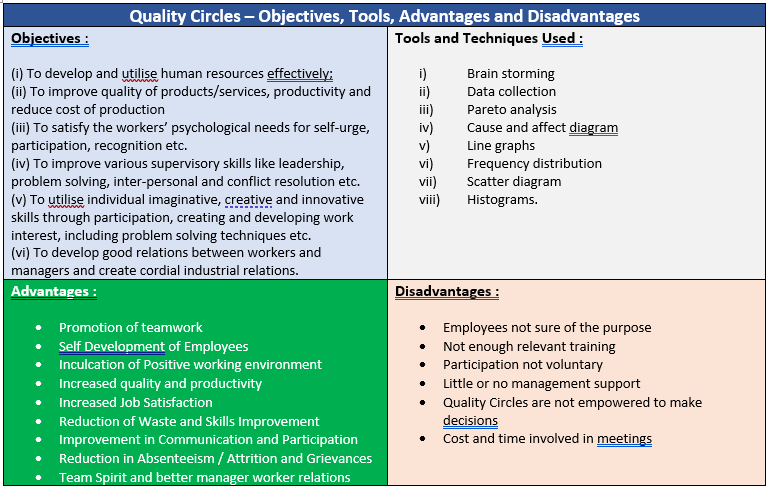
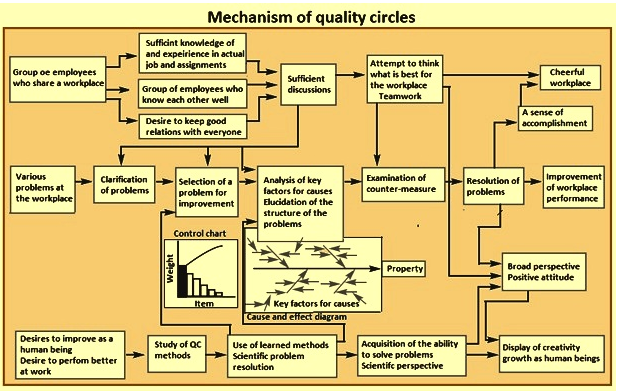
A quality circle is a group of people who do the same or similar work, meet regularly to identify, analyze and solve the work-related problems. Quality circle is a people building philosophy based on the fact that an employee doing a particular job is biggest expert of that field and thus is in a better position to identify, analyze and resolve the work related problems through their ideas. In reality, Quality Circle is a practical application of McGregor’s theory ‘Y’ which says that people enjoy and take pride in their work if they are given the right environment with a decision making power. Generally, It consists of minimum 3 and maximum 12 members in number. Quality Circle Groups are usually small in numbers and led by a supervisor or manager and they present solutions to management and also implement the solutions themselves to improve the performance of the organization and also to motivate the employees across the organization. These groups were most popular in 1980s but today also such groups exists in the form of Kaizen Groups etc. Typical areas of interest for Quality Circle members are improvement in Product design, Processes, Occupational Health and Safety and workspaces etc. These are the formal groups in organization who meet regularly to discuss the problems and they are by competent people and Industry experts in problem identification, analysis, basic statistics and solving the problem in a structured way. Origin of Concept : The foundation of this concept was put in by Dr. W. Edward Deming during his working with Allied Occupation of Japan in 1950s and then Professor Kaoru Ishikawa built upon the work done by Deming and defined this term in detail in his book “What is Total Quality Control ? The Japanese Way” and later on it was circulated across the Japanese Industry by JUSE (Union of Japanese Scientists and Engineers) in 1960. Nippon Wireless and Telegraph was the 1st Japanese company to deploy the Quality Circle concept in 1962. Key Elements of Quality Circles : Mechanism of Quality Circle : Do Quality Circles Exist Today as well ? Yes, Concept of Quality Circles exist even today (though the wave was more prevalent in 1960s and 1980s) as it’s a philosophy that uses the wisdom of the people on Ground to solve the problems. In Manufacturing Sector, the knowledge and experience of people on ground or at Gemba like operators and workers, foreman and line managers is used to get an idea and same is considered in problem solving / arriving at the final solution as they are the best judge or witness of the problem happening at the ground day in and day out and their thoughts must be given considerable importance even if we are using other techniques like Six Sigma / Lean (Lean also Focus on importance of Gemba / Genchi Genbustu). Normally in Morning / Evening meetings with the workers, this approach is promoted and asked to look at the problems with the help of 7 QC tools and training is also given in line with that. In Service Sector as well, people on Ground discuss the problems in huddles, team meetings and work together to fix the same at ground level. Though the concept is not so formal in Services Industry but initiatives (Like Idea generation / A3 / Kaizen / SPS / Lean Workshops / Solution Programme / Hackathons / War on Errors / Power of Zero etc.) are taken in the organizations and participation from people on ground is encouraged in solving the problems as small – 2 ideas sometimes cause big improvements at the organization level. In Agile way of working also, development team is given the total ownership for development of the softwares guided by the Product Owner and this development team acts as a Quality Circle Only (<10 members team) and this team acts in a self organized way, solve problems with collective wisdom and take decisions independently keeping Product Owner in loop to improve the product quality. Companies where this Concept is working : BHEL, Kirloskar Oil Engines, Mahindra & Mahindra, Bajaj Auto, HMT, Maruti, Modi Xerox. SBI, Hindustan Aluminum, Modi Rubber, TELCO, LUCAS-TVS, etc.

-
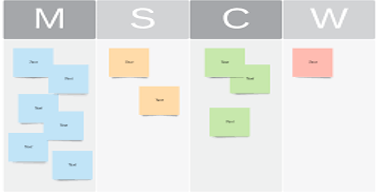
MoSCoW method or MoSCoW prioritization is a popular prioritization tool for managing the requirements. This method is frequently used in making key stakeholders understand the importance of the project deliverables. MoSCoW stands for Mo (Must Haves), S (Should Haves), Co (Could Haves) and W (Will not Have or Wish). The interstitial Os are added just to make the word easy to pronounce. Project stakeholders can discuss on project deliverables and take the decision to put deliverables under these four buckets basis the priority of the deliverable in the project. In today’s fast pacing world if we see lot of tools / techniques revolve around this concept E.g. Agile Way of Software Development. In this method, key stakeholders in a project i.e. Product Owner and Development Team can discuss together and finalise the list of the features to be developed 1st (Must / Should Have) from the overall Product Backlog Items and develop those features in earlier sprints and less priority features (Could Have / Wont Have) can be developed in later sprints or if not to be developed at all. Origin of MoSCoW Method : Dai Clegg, a software developer during his tenure at Oracle created this method in 1994 for RAD (Rapid Application Development) and later this method was incorporated in DSDM (Dynamic Systems Development Method used for Agile Software Development) as well. Clegg designed this framework for prioritization for time boxed projects. How this method Works ? Before starting the MoSCoW analysis, all stakeholders and product team must get aligned to objectives and prioritization factors. Then, all the team members must agree on initiatives to prioritize. Also, agree on a criterion or way to solve the disagreements / conflicts in prioritization. Team can also agree on the % of resources to be allocated in each of these 4 Categories. What are these 4 Categories ? These 4 Categories are as described in below image : Example : Real Estate Developer along with stakeholder can use MoSCoW method to bucketize / prioritize these 4 types of items in the upcoming project as depicted below. Example : A Web Developer working to make a website for a bank can use MoSCoW method to prioritize the items / user stories and work as per that as depicted below. Limitations of MoSCoW method : i) Doesn't help to decide between multiple requirements with same ranking ii) Lack of rationale on how to rank a very close or competing requirements : why something should be placed under must rather than should iii) Ambiguity over timing, especially on the Won't have category (Whether the requirements in this category will not be there in this release or project or any of the releases or products) iv) Prioritized items may be influenced by external factors like Political / Geographical etc.


-
Change Effectiveness Equation (E = Q*A) tells about the Effectiveness of the change in an organization and 2 critical components for a change to be successful are : 1. Quality of Technical Design (Technical Aspects) 2. Acceptance of Strategy (People Aspect) If any of these elements is missing (Zero) then the overall change deployment success goes for toss and Effectiveness of Change mathematically becomes Zero. Mind Map of the Equation : (Visual Presentation) - If we see the mindmap below, Effectiveness of change is dependent on 2 critical components (A and Q) and have tried to project some of the subcomponents of each. So say if a company plans to launch a new software or product, these aspects shall also be covered in their overall strategy. A project leader can quantify the benefits of the same using lot of techniques like : Pugh Matrix AHP (Analytical Hierarchy Process) and Analysis Cost Benefit Analysis QFD Decisional Balance Sheet Origin of Concept : This concept Originated from GE (General Electric). In 1989-90, under the direction of Jack Welch, GE launched “Work-Out” progranmme – a team based problem-solving and employee empowerment program introduced after Japanese quality circles model that was in a hit at the time. Work-Out was a huge hit and Mr. Welch was really concerned by the rate of adoption through the business. He realized that GE was entering an era of constant change, and that those who adapted to change the fastest would be the survivors in long run. He commissioned a team of consultants (including Steve Kerr, who was to become GE’s first Chief Learning Officer) to mould industry and academics to study the best practices in change management and come back to GE with a tool kit that they could easily implement. The result was the Change Acceleration Process, commonly referred to within GE simply as “CAP.” (Shown Below) This team studied hundreds of projects and one of the finding was that a high-quality technical strategy solution is insufficient to guarantee success. Surprisingly, a high percentage of failed projects had excellent technical plans. (Examples below) The team found that it is lack of attention to the cultural factors that normally derails such projects when there is a failure – not the technical strategy. Failure, means as failing to achieve the anticipated benefits of the project (i.e., the benefits that justified the project in the first place). Many of the technical design those have failed had the problems with either of these parts (Either Acceptance or Quality of Technical Design). Example : Google Wear Glass Product Description : It was a wearable, voice-controlled Android device as a pair of eyeglasses and displayed information directly in the user's field of vision. Why this product failed ? i) Consumers were not able to comprehend the benefits as what this wearable computer will solve and why they need to spend extra money on that. (Acceptance of Change missing) ii) Design was not aesthetically appealing. Looked like a dork. (Technical part was missing) iii) Privacy related concerns . Recording of videos using cameras. ((Acceptance of Change missing) iv) Safety Concerns. Exposure of eyes or face to Radio Frequency Radiations all the times. (Acceptance of Change missing) Example 2 : 3 D Television A television that conveyed 3D depth perception to the viewer for special 3D-formatted programming. Why this product failed ? i) Awkward User Experience as not possible to wear 3 D Glass all time (Acceptance of Change missing) ii) Eye Dizziness – Safety (Acceptance of Change missing) Examples of Good Technical Designs with great People Acceptance : 1. Google Chrome : Excellent technical design and features, compatible with google products and free to use and hence excellent reach to customers. 2. Microsoft Windows – Easy to use than MS DOS with good navigation of the features. Available to large audience (With Pirated versions). 3. RPA Softwares (UiPath, Automation Anywhere etc.) - User Friendly with elimination of Mundane tasks and increasing user productivity, quality of work with easy to use features and lot of training materials availabe on Sites. Free Trial Period as well. 4. HP Printers: Good Technical Design. Excellent After Sales Services. Easy Parts Availability. Training Manual / Product Manuals. Compact Designs. Aesthetic. 5. Maruti Suzuki Ertiga: Good Design, Good Mileage, Excellent after Sales Service, Low Price, standard features, Value for money with huge dealer network (reach) of Maruti. Examples of Some of the Products in Use which may become Obsolete tomorrow due to missing on these aspects: Old Statistical Softwares like Minitab, SAS etc. may go off trend (High Licensing Cost, Low reach to users, not an open source, no amendments / libraries addition possible) due to advent of new free statistical Softwares / tools available like R, Python (Lot of additional techniques for analysis, compatible with upcoming industry trends like Machine Learning, Artificial Intelligence etc.


-
Cost-benefit analysis is the method used to measure the benefits of a decision minus the costs associated with taking that action or decision. In 1772, Benjamin Franklin wrote of its use. But the concept of CBA (Cost Benefit Analysis) dates to Jules Dupuit, a French engineer, who put forward the process in an article in 1848. This concept become quite popular in 1940-1950s in US and was vastly used in U.S. Flood Control Act to prove that benefits of flood-control projects largely exceed their costs. A Cost Benefit Analysis involves measurable financial values such as revenue earned or costs saved as a result of the decision to pursue a project. Also intangible benefits are considered into the cost benefit analysis like customer satisfaction, Employee Satisfaction etc. In today’s competitive world, its very important to conduct the Cost Benefit Analysis and take the decisions as per that. It helps in identifying the projects which are generating the higher benefits (revenue / sales) than the cost incurred on them and will be beneficial for the company from the financial standpoint. Also sometime opportunity cost (Opportunity costs are alternative benefits that could have been realized when choosing another alternative over the selected one) is also included in this analysis. How Cost Benefit Analysis is Conducted? Step1 : List down the direct costs involved in the project like Raw Material, Labor, Manufacturing Expenses, Machinery Cost etc. Step2 : List down the indirect costs like electricity, overhead costs from management, rent, utilities etc. Step 3 : List down the intangible costs too like impact on customer satisfaction, employee satisfaction, or delivery timelines etc. Step 4 : List down opportunity costs associated with decision as well like purchasing a new machine vs taking the same on rent. Step 5 : List down the potential risks as well regulatory risks, competition, and environmental impacts etc. as well. Step 6 : List down the benefits e.g. Revenue / Sales etc. Step 7 : List down the intangible benefits as well like impact on customers, employees, or faster delivery etc. Step 8 : List down the competitive advantage gained as result of this decision like Market Share. Step 8 : Do the sensitivity Analysis and consider the risks and uncertainties in projections. Step 9 : Take the decision Example : Lets say Company ABC Plans to Start a New Production Plant with details as below. Lets see if they shall set up the new plant or not basis the cost and benefits listed below. Costs and Benefits Involved : Cost Heads Cost Amount (INR) Benefits Type Benefits Amount (INR) Land Cost 1000000 Revenue 4000000 Raw Materials 200000 Scrap 1000000 Machinery 1000000 Client Satisfaction 100000 Labour 1000000 Electricity, Water etc. 100000 Inventory 100000 Manufacturing Expenses 100000 Total Costs 3500000 Total Benefits 5100000 So If we see in example above, total costs are 3500000 INR and Total Benefits out of it are 5100000 INR and hence there are benefits of (5100000-3500000) = 1600000 INR and hence company can take the decision to setup the new plant. Limitations of Cost Benefit Analysis : i) There are number of forecasts built into the process, and if any of the forecasts are inaccurate, the results may be called into question. E.g. Cost of Machines, Land, Expected Revenue etc. ii) Cost Benefit Analysis works well for short term to mid term projects with low to medium complexity but it fails for long term and complex kind of projects as there is always some elements of uncertainty in the long run e.g. costs may go up, interest rates may change and technology may become obsolete. iii) Cost Benefit Analysis of concept does not take into account the NPV concept (Net Present Value) and IRR (It is the rate of return at which the net present value of a project becomes zero or rate at which your investment is expected to generate the money, higher the IRR, more attractive is the investment because of higher rate of return) of money while calculating the Benefits as Costs would be incurred in near future but the benefits will be realized in long run or say 2-3 down the line OR even if it is taken into account the assumptions may not be correct because of inflation, time value of money / interest rate fluctuations. One of the benefits of using net present value (NPV) for deciding on a project is that it uses an alternative rate of return that could be earned if the project had never been done. That return is discounted from the results. Or we can say, a project needs to earn at least more than the rate of return that could be earned elsewhere or the discount rate. So to avoid the same NPV shall be taken into consideration : NPV = F / [ (1 + r)^n ] where, PV is Present Value, F is Future payment (Cash Flow), r = Internal Rate of Return and n = the number of periods in the future is based on future cash flows. iv) There is always subjectivity involved in Quantifying the Intangible costs and benefits and may not be totally true and accurate. v) Sometime Cost Benefit analysis done is taken forward as the budget of the project and which may not be actually true and hence the stakeholders are pressed hard to meet these numbers like cost / sales etc. vi) Wherever the assumptions / forecasts are involved, person doing the analysis has the tendency to assign more weights or values to factors / elements which he wants to go with basis his instincts and hence it may cause bias in the results. vii) The supposed clarity in determining and listing costs and benefits can prove harmful as the actual outcome is dependent on several variables that you can only know with time. Can organizations take decisions in favor of unfavorable Cost Benefit Analysis ? Yes, organizations sometimes may take decisions in favor of the projects where Cost Benefit Analysis is not in favor of them. Some Examples are as listed below : 1. Corporates are going for its own vaccination drives for the safety and health of its employees. If we see here there are lot of costs involved in setting up the system, softwares, vaccination, facilities etc. with no direct immediate benefits for the company but companies do so for the benefits and wellness of their employees. 2. An organization taking a project to plant 10000 trees to make the environment better. If we see here there are no direct benefits to company but they do so for their responsibility towards society or nature. 3. An Organization taking a project to install the safety devices / equipment. If we see here, there will be cost involved to company but still they do so for the safety of their staff. 4. Twitter to appoint additional staff in India to comply with the Government Regulations - Though this may not be required or beneficial from company standpoint but they have to do so (Cost) to adhere to government rules and regulations. 5. Organisation providing free transport, food, gifts etc. to employees to their employees to increase their employee satisfaction though these results in cost to the company.
-
What is 9 Windows tool? 9 Windows is an idea generation tool and it helps to generate new and innovative ideas. It helps us to look into the future of a system by looking at its past and present components and development occurred in it till date. Why it is called 9 windows and how it looks? Because it’s a 3x3 matrix which depicts the system evolution at 3 points of time i.e. Past, Present and Future and system is looked upon from 3 views i.e. Super system, Present System and Subsystem (Component of System). Who Developed It or from where the concept originated? Nine windows is one of the most famous tool used in the theory of inventive problem solving (TRIZ) which was developed by Genrich Altshuller, a Soviet inventor and science-fiction writer, in the middle of the 20th century. When to use 9 Windows tool : When you need an innovative futuristic solution for your problem with thorough analysis of past and present system components and what best can be delivered in future in it. How to use 9 Windows Tool? To use nine windows, write the problem first and the current system for solution in the centre of a 3 x 3 matrix as shown below: Then, explore the problem at each of below three system part levels: 1. Super-system (or Macro system): External environment and components that the problem or system interacts or may interact with in the future. 2. System: The problem or system that was created or exists as of now. 3. Subsystem (or Micro system): A component or parts of the problem or system (Problem / System to be broken down further) How it can generate the 8 methods / solutions? By asking these Questions: 1. What could have been done in past at System / Supersytem / Subsyetm level to solve the problem or make system better? 2. What can be done now at present at Supersytem / Subsyetm level to solve the problem or make system better? 3. What we should do in future to make the System / Subsystem / Supersytem better or to solve the problem? SYSTEM / TIME Where it can be used? This concept can be used in all the sectors and let’s see below examples covering different sectors : Transportation: Education: Retail: IT Industry : Summary : So if we see in all the above examples, this tool triggers and channelizes our thoughts towards the present, past and future system, Supersytem and subsystem components. It provokes our thinking beyond the current boundaries for the innovative and efficient breakthrough solutions. In turn, these solutions can improve the system drastically that is beneficial to all in long run and mankind as a whole i.e. Change for Good !
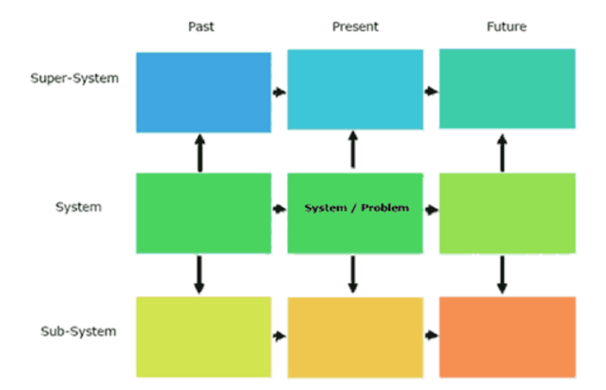


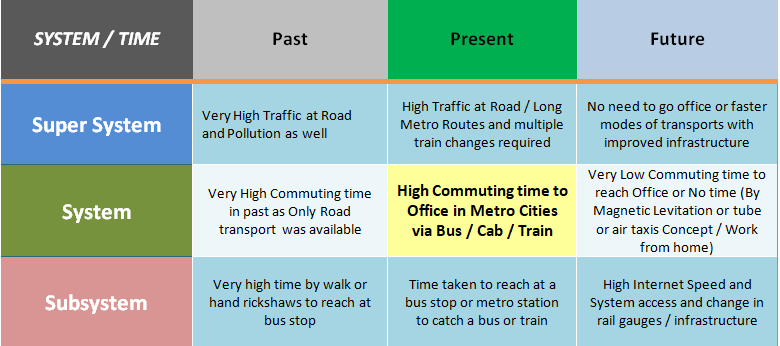

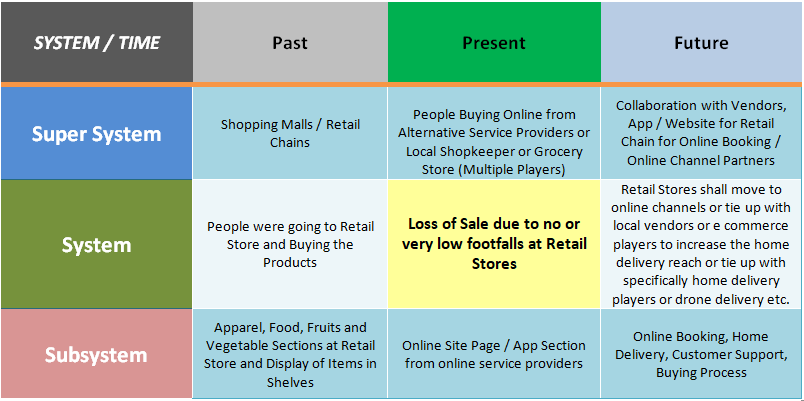

-
EMO (Emotional) Index measures the feelings of a customer or stakeholder towards a company, its product or service. This tool acts as an alternative to traditional customer satisfaction research methodology. EMO Index is an indicator that measures the emotional state of customers and stakeholders and is a registered trademark of EMO Insights International (A Spanish Marketing Consultancy Firm). In 2012, Company introduced an indicator for studying the Emotional Management in Spanish Banking Sector. A study was done on retail banking customers (male and female), aged 18 and over and Spain residents and Neuroscience techniques were used in this study to analyse the customers' current and past experiences with banks and the emotions felt via these experiences to calculate impact on customers' behaviour. EMO Index is an individual or aggregate indicator which measures the general feelings of each customer or stakeholder towards a company, product or service. This index takes into account the Net Emotional State (balance of emotions felt) and the Net Intensity Balance (intensity with which they are felt) and, therefore, can measure values from -100% (Extremely Bad) to +100% (Extremely Good). Since this Index is calculated at an individual level, it can classify the customers into seven broad, general emotional states which its creators call EMO Clusters as depicted in figure below : Fans (+100% to +80%), Believers (+80% to +55%), Followers (+55% to +30%), Stand By (+30% to +15%), Lost Souls (+15% to -5%), Burned Out (-5% to -30%) and Opponents (-100% to -30%) This model challenges the traditional models used for predicting behaviour based on sociodemographic variables (sex, age, social class, etc.) or classification parameters linked to a specific sector (product purchased, volume of purchases, reasons for purchase, etc.) The developers of this model mention that the EMO Index is a more reliable indicator than the likelihood to recommend used by other tools such as the Net Promoter Score. Their argument is supported by a second part of the study on emotions in banking conducted one year later on 500 customers who had participated in the previous study as well. The purpose of the second part of the study was to determine whether they recommended the bank to their acquaintances and the following results were obtained: Net Promoter Score (Promoters, Passives and Detractors) = % of Promoters - % of Detractors (As shown in figure below for 0-10 customer survey rating scale) is not entirely consistent with regard to what the customers feel or what the customers say they will do, at least in Spanish Retail Banking Sector. In particular, it is worth noting that the term "Detractors" includes ~ 60 % of the customers and, therefore, it does not differentiate between the majority of people who are falling in this band. Also, it does not seem to correspond to the emotional state and the stated behaviour of these customers or, at least not all of them. So the question is If the Net Promoter Score (NPS) alone enough or there shall be a better measure like EMO? I believe below quote nicely sums it up: "Emotional Attachments will no longer be a mystery in the future: they can act as a new source of competitive advantage and growth in your business" "When evaluating brands, customers primarily use emotions (personal feelings and experiences), rather than information available about the brand (attributes, characteristics and facts)." Some other Interesting facts about the tool / approach / company: · EMO Insights was born in 2010 with the vocation of "putting the focus" on the emotional. The motivation to develop methodologies that did not exist to date to make emotions · It uses a unique methodology that combines clinical psychology techniques with neuromarketing and state-of-the-art mathematical models. · EMO creates advanced emotional metrics using neuroscientific technologies (galvanometers, attention meters, etc.), and techniques from clinical psychology to detect and quantify customer emotions towards a brand. · It focuses on Detection of Moments of Truth (MOT's), Touch points, Pain points, Emotional triggers, Motivations, Trends in satisfaction with customer experience and loyalty, Return channels for the business. · 85-95% decision-making has an emotional or subconscious component · Another very innovative and effective - FEM® (Feelings Experience Management) methodology has been recognized by very famous management institutions such as London Business School · It identifies the leading emotions in the sector and make an emotional ranking of brands and predict changes and opportunities in the market

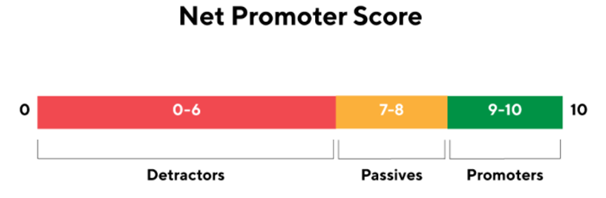


-
An influential point is a point that has a large impact on the regression analysis and an outlier is a point with a large residual. Interestingly, these are not the same thing. A point can be an outlier without being influential point too. A point can be influential even if its not an outlier. A point can be both or neither of these as well. An outlier is a data point whose response Y does not follow the trend of rest of data and a data point considered as an outlier only if that point is extreme with respect to the other Y values and not the X values. A data point is influential if it influences the regression analysis in a big way, such as predicted responses, the estimated slope coefficients, or the hypothesis test results. Kindly note that Outliers and high leverage data points have the potential to be influential, but we need to investigate further to determine whether or not they are actually influential. Let's take a look at some of the scenarios that should help us to clarify the distinction between these two types of extreme values i.e. Outliers and Leverage Points. Lets take Dependent Variable (Y) here as Marks Obtained in Exam and Independent Variable as Hours Studied (X). As we know, equation of line is represented as below : Y = mX+C Y - Dependent Variable i.e. Marks Obtained , m - Slope of Line or rate of change , X - Independent Variable i.e. Hours Studied and C - Intercept on Y line H0 - X (Hours Studied) has no effect on Y (Marks Obtained). H1 - X (Hours Studied) has effect on Y (Marks Obtained). Scenario 1 : As per definitions above , do you think there are any outliers, leverage points or influential observations in below : Definitely not, as all of the data points follow the general trend as rest of the data, so there are no outliers (in the Y direction). And, none of the data points are extreme with respect to X as well, so there are no high leverage points too. To conclude, none of the data points appears to be influential with respect to the location of the best fitting line. So, more and more I am studying, higher and higher are my scores. Scenario 2 : Do you see any outliers or any high leverage points or any influential observations in below ? Definitely Yes, because the red data point does not follow the trend of rest of the data, it would be considered as an outlier. So here, though I have studied for less hours, but my scores were quite high. So such scenario must be analysed to know what exactly happened at that instance might be better concentration or exam was easy or nothing came outside the syllabus than what i had studied. However, this data point does not have an extreme X value, so it does not have the high leverage. Is the red data point influential? An easy way to determine if any data point is influential is to draw the best fitting line twice — first with the red data point included and another with the red data point excluded. The following graph illustrates the two best fitting lines : Great, it's hard to even tell the difference between the two estimated regression equations! The solid line represents the regression equation with inclusion of the red data point, while the dotted line represents the estimated regression equation with the red data point being excluded. The slopes of the two lines are also very similar i.e. 5.04 and 5.12 respectively. Do the two samples yield different results when testing H0 : m = 0? Well, we get the following output when the red data point is included in this data set : and the following output when red data point is excluded from the data set : There certainly are some minor side effects of including the red data point, but not very serious. As we can see here, R^2 value has decreased slightly, but the relationship between Y and X would still looking strong. The standard error (SE), which is used in calculating our confidence interval of m, is larger when the red data point is included, therefore increasing the width of the confidence interval. As we know that the standard error depends on the mean squared error MSE, which tells us the difference between the observed and predicted responses. It is because the red data point is an outlier i.e. in the Y direction so the standard error is increasing, not because the data point is influential. In each case, the p value for testing H0: m = 0 is less than 0.001; we can conclude that there is sufficient evidence at the 0.05 level to conclude that, in the population, X is related to Y. Therefore, the predicted responses, estimated slope coefficients and hypothesis test results are not impacted by inclusion of the red data point. Therefore, the data point is not deemed influential. In nutshell, the red data point is not an influential data point and does not have a high leverage too, but it is definitely an outlier. Scenario 3 : Now, lets look at the below scenario for outlier and leverage point. Here, the red data point follows the general trend of rest of the data. Therefore, it is not deemed an outlier. However, this point has an extreme X value, so it has the high leverage. So here, I have studied for a large number of hours which are substantially more than the other days, but my scores were also quite high in that proportion and following the same trend. Such scenario again must be analysed as why all of sudden i have studied for so many hrs than normal and reasons may be important exam, less subject preparation, difficult exam pattern etc.. Now, lets see the red data point influential? It certainly appears to be far away from rest of the data (in the X direction), but is it sufficient to make the data point influential ? The following plot depicts the two best fitting lines; one obtained when the red data point is included and another when the red data point is excluded: Again, is difficult to separate both the regression lines. Solid line represents the estimated regression equation with red data point included, while the dotted line represents the estimated regression equation with the red data point excluded. The slopes of the two lines are also very similar i.e. 4.927 and 5.117 respectively. Do the two samples yield different results when testing H0: m = 0? Well, we obtain the following output when the red data point is included in the data set : and the following output when red data point is excluded from the data set: So we see here that there are hardly any side effects from including the red data point: The R^2 value has hardly changed, increasing slightly from 97.3% to 97.7%. In both the cases, the relationship between Y and X is looks strong. The standard error is also same in each case i.e. 0.172 when the red data point is included, and 0.200 when the red data point is excluded. Therefore, the width of the confidence intervals would remain unaffected by presence of red data point. You can see that this is because the data point is not an outlier heavily impacting MSE. In each case, the p value for testing H0: m = 0 is less than 0.001. In either case, we can easily conclude that there is sufficient evidence at the 0.05 level, in the population that X is related to Y. Therefore, the predicted responses, estimated slope coefficients, and hypothesis test results are not affected by inclusion of red data point. Therefore, the data point is not appearing as an influential. To summarize, the red data point is neither influential, nor is it an outlier, however it has the high leverage. Scenario 4 : Lets look at the last scenario as below for any outliers and leverage points. Bingo, the red data point is most certainly an outlier and also has high leverage! The red data point does not follow the trend as rest of the data and it also has an extreme X value. So here though I have studied for substantially high number of hours but my scores have not increased in that proportion or rather it came down; so as a general observations it shall influence my regression analysis definitely. Therefore, in this case the red data point is certainly influential. The two best fitting lines i.e. one obtained when the red data point is included and one obtained when the red data point is excluded: are (not surprisingly) substantially different. The solid line represents the estimated regression equation with the inclusion of red data point, while the dashed line represents the estimated regression equation with the red data point exclusion. The existence of the red data point significantly reduces the slope of the regression line i.e. dropping it from 5.117 to 3.320. Do the two samples yield different results when testing H0: m = 0? Well, we obtain the following output when the red data point is present : and the following output when the red data point is not present : Here the R^2 value has decreased substantially from 97.32% to 55.19%. Therefore, if we include the red data point, we conclude that the relationship between y and x is only moderately strong, whereas if we exclude the red data point, we conclude that the relationship between Y and X is very strong. The standard error also is almost 3.5 times larger when the red data point is included i.e. increasing from 0.20 to 0.686. This increase would have a substantial effect on the width of our confidence intervals too. Again, the increase is because the red data point is an outlier in the Y direction. In each case, the p value for testing H0: m = 0 is less than 0.001. In both the cases, we can conclude that there is sufficient evidence present at the 0.05 level to conclude that, in the population, X is related to Y as largely the data points are in favor of it . Note, however, that the t-statistic decreased dramatically from 25.55 to 4.84 upon inclusion of the red data point. (Measure of how many points actually fall on the regression line which has decreased here with inclusion of red data point) Here, the predicted responses and estimated slope coefficients are certainly affected by the presence of the red data point. While the data point does not affect the significance of the hypothesis test, the t-statistic did change largely (The greater the magnitude of T, the greater the evidence against the null hypothesis). In this case, the red data point seems to have both high leverage and also an outlier, and finally it turns out to be influential too. Summary In the above scenarios, through the use of simple plots, we have highlighted the distinction between outliers and high leverage data points. There were outliers in scenarios 2 and 4. There were high leverage data points in scenarios 3 and 4. However, only in scenario 4, data point that was both an outlier and a high leverage point turn out to be influential. That is, not every outlier or high leverage data point strongly influences the regression analysis. Therefore, its our duty as an analyst to determine if regression analysis is unduly influenced by one or more data points and if these are incorrect observations or values we can delete / ignore them however if these are right observations we must study them in detail as these are kind of special causes and indicating to something special that has happened at that particular instance E.g. Though I have studied for more hours but my scores were not high rather dipped (Scenario 4), which may be i did not study the relevant subject or topics or may be my concentration was not good on that particular day or may be exam questions have not come from the syllabus i have studied. So Its always good and advisable to study these points in details so that something interesting or unusual causes can surface out as a result of this study and decisions can be taken accordingly to consider the same in further analysis / study.
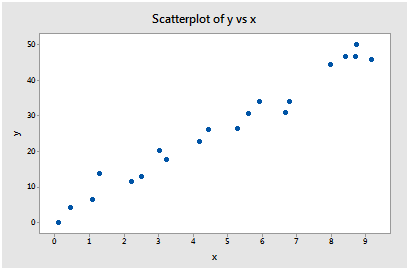
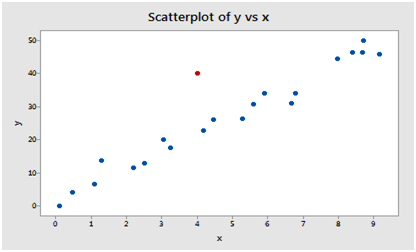
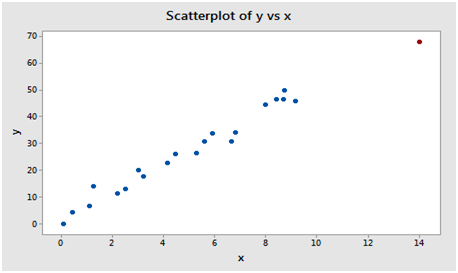


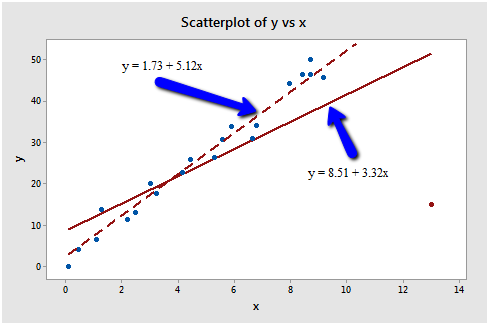
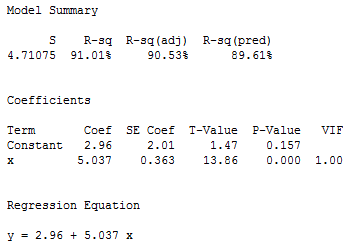

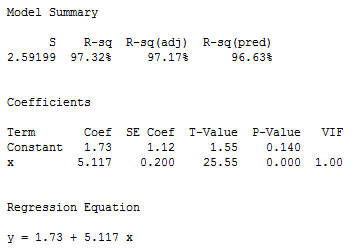
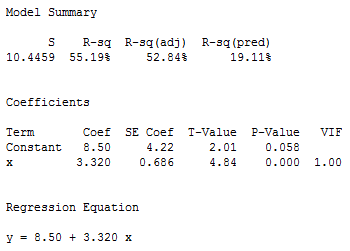

-
A decisional balance sheet is a tabular / grid based method for depicting the pros and cons of different options which helps to decide what to do in a particular situation. Sometimes when we are faced with an important decision, we spend a lot of time looking for a solution hoping to avoid making the wrong choice. One of the simplest ways to decide what we shall do in a particular situation is Decision Balance Sheet. It is a quite simple however a very powerful and effective decision-making method that enables the team to make more confident and balanced decisions. It is said that decisional balance sheet was first used by Benjamin Franklin. In 1772, Franklin described his own use of the method, often called the Ben Franklin method. It includes making a list of pros and cons about a decision, estimating the importance of each one, eliminating items from the pros and cons lists of roughly equal importance until one column is dominant. In 1959, Irving Janis and Leon Mann coined the phrase decisional balance sheet and used the concept as a way of looking at decision-making.This approach / technique is quite often used in working with ambivalence in people who are engaged in behaviors that are harmful to their health (for example, problematic substance use etc.), and in certain circumstances in motivational interviewing too. Another corollary of this tool is PMI which stands for Plus, Minus and Interesting. An Interesting column is used when the elements of the idea are not resulting into positive or negative effect. It can be used to record what you consider interesting and the future implications of the idea. E.g. Pursuing a new hobby say painting where there are no as such plus and minus but you are taking it forward as it interests you. How Decisional Balance Sheet Looks ? A decision balance sheet is simply a table of two columns called as Pros and Cons. This table is used to record all the pros and cons for the given idea or the proposal. You can also use a scoring system by giving numerical weights to the different pros and cons. The result will help you to decide whether to go ahead with the decision or not to go with it. (Images shown in examples below) How to Make and Use the Decision Balance Sheet ? Steps : i) Clearly write down the situation or idea at the top of a flip chart or whiteboard. ii) Draw a table of two columns, name one “Pros” and the other as “Cons”. iii) Record all possible benefits in the pros column and all possible negative effects in the cons column. iv) Give numerical weights to the pros and cons by assigning a score from one to five. Be objective while scoring. v) Sum up the scores in each column and then subtract the total cons from the total pros. vi) Consider the overall score to decide whether to go ahead with the decision or not. vii) Take time to identify other factors that you may have missed. Remember to use common sense too when you suspect that the reached result is not feasible. Some of the Real Life Examples and Applications of Decisional Balance Sheet : DECISIONAL BALANCE SHEET – GO FOR PREVENTIVE MAINTENANCE OR NOT PROS CONS CHANGE (Go for it) i) It will reduce the unknown / unscheduled failures (+5) ii) Will reduce the unplanned downtime (+4) iii) Will help in avoiding the accidents and improve workers safety (+5) iv) Will improve company’s brand image (+4) i) There will be cost incurred on it (+3) ii) Additional Efforts needs to be put in making the schedule (+2) iii) There is downtime involved of machines as per schedule (+2) NO CHANGE (Don’t Go for it) i) Cost Savings due to no downtime for Preventive maintenance ii) Increased availability of machines iii) Savings of Resources (Man Power) involved in making the schedule iv) No impact on the Production i) There may be frequent failures and downtimes ii) Unexpected downtimes / failures may lead to high revenue loss or costs iii) Stress / Pressure to resolve the issue immediately iv) Safety concerns for workers and Brand image of company will hamper DECISIONAL BALANCE SHEET – CHANGE JOB AFTER CERTAIN TIME OR STAY AT SAME COMPANY PROS CONS CHANGE i) Fast Growth in Career / Position (+5) ii) Higher Salary Increase (+4) iii) New Skills Learning (+5) iv) More Connects in Industry (+4) v) Exposure to different Cultures (+3) i) Instability / New Comer's Risk in New Organisation (+5) ii) Uncertainty in New Environment (+4) iii) Establish your connects from scratch (+3) iv) Work Harder to settle and for Growth (+2) DON’T CHANGE i) Job Security ii) Less Efforts to Survive iii) Comfort Level iv) Good Knowledge about existing company (People / Culture / Connects etc.) i) Slow Growth Rate ii) Less Increments in Salary iii) Stagnancy in Skill / Career iv) No knowledge about outside world / technology v) Less Personal Development due to working in same culture / environment DECISIONAL BALANCE SHEET – DO NEW CERTIFICATIONS OR WORK AS USUAL PROS CONS CHANGE (DO CERTIFICATIONS) i) New Skills Learning (+5) ii) Fast Career Growth (+5) iii) Sense of Achievement (+5) iv) Stay Relevant & Avoid Obsolescence Risk (+4) v) More Connects outside (+4) i) Extra Efforts on certifications may impact routine work (+2) ii) High Certifications Cost (+2) iii) Impacts personal time / space due to weekend efforts (+3) Summary : If we look at the above examples, it is evident that scores in favor of Preventive Maintenance, Change Job after certain time period and Do Certifications are high (Basis Personal Assumptions and scoring) and hence decisions may be taken in favor of these events.
-
A North Star Metric (NSM) is one measure that is most predictive of a company’s success in long term. A Metric would be truly a "North Star" metric if it can encompass these three aspects into it : Lead to revenue, Reflect customer value, and Measure progress. If any metric that ticks well on these three points, and every department contributes to improving it, the company is going to grow in long run. This metric term was coined by start up investor Sean Ellis. It is very important to have a North Star Metric so that everyone in a company is aligned towards a ONE common goal and also it helps in reduction of duplication of work in different department due to no clarity about the common goal. Examples of North Star Metrics from some of the renowned companies: Airbnb: Number of Nights Booked Facebook : Daily Active Users Quora : Number of questions a user answers WhatsApp : Number of messages a user sends Spotify : Time spent on Listening Amazon : Number of Purchases per month Uber : Rides per week A major reason Myspace (American social networking service) failed and Facebook succeeded is correlated to NSM they focused on. Myspace focused on Registered Users (a vanity metric) as their North Star Metric. At that moment, Facebook focused on Monthly / Daily Active Users as their NSM. This difference in focus finally led Facebook to succeed whereas Myspace failed badly. Social media apps must be aware of the changes in registered user numbers over a period of time. But Myspace failed because Registered Users means that it will show only who have signed up. It doesn’t show if these users are continuing to use their platform (a sign users continuing to receive value from it). Users who don’t get value from a product will stop using it and churn over a period of time. By tracking Monthly Active Users, Facebook could monitor changes in user numbers and see which users are finding the value from using the platform. North Star Metric (NSM) must not be confused with OMTM (One Metric that Matters) in Lean as NSM is the number on which your entire company focuses to achieve long-term growth during a period of several years to infinity in comparison to One Metric That Matters (OMTM) is the number on which one team focuses to achieve rapid growth for a period of 2 to 6 months. How to Select your NSM ? Five points to keep in mind when deciding your North Star Metric: i) The metric shall indicate what your user experienced the core value of the product ii) It should reflect user’s engagement and activity level. iii) It points out to “one thing” that indicates if your business is heading in right direction iv) Ideally, the metric should be easy to understand and communicate across teams v) Don’t fall into the trap that you have to have a perfect North Star Metric. What you are trying is to find is a metric that makes the most sense for complete business to focus on. It might take a few iterations as well to get a final NSM Believe the crux and intent for North Star metric is rightly explained below : “It is important to keep in mind that NSM is not an end solution in itself. Its a key metric gives focus on growth efforts and can serve as a seed to grow in a company's ecosystem that gives you deep insight into your customer’s behavior and create levers to drive future growth. It leads to understanding your customers and integrating your team on how to better bring value.” – Andrew Miller To correctly define your NSM, it requires understanding your customers, including what kind of value they get from your product and how they use your product to get that value. With that information, you can make better product to help customers get the value they’re looking for which will increase customer lifetime value, decrease churn rates, and increase revenue and growth. How North Star Metric can help generate Long term value for Customer ? Taking Example here of Airbnb whose North Star Metric is - Number of Nights Booked. So, company would be focusing on it heavily and will be on company's radar on real time / weekly / monthly monitoring and continuous efforts will always be there to improve the performance of this metric. To improve the metric, company must be rolling out frequent customer friendly offers (discounted price), improvement in its current service and hygiene of its current properties, providing superior locations, bundled offers (Meals / Amenities / Facilities / certain nights free if you book for more than say 5 nights), loyalty / membership cards etc.. By focusing on NSM, a company would be always working hard and continuously to get the night booking done (Its NSM) and which will lead better value to customer with better and better services over a period of time at lesser / same price OR more benefits will be passed on to customer even if the company increases the price to stay ahead of competition and maintaining the growth momentum in its business. Also, company would never think of loosing a customer as cost of acquiring a new customer is always quite high (5-10X) than retaining an existing customer. Finally to Summarize, Revenue is the price that your customer pays however NSM is the value your customer gets in return of that price. So please always keep on maximizing that value over time to get more and more growth in your customer base and which will finally lead to growth in your revenue.

-
Product Portfolio Matrix is a very famous tool used by most of the companies to decide the product portfolio of their products basis the market share of products and growth rate potential. This tool is also known as the BCG (Boston Consulting Group) Matrix and was developed by Bruce Henderson (Founder and CEO of BCG) in 1968. This matrix is used by more than half of Fortune 500 companies and is still one of the central point in business school teachings on strategy. This matrix helps businesses to develop the long term strategic planning and is a torchbearer in deciding products to keep and invest, discontinue or develop in the long run. It is divided into four quadrants (2*2) based on market growth and relative market share as depicted below (It's also known as Growth Share Matrix) : 1. Dogs: These are the products with low growth and low market share. Normally, expert advice here is to remove dogs from your portfolio as they are a drain or waste of resources. For example, Sony Digicam can be placed into 'Dog' category at present because every phone has a good camera now a days and hardly anyone buys them now. However it may not be always true and to quote an example here from automobile sector, in case company decides to discontinue some of the car models (dogs) however there is still a need of the spare parts and hence spare parts production operations can be continued with very less efforts and investments which may emerge as a new revenue stream for the company.To avoid over-investing in your question marks, ensure that all products in your portfolio have clear business goals and use the right KPIs to track product performance. 2. Question marks : These are products in high growth markets with low market share. As the name suggests, these products can be in early stage of development and we are not sure (question mark) if they will turn into stars or may also end up falling into the dog quadrant. These products often require significant investments to push these into the star quadrant. For example, while working on a new car model, the design department works on a large number of design options and out of those only a few or one only go for the final production. Then, there are marketing and advertising expenses involved to move this new product to 'Star' quadrant. However, on the other hand if design chosen is bad and is launched without doing proper pre launch study, it may end up falling into 'Dog' quadrant too. 3. Stars: These are products in high growth markets with high market share and these products are usually the market leaders. However, significant investment may be required in them to sustain the 'Star' position. E.g. Google which is a leader in many of its services e.g. Search, Marketing & Advertising etc. and is in 'Star' quadrant, however Google keeps on investing in their R&D efforts and new technologies to stay ahead of the competition and keep on launching the new products & features and enhancing the existing ones with help of new technologies like AI, Machine Learning etc. (Recommendations display while doing Search) 4. Cash Cows: These are products in low growth markets with high market share. Approach here that is often followed is - Milk the cow as much as possible without killing the cow ! These products are often well established products. E.g. In FMCG sector, we have certain soft drink brands (Pepsi, Coca Cola etc.) which have high market share in India but as people are becoming more and more health conscious and are avoiding eating junk food and taking these drinks, these companies are milking these well established products as much as possible by spending on Advertising, Packaging, Offers etc. Though this tools is popularly used and huge benefits for deciding the right product portfolio mix, there are certain limitations / drawbacks as well as given below (one shall keep in mind while using this) : i) This neglects the effects of synergies between business units / streams ii) High market share is not the only success factor for decision iii) Market growth is not the only indicator for attractiveness of a market iv) A high market share does not necessarily lead to profitability every-time v) The model uses two dimensions only – market share and growth rate. This may result into emphasize on a particular product, or to divest prematurely. vi) A business with a low market share can be profitable too so what to be done in that case vii) The model neglects the small competitors those have rapidly growing market share In my opinion, Six Sigma Projects can be taken up in any of these categories as Six Sigma methodology is an approach of problem solving and it can be used at any stage of product life-cycle (figure below) : In Dogs category, six sigma principles (DMAIC / DMADV) can be utilized to identify the root causes of low market share and appropriate solutions post analysis can be deployed to address the same however as business benefits will be quite less in this category due to low growth potential; companies may not be really interested in taking up such projects. For Questions Marks Category, DMADV / DAMIAC approaches can be used for better design of the products and increasing their potential to become stars. Here the potential is high with high business benefits, therefore most of the organisations will be interested in launching such projects at this stage to attain the leader position for their new products. For Stars Category, Six Sigma projects (DMAIC / DMADV) can be initiated to retain or increase the high market share with development of new design / concept that can help the product to retain the leader's position in long run by generating the higher revenues. As Business benefits are again high here, companies would be very much interested in launching such projects. For Cash Cows Category, since company already has the high market share for the product; six sigma projects can be taken up to reduce the cost and also to improve the design if possible which may help the product to retain its high market share. So if I have to order the priority of the projects, Question Marks & Stars must be top priority due to huge growth potential ahead followed by Cash Cows and Dogs (We may not even take up for 'Dogs' category due to less benefits but high costs involved) .