

Sudhir G
Members
-
Joined
-
Last visited
-
Thinking Fast and Slow It is the two side of everyone’s personality – everyone keeps thinking fast as well as slow. When there are – casual decisions to be, routine decisions, very practical decisions, emotional decisions, everyone thinks fast and take a quick decision. Whereas – when it is odd situation, no normal event, very impactful (important) decision, everyone takes time to think and decide. One thing – there is no difference whether it is professional decision or personal life decision. As I stated one has to think fast as well as slow as per situation and it is essential where it is needed fast one has to fast. Where slow is permissible one should buy the time. Fast thinking – Importance – it is very essential to think fast when one is riding and has to overtake a truck, and a bus is coming from opposite directions. One must judge the distance between truck and bus, the speed by which they are approaching to each other. In this case most important is the speed of rider, the safe distance he will get while overtaking the truck and position of bus. He must quickly do all analytics compared with his skill if it may become critical situation. Consider the distance between two vehicles, essential skills he must turn swiftly. Looks to be very normal and regular activities everyone does many times in a day. This is one example and there are many such decisions one must decide like – response quickly to some important mails, respond to important impactful conversations in a meeting, reply to the audience while presenting critical project proposal and so many more such situations. Essentials skills/ intellectual/ knowledge and emotions one need to have. Practice makes man/ woman perfect! From where practice becomes perfect? Every individual needs to do constant self-study, analyse own reflections, learn from own mistakes as well as brilliant things done. This is emotional part. On analytical side – a person needs to have adequate (rather more than adequate) knowledge and intellectuals to break the decision in parts, analyse each piece in minute detail, collect all the pieces and conclude the decision. Skills – combine both the above aspects and finally decide, speak or act and see the results. Most importantly all this happens within very few minutes. This very critical ability of a person to process whole the data points and present a decision. It is only possible when one is equipped with – All related knowledge, able to balance between emotions and practical aspects of the situation. Process complete matter within few minutes. Check the impact of the decision and strategic readiness to have another option, if something goes wrong. On the other side – Slow thinking is required when – One has to prepare a PPT for an important project, proposal for some impactful task to be completed for productivity and profitability of the business. Reply to an important mail asking for vital data, analysis and recommendations to the senior management. Deciding a right candidate for a position of critical importance for business. Sometimes conflict management between department or across the departments. On personal front – which college, branch son’s/ daughter’s admission to be taken. Like this and many more occasions where one has to decide very deliberately. Essentials skills/ intellectual/ knowledge and emotions one need to have. For slow thinking process also, one has to have all the skills, knowledge, intellectuals and emotional balance. Detailed analytical knowledge to process huge data, analysis of data to come to a very specific and accurate solutions. Problem solving techniques, FMEA, six sigma, lean concepts, every thing comes to help. As one is having sufficient time to process/ scan all the facts and figures through these techniques. The possibility of decision / solutions coming to be accurate is much larger. Most important one is having chance to reviews the complete process more than 2 to 3 times and refine the decisions. Emotional balance (quotient) is equally important in this case, also. If emotions try to impact the whole thought process everything can go to toss. So, analytics should be at top and no impact from emotions. No doubt if it is situational demand emotions may prevail analytical data analysis and one must have that skill, ability to decide. There are available few books on this aspect of thinking, and it gives more systematic ways to develop both the thought process. Conclusion: - Fast and slow thinking is like a head and tail in everyone’s life. One must practice and exercise both the concepts with equal importance as both are required in critical situations. Most of the situations involving these requirements are most impactful and need to choose wisely. One can change fast thinking situation to slow thinking and can save by more accurate decision making.
-
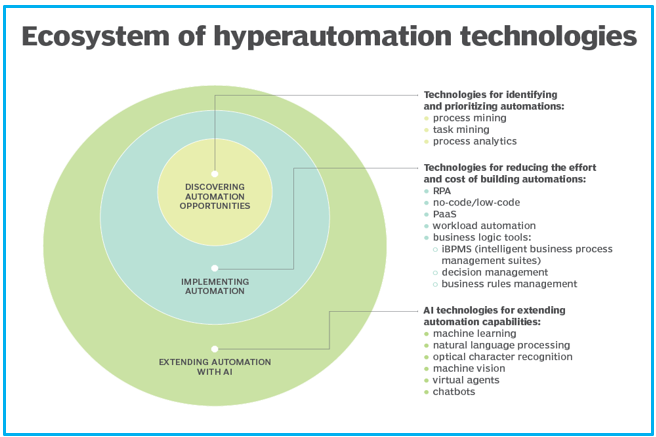
Hyperautomation! Prelude – I had joined an organization 14 years ago. We had extensive manpower for 1. Washing the utensils and equipment used in process. 2. Contractual labour for shifting the raw material to the machines, 3. Labours to check the product and correct for accuracy level, manually. 4. Contract labours to pack the boxes and shift them to the bounded storage location. 5. Labours to print and paste the labels on the boxes. 6. Labours to shift the packed boxes and shift them to the dispatch location. 7. Labours to load the boxes in the truck. And finally, goods used to dispatch. On the softer side – 1. We had a system to record the performance of each machine manually on papers. 2. Record all incidences on the machine manually in SAP system. 3. Analyse the data by brainstorming. 4. Whenever there any deviation in the process experts were consulted to correct the settings. 5. Engineers need to keep records of process parameters critical to quality and refer as and when required. Challenges – most the things were with manual intervention – It used to affect – Response time for deviation in the process, Accuracy of the action to correct the process, Accuracy of results and Re corrections, All these aspects of the business processes used to impact heavily on- Productivity – Profitability, On time dispatch to customer – Customer service and satisfaction, Customer complaints - Brand image in the market. Strategy – Considering all above facts and figures getting impacted negatively – Organization decided strategically to go for Digital way of doing business and invested in Digitalization – IioT, AI enabled technologies, machine learning, Robotic process automation – AGVs, automated business process management etc. A. Integration – Complete business process was scanned, and all the elements were connected from the point of automation. The sequence of events, processes were brainstormed in the views to get the required benefits. The challenges in each link were detailed discussed. Thus, all the sequence of operations integrated from the point to modify, upgrade. B. Discovering – As per above links – each and every task was analysed and explored from the automation implementation point of view. It was minutely scanned which aspect of automation will work like, AI, machine learning, robotics, AGVs, SCADA/ APROL etc. All the advanced systems were integrated. C. Implementation a. Automated systems used for labour intensive jobs like washing systems replaced by automatic washing machines along with loading and unloading. b. Raw material supply to the machines were done by AGVs. Machine learning also got integrated here. Raw material requirements were directly communicated by machines to concerned departments and instructed AGVs digitally. c. Packing forwarding - All logistics related activities in dispatch department got automated and saved lots of labour. Packing the boxes and pasting the boxes and shifting to storage got automated with AGV, Robots etc. Storing of the boxes and retrieving at the time of dispatch got automated. It improved accuracy as right consignment going to right customer. Loading the boxes in the truck got automated. AI, AGVs and machine learning helped integrate all the sequence of operations. d. RFID – was at a great support in reading data and for flow of communication. e. IiOT – enabled capturing most of the data directly from the digital devices installed on the equipment in process monitoring. It gives trends as well as history of process to correct the process in future. It improved flexibility in adapting new product with agility. f. Process monitoring – All the information available on the SCADA in the form of figures as well graphs. This helped to conclude the actions manually as well as automatically. NO expert intervention needed. D. Monitoring – Governance a. There is a dedicated department integrating all advance systems at a single place to monitor the performance of each element of Hyperautomation. b. They provide real time solutions and trouble shooting to get the maximum benefits out of it. c. All the data collected real time, is analysed by system itself and it takes own decision with very minimal human intervention. Benefits – 1. Labour requirement drastically came down to 35 to40%. It gave higher profitability along with better accuracy and no dependability on human resources. 2. Shift in skill of manpower – skilled labour requirement shifted to semi and unskilled labour for only few activities. Expert decision makers were got reduced. directly benefitting to Profitability. 3. Accuracy in production improved due to digital analysis with the help of modern tools to find accurate inference. Real time corrections reduced wastages and improved productivity. 4. Visual factory – all critical process parameters available at ease. Sufficient data available for future reference and past analysis. Quick access to trends enabling exploring further for upgradation in business. 5. Better brand image for the organization – Digital control impressing the customers with minimal human intervention enabled easy to control all statutory compliance. Bigger business opportunity with customer delight. Customer getting converted to be partner in business process. Conclusion – World economic forum (WEF) –Improving the state of the world by the belief in the power of human brilliance, entrepreneurship, innovation and cooperation. WEF highly appreciate and certifies the organizations having Hyperautomation in their business management, had appreciated the above organization I am talking about. This is the power of hyperautomation which leads to better Productivity- profitability, Better customer delight and better society. ------X------
-
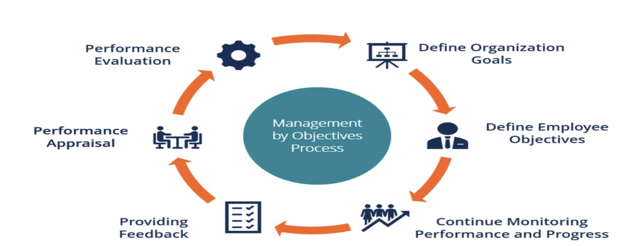
Management by Objectives – MBO. How does Lean six sigma principles integrate with the MBO framework. Right from our schools we know the word objective. Before doing any practical / demonstration for science we had to write objective of that exercise. Objective specifies the purpose, expectations, and need of that exercise. In corporate this word has a great meaning as it defines the direction for the organization for growth. It defines the specific goals to be achieved by the organization to fulfill short term (annual) and long term (as per vision of the organization) goals. In all this process the word – GOAL – is having complete emphasize and it is at the driving seat of the organization. It further percolates to the senior leadership – middle management and upto the last associate of the organization working on shop floor. Simply the senior leadership has a vision for its organization for may be next 5 years. This is split into annual target. Accordingly different areas, departments are assigned the targets. Here comes the RACI matrix of lean. To fulfil the sales target, production has to manufacture the required volume and quality has to ensure that the product meets customer satisfaction. Purchases need to maintain the required inventory along with stores and so on for other functions. One thing to be noted- The goals are SMART. As an organization visualizes its specific growth (e.g. achieving preferred partnership status with customers) in numbers (increase in volume sold) according to its strength, capabilities, skill sets available within specific time duration of one year. The goals set are- S – Specific for CEO, every head of function/ dept, manager, engineers and shop floor associates. M- Measurable – Every aspect of his role and responsibilities, accountabilities are figured in numbers. E.g. per day production, number stoppages of machine, number of new customers brought in for business, volume sold per quarter, cost reduction in %, projects completion within specific time etc. A-Assignable – Clearly mentioned who will do what. R- Realistic – Goals are close to reality of market scenario, available funds, resources etc. T – Time bound – there should be a time limit to achieve every goal to fulfill all short term projections. Thus, by setting SMART goals for every individual, every organization starts its financial year. Employees are provided all required resources. The goals are reviewed at defined frequency and there can be small corrections as per reality. Finally, the performance of every individual right from CEO, COO, CHRO, Senior management, middle management, engineers and shop floor associates is measured compared to initial targets given in goal sheet at the start of financial year. Every individual is given a performance rating and accordingly his next year salary hike and bonus is decided. This system was first popularized by Peter Drucker in his book in 1954. Hewlett-Packard, Xerox, DuPont, intel were the few companies implemented these practices many years ago. Presently there many companies following these practices and getting the required productivity, profitability and growth by systematic tracking this process. In ACG Associated capsule it is a well-documented process and completely digital. Every year from December the strategic meetings are started to finalize Business score cards, to fix Functional score cards. They are split according to different functions and further it is divided into all managers, engineers and shop floor associates. This process is completed in the month of March. From April everybody works for his goals in complete collaboration with all CFT to achieve daily, monthly targets for the organization. In the month of October, the mid-term progress is reviewed and work is done on the gaps. Finally next year’s June annual appraisals are done, and a performance rating is given. There are four categories for performance rating – Basic, good, excellent and outstanding. Previous year’s performance becomes basic for next year’s performance, Naturally excellent and outstanding performance levels are higher than previous year. To achieve excellent and outstanding performance, every individual has to think out of box, stretch his physical and mental muscles. Every organization need growth without expanding every year, without adding substantial manpower and funds every year. Then, how come growth comes? Here Lean six sigma integration supports- Voice of customer – The objectives for the organization are mostly driven by the voice of the customer. What quality (specifications) exactly he wants, how much volume at what time he needs are the key factors to set the goals. What delights him is the hygiene factor. It largely helps to define FSC (Functional score card) and BSC (Business score card) Value stream mapping / Pareto charts – We always keep track of the flow of materials, process to see the wastages and opportunities to optimize resources. Pareto helps us to focus on specific areas to improve upon. Control charts – They are the mirror of our regular production, indicating what is going correct and where need correction to produce continuous quality product to delight the customer. It helps to monitor critical quality parameters to keep them on target. Five why – It helps us to get the root cause of any quality defect or breakdown of machine. With the help of Poka Yoke, Error proofing, OPL we avoid it and sustain the manufacturing of quality and volume to meet the productivity. This is part of weekly review for continual improvement of machine continuity and product quality. DMAIC approach – The essential tool for six sigma projects, emphasizes the major improvements in the system and gives multifold benefits with respect to cost reduction. It involves lots of Data collection plans – it is essential for the accurate analysis of the process. Project charter – guiding what to achieve from current situation within what time and with which team. Fishbone diagram helps to identify different elements of the process and find where to focus. These are the vital tools in this approach. We improve the productivity by reducing losses by 2 to 3%. Kaizen – Personally I have made few modifications in the process, methods, spares or developing altogether new components to achieve better quality of product. To get better continuity of machines for on time delivery to the customer. Brainstorming is key to getting valuable insights from all stakeholders. By modifying or introducing new components we improve the continuity of our machines by 1.2 to 1.6%. Conclusion:- The vision and mission of the organization is systematically achieved by dividing it in the annual mission. These are the objectives for the entire team in the form of goal sheet. They are SMART and reviewed by the immediate superior for keeping the employees aligned to the goal of the organization. The performance rating at the end of year is the reward for the employee and achievement for the organization. The lean concept helps to achieve more, better productivity within same resources with the help of improvements in the system, methods, processes, components, machines. Most of the tools of lean sigma can be integrated to achieve the mission and vision of the organization.

-
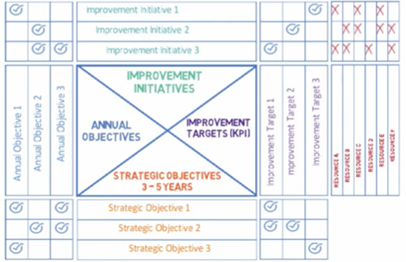
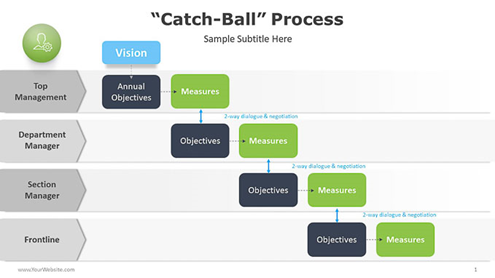
Hoshin KJanri is a 7 step process to communicate and implement strategic goals through the organization. It gives a systematic direction to manage the policies those are chalked in board room. It is also known as Policy or Direction management. Hoshin+ Kanri = Direction / Policy + Management / Administration. Organizations like Toyota the big name in automotive business, which has achieved phenomenal success with the help of directing their strategies which are based on strong foundation of their vision and mission. The key to the success is the annual goals,two way communication between all layers of management, regular review, Study the situations, Plans to achieve the required results and execution. It involves following steps:- 1. Develop Vision, mission and x Metric:- Every organization is having the visions to reach at a particular Goal with the help of its mission. Vision and mission are the two important wheels for the growth of the organization. It is supported by the executable Metric formed according to the mission of the organization. X Metrics is the canvas prepared by management to execute the strategic goals. It includes – · Strategic Objectives for 3 to 5 years, · Annual objectives, · Improvement initiatives needed to be taken, · Improvement targets (KPI) – the important indicator to keep the growth on track. As indicated in the figure above – it shows the different metrics and their relationship between. It also covers the allocated resources with responsibility for individual initiatives. 1. Identify breakthrough objectives:- Why breakthrough – yes objectives need to be breakthrough to be ahead of competition, sustain the business growth. These are generally for 3 to 5 years and stands on the strong foundation of companies vision and mission. It takes into account companies strength to strengthen the performance and weakness to take into account to overcome. 2. Set annual objectives:- It is necessary to bring break the long term (3 to 5 yr) goals into annual goals for easy implementation, monitor and get the results. The annual goal management helps to structurise the long term goals in systematic small goals. It is easy to plan small small things easily and execute effectively. It ensures the results. 3. Develop via catch ball:- The “Catch Ball” technique comes from the game – base ball where the ball is passed from one player to another with a strategy and finally Goal is done. In Hoshin Kanri the vision is transferred as a mission from- ü Top management to middle management, ü From middle management – departments, ü From departments to section manager/engineers and ü From engineers to shop floor operators. This way the mission is achieved to fulfill the vision of the organization and strategic annual goals. The key factor is two way communication at all levels to adjust the goals, negotiate and achieve them effectively. 1. Review results weekly, monthly and annually:- The most important step in any planning is to keep the track of the progress. It is the indicator which intimates about the lagging and leading parameters of the targets to be achieved for that particular period. To achieve annual targets effectively they are break down to monthly or weekly. In mass production it is advisable to break into daily targets. The scheduled review gives the directions to correct the space, modify resources and change the weekly strategy to bring the required growth as per target. 2. Problem Solving – PDCA:- Like growth and opportunity – Challenges are the part of business. It stops the growth engine for some time. To overcome this lot of planning is required. The proven technique of PDCA - PLAN – Do – Check and ACT is very helpful here. Checks ensures the things happen in right direction. It helps to achieve first time right and saves lots of cost involved to maintain profitability for the business. 3. Reflect and learn for continuous improvements:- Reflection is the key to success for every business. It involves continuous improvement- CI – Continuous improvement is not remained as the buzz word but fast track way to achieve growth in terms of more market share, on time delivery in full to customer at competitive price with high moral of workforce in safe atmosphere. Continuous improvement teaches us to learn from the mistakes, overcome them with advance techniques like Six Sigma, lean concepts, Kaizen etc. Reflection:- To heat the target directions are very important, the path to follow the directions is very important. To keep oneself on that path is the key to achieve the success. Hoshin Kanri practically known as the Direction or policy management gives the systematic directions to the business to achieve strategic goals which fulfill the vision and mission of the organization.
-
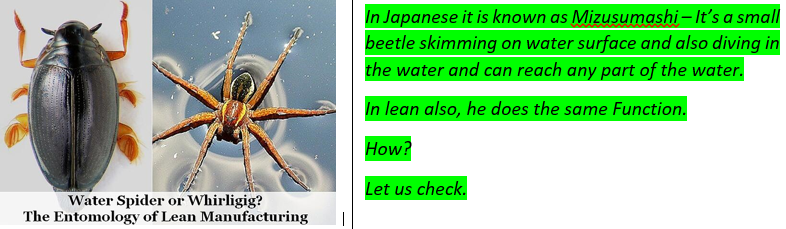
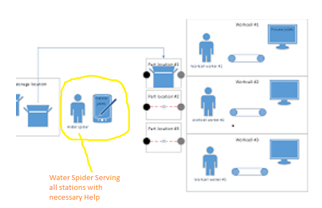
Water Spider in Lean Manufacturing. Productivity is the biggest objective of the Lean Manufacturing philosophy. There are so many aspects in lean to achieve productivity which leads to Profitability and Growth to organization. Water spider plays the important role in lean to improve productivity. Who is the water spider in lean? AS the term suggest a water spider in lean is the person skimming all around the shop floor and entering in any cell as per requirement. He not only enters there but also helps the operators for small challenges they are facing. In every production activity there are different workstations and operators are working on them. They require raw material, billets, blanks, semi- finished goods, tools for their operations. They transform them as per requirement and send it to next station. This is the flow going on up to the finish product. Imagine if every operator must visit another station to collect the raw material for his station – How much Time he will spend? How much distance he will travel? How many components he will be able to finish on his station? What if he faces any challenge? The answer to all these questions is Water Spider – A person who keeps rounding all the stations, cells and keeps filing its inward trays by blanks, semi-finished goods to be transformed. Picks the worked upon goods and moves them to another workstation. The operator never needs to wait for the inputs (good) and need not to worry about the outputs (goods) he has transformed to next stage of shape. If any operator is facing any small challenge of adjusting tool, settings, this person is the great help to reduce his trouble and increase his productivity. So, this person allows the operator to spend all their working time on their station, no waiting, no movement, complete output as per time study. Complete Value-added Job by operator. Here we get the answer – Water spider for all above questions. Roles and Goals of a water spider: - 1. JIT – Very important to control inventory on shop floor so he has to fix his schedule and supply the goods, tools, blanks etc. at the right time and in exactly required quantity to avoid any blockage or starvation. 2. He must be having knowledge of the production process and sequence of operation so that he can plan his rout and schedule for smooth flow of production line. 3. He also, to have knowledge about tooling and machines so that he can help in between to the operators is they are facing any challenges. 4. He must know about Kanban – he should pick and place the cards and update them for further information. In case of ERP he must be able to operate the system and keeps the data updated for replenishing the goods at main stores. 5. Time management – He should standardize his route to save his time and be able to use spare time for other stuff. 1.One of the beautiful examples I had seen in Israel in one the cutting tool manufacturing company – It was an AGV, moving continuously in a particular sequence and picking the semifinished cutting tips- moving to the next station- and so on. Picking the finished tips and keeping them at a designated place to be sent to stores by another AGV. Its sequence was so balance that all 16 automatic unmanned machines were completely synchronized. 2. I was Fortunate to visit one of the two-wheeler company in India manufacturing a scooter every three minutes. There I saw water spiders moving around the different shops and feeding all spares and components. They had kept the movements of operators so mechanized to get the maximum output from them and they were able to assemble a scooter in three minutes. The same person helping the operators to change the tools and adjusting the air required to pneumatic tools. In the same company there were a Robot managing ten CNC machines machining the complete spares required to assemble an engine. Conclusion- Transportation, Inventory and Motion are some of the wastages on shop floor and they eat productivity of the productive operators. By eliminating them with the help of line balancing and Water Spider an organization gets tremendous benefits. Water spider maintain JIT technology and keeps the shop floor neat and clean from unnecessary inventory. They keep productive operator adding their value addition in work to get accurate and quality production. It helps organization to achieve Productivity – Profitability and Growth

-
When I was working as maintenance head, I was facing a very critical challenge. In one of our sub assembly one small pinion was fixed at one of the end of a spline shaft with the help of a small thick washer and an allen bolt (M6). Problem – As there were alternating load on the spline shaft bolt used to get loosen and washer getting dislocated creating major accident in running machine. Or sometimes head of a allen bolt breaking and creating major accident. There used to be loss of productivity due to machine stoppage, cost of breaking spares and total used to be in the range of Rs. 70 to 75 thousands. It used to happen 3 to 4 times in a month. Huge loss. Solution – I called a meeting of all supervisors and operators working on the machine and started discussing the problem and solution. ü We created a table consisting of different spares of the subassembly on right side. ü Creating attributes those can be worked upon those spares. ü Started combining the different options of spares and different actions of them. ü Kept recording all possible options. ü Every option was evaluated for feasibility and all functional aspects. ü It gave a very creative solution which we never thought of. Remove washer – Add mechalock – redesign pinion – redesign spline shaft This worked nicely and the problem was just eliminated. Who played the magic? SrNo Attribute Spare 1 Spare2 Spare3 Spare4 1 Fine Setting NA NA Do Do 2 Change the setting Do Do NA Do 3 Redesign some spares Do Do Do Do 4 Remove some spares Do NA NA Do 5 Add new spares Along with Spare 1 Along with Spare 2 Along with spare 3 Along with spare 4 *** 1. Considering current situation and feasibility we have purposely kept few spares untouched. 2. For service industry same matrix by replacing word ‘Spare’ by ‘Option’ may work to solve the challenge. The matrix we discussed the different combinations we gave thought played the driving force creatively to arrive at an innovative solution. It led improving productivity along with reducing financial losses. This matrix we discussed! This innovative and creative combination was given by the matrix – Popularly known as Morphological Matrix! A Morphological matrix is a innovative and creative tool to facilitate generating hundreds of ideas. It is always not possible to think very creatively and out of the box just looking at the challenge. The matrix help generating ideas to solve the problem, find creative option for new design, new plan. Steps in Morphological Matrix- 1. Creation of the Morphological Matrix or Chart - SrNo Attribute Option 1 Option 2 Option 3 Option 4 1 Function 1 Combination1 2 Function 2 Combination1 3 Function 3 Combination1 . …… Combination1 N Function N As per the assignment or task in hand we have to make the table as above. · The right hand side gives different options. · The lift hand side column consists of different attributes related to the task for solution. · Once the basic frame work of attributes is prepared start filling different options. This could be a group activity. Explore any divergent idea, it may sound stupid. Fill the table with all possible and even not possible options. We don’t know things initially looking impossible becomes possible with other combinations, There is no restriction to the number of rows and column in the table shown above. As many number of cells in the table that much possible options can be generated. This could be visual also as shown below for selecting the best option for Chair design. 2. Explore creativity – Now starting from the first column of options combine with different other columns and start generating different solutions in a particular sequence. · Keep generating different combinations of columns and enter them in a table. · Evaluate each idea generated for feasibility after deep discussion. · This gives really unexpected combinations which looks to be very feasible, economical and most importantly innovative and creative. Conclusion:- While solving any problem, generating new plan, design it is always not possible to think divergently and explore something creative without a systematic framework. With the frame work of Morphological Matrix – consisting of different attributes, aspects of the design, plan or problem etc and divergent options. By combining different options and evaluating their feasibility we get many more options. One just need to evaluate the best possible option from them.

-
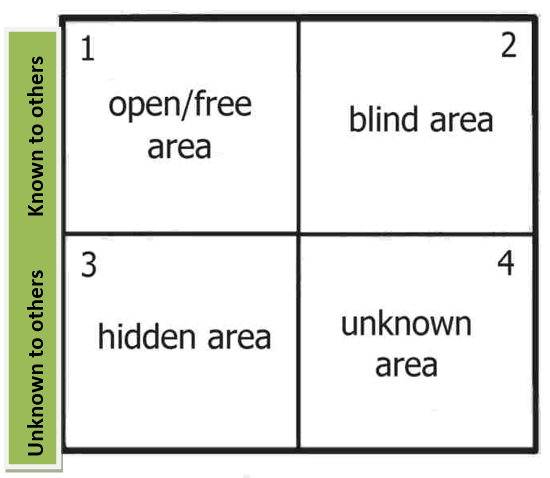
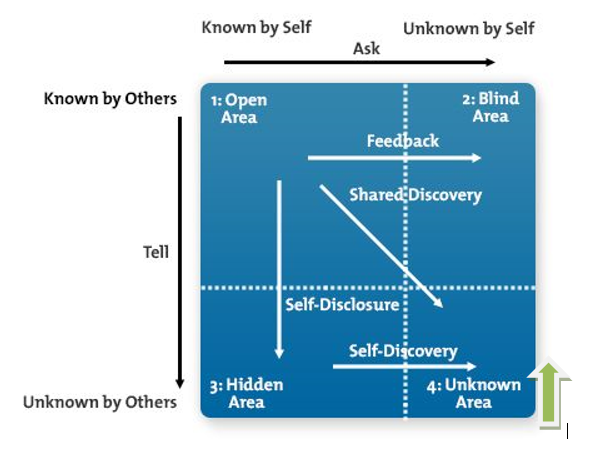
Few years back I was attending one of the assessments for pre qualification for promotion assessment. There were presentation of a case study and then a personal interview on presentation and finally feedback for result. A) In feedback session I was been told that my communication was very poor; I was interrupting the panel so many times. I was starting to speak before panel finish. And so many other things related to communication panel hammered me. I was just speechless as I was knowing pane giving feedback with data points they had collected when I was talking. It was a new information I was not knowing which panel highlighted. B.) I was bit late to the feedback session and panel was critical about delay. I explained the valid reason for the delay as I was busy with my departmental activities and arranging the spares for one of the machine which was down. Secondly panel was curious about my writings between the lines on presentation chart papers. I explained all those content and panel was impressed. With my explanation (which panel was not knowing) about delay, my concepts and contents panel cleared me and I was qualified for the final assessment. C) Now I had to prepare for the final assessment from behavior, competencies point of view for which I did not know much, I had to study with others experience. Above A, B, and C what does it indicate? A – indicates that I was not knowing about my communication style which I came to know from the panel as a feedback. B – Panel was not clear about my thoughts written between the lines and reason for my delay. I make them know about it and I got the marks and I cleared the assessment. C- Study for final assessment, I did not know, peoples around me also not knowing. I had to explore it by all means. Actually above event was one of the most important events for me as it was related to all my hard work, performances, results I had achieved for last few months. It was related to my Self Actualization – Achieving full potential including creative activities – Maslow’s Hierarchy of needs. It was related to my Emotional Intelligence. Accepting feedback and work on it. To explain my situation so that others can understand and I can achieve my goal is very important aspect of this event. Explore something that is completely unknown to me as well as for others is also a critical aspect of the life to Progress, to grow, to get matured, to understand others, make others to understand for overall wellbeing. To help me fulfilling my needs, achieving my goals - Johari Window Comes to help scientifically and psychologically. So let us discuss what is Johari Window Is? The above figure shows the Johari Model which is developed by American Psychologist Joseph Luft and Harry Ingham in 1955. Johari= Jo (from Joseph) + Hari (from Harry). In today’s industry it is very important as more and more emphasize is given on developing soft skills along with hard skills. Managerial behavior, fundamental competencies required for effective personal growth, team development, integration of new employee; Johari Window model gives accurate information and plays a effective role. There are four quadrant in this model 1. Open / Free Area – This is the area of one’s behavior, competencies, attitude and emotions known to him as well as others and they can have mutual connection and co operation built on this area. 2. Blind Area – This part is very crucial as others know about oneself but he do not know about it. It creates a major challenge for ones acceptance by others. Others accept only when it is fine tuned with their views, requirements, fulfillments etc. So a person has to know what others think about him. 3. Hidden Area – This is the area world do not know about oneself which he may be expert, he may be facing a challenge; it may be his potential etc. Unless world do not understand you, your potential it is worthless for world as well as oneself. 4. Unknown Area – This is the area everyone want to acquire but do not know how to achieve. This needs real discovery of unknown potential, competencies of self as well as what others can do for oneself. So it is clear from above, to progress, grow with complete understanding of one’s potential, attitude, capabilities, competencies, behavior, emotions, aptitude, goals etc. to the world and simultaneously what world can do, how world can accept is very essential. Basically there should not be a blind area, hidden area and unknown area in the life. Practically it is not possible so one can do his best to enlarge the quadrant 1 – Open or free area of his nature and accept others and make them accept for complete co operation and support. Usage:- To enlarge the quadrant 1 – Open area – ASK – for the feedback from others for things not known to self, Discloser – Disclose about self to others to make them know yourself, Discovery – Self introspection, study the behavior and counseling. *** The Johari Window model is a simple and useful tool for illustrating and improving self-awareness, and mutual understanding between individuals within a group. This model can also be used to assess and improve a group's relationship with other groups. This model is particularly useful in team development. Example:- We used this model extensively to develop a team in my last experience. a. ASK - It gives me required insights what team expects from me by transparent feedback. For this we use 360 degree feedback in a common team. I had allowed team members for their free and frank critics for my action. Company also had a system of survey to collect feedback from team members and peers. b. Disclose - Team can explain their challenges to get helped. Our weekly meeting used to focus on team development only. They were allowed to express their challenges, good work done to get know about their potential, attitude and aptitude. c. Disclose - Team members also get chance to explain their challenges to other team members. Continuous improvement was one of the major missions. While doing why why analysis team members used to express their challenges, co operation and help getting and expected from other team members. It also used to get highlighted while doing common presentations and projects. d. Team members had opportunity to give honest feedback to other team members about their potential, ability aptitude which we used to use in work and get benefits. e. Discover - Most important area was reducing Unknown area of team leader, team and individual team members. This was the major area to be discovered. i. Generally this was covering unutilized potential, fear someone has for some work or assignment, subconscious feeling or some typical behavior pattern. ii. To reduce this area to enlarge open area – Counseling was the best tool used after careful observations while doing some task, project or routine pattern of doing some activities. Conclusion: - with the help of 360 degree feedback, open feedback sessions in free and frank meeting one can get true feedback for self improvement. By expressing one’s challenges and potential he can be a good asset for the team. By discovering unutilized potential, hidden fear and effective counseling unknown nature of one’s own behavior can be discovered and utilized for the benefit of team. Johari Window gives an effective tool to get all above benefit. Softer skills are the foundation for everybody’s growth, every organization’s growth, Nation’s Growth.

-
Nowadays we all are very much familiar with a map shown on local news channel or national news channel with few areas shown in Red, few in Orange and rest in Green. The colors depict the severity of Covid 19 (number of cases) in those areas. Red = highly severe – large number of infected cases. Orange = moderately severe – Medium, number of infected cases, Green = Low severity – Very less number of cases. Depending upon the severity the rules for movement of peoples, doing the business in those areas are decided by government. Accordingly peoples are permitted as below, Red – No business, no movement, complete restrictions. Orange – Low movement, business of essential goods under moderate restrictions, Green – High scale movement and business with regular restriction. Thus it is easy to understand map which is shown on regular basis on TV news channels or in the news paper. It is a very effective way of communication to all concerned to take required actions. Actually what is this map showing? Areas with severity of covid 19 spread. Or simply percentage of concentration of Covid 19 cases in different areas to guide local authorities to take appropriate actions and peoples to decide their course of action. As this journey of medical treatment, preventive actions and changes in basic habits, exercise goes the percentage of cases will go reducing day by day and red zone becomes orange, orange to green and eventually all green. We all are engaged in the business of manufacturing defect free products. Manufacture defect free products is also a long journey and most of the time initial products are containing defects. Quality control (QC) plays the most important task to bring defect free products. There are 7 QC tools which comes to our help in analyzing defects initially so that we can reduce and eliminate them to make a defect free product. 1. Histogram, 2. Pareto Char, 3. Ishikawa Diagram, 4. Scatter plot, 5. Defect Concentration diagram, 6. Control charts, 7. Check sheet. Let us discuss Defect Concentration Diagram- A defect concentration diagram is the visual representation by a diagram or a map which shows the places on the product, where there are defects occurring. It also shows the frequency of the defects. Initially it is a plain diagram or picture or map. As analysis goes the diagram is filled with the places where defects are occurring along with number of defects at a particular location. Use of the Defect concentration Diagram- It is an effective research tool which is majorly used during the data collection phase of Problem Identification or measure phase of the DMAIC. Steps involved – 1. Define the defect or defects being analyzed. It brings clarity about defect or defects for inspector. It brings standardization for common understanding. 2. Making a diagram, map or the picture of the product to be investigated. 3. Mark the particular location where defect occurs with designated sign (colored) each time it occurs while getting investigated. Thus the particular location is getting with marks of a particular defect and also the number of times it comes. 4. After sufficient period of time analyses the defect with respect to location on the diagram and number of time it occurs. This count will give the severity of defects. *** Please have a look at following figure where different signs show the different defects and the number shows the frequency to show the severity of occurrences Further Action Plan – Depending upon the location there could be action taken on design parameter and production methods to control the frequency of occurrence.

-
IPO-FAT - Tool Hotelling is one of the favorite occasions for every individual. He likes to visit Hotel, have a delicious food – Lunch or Dinner. Everyone has a comment about the taste of the meal, time taken for the meal, neatness while preparing the meal, ingredients used, quantity consumed and left over etc. There are few aspects associated to that meal. Every meal is graded on all above factors and it is termed as overall Tasty, delicious or not so good meal. Meal received in time. Meal received in presentable way etc, etc. Most of the quality conscious hotels conduct survey and always keep improving themselves for all above aspects to have customer delight. This delight is going to keep them running and serving more and more customer. There is the Growth for them. Surveys give them overall picture. Where exactly to improve is the Big Question. The answer to this question is not so easy and Hotel management and staff have to really work hard to find the area for improvement. This is just one example, this is the case everywhere, and there are processes involved. Process is the basic part of every manufacturing; it may be food or machinery. So to find the step, stage where to focus for improvement for better quality, we need to divide the complete set of steps or stages of whole manufacturing and look at all steps with specific observations, analysis and then actions and improvements. These are the big activities involving compilation of the data from the survey, analysis of the data with the help of statistical tools, making inference from the tools, deciding different line of action for the improvement and achieve the results. In this case tools used for improvement may be Six Sigma DMAIC project, PDCA, Lean tools etc, depending upon the data, improvements required, importance, timelines available, feasibility and available resource. Again after some time same cycle keeps repeating as taste of customer, situations in market, advancements in technology keeps changing rather improving better and better. Every business has to keep evolving to sustain in the competitive market. Generally speaking there are following major aspects for every manufacturing – I – Input – the starting ingredient for every manufacturing P – Process – The value addition activity performed to get final (or semi finished) product. O – Output – Is the final finished (or semi finished for other process) product. Likewise every aspect is having three perspectives associated with it. These perspectives are very important to look at these aspects, observe them, analyses them and check for improvement. F – Flow – The way these aspects are moving. A – Accuracy – Check for the correct specifications and quality at each stage. T – Timeline – Most crucial from engagement of resources point of view. So every manufacturing is viewed through glasses of above three aspects and three perspectives – making a 3 x 3 matrix as below. The important steps are numbered 1 to 6 as shown in the table. Each one is analyzed as per sequence of 1 to 6. As per significance the sequence may be changed or some steps may be escaped. Once the steps are analyzed improvement may be done with the help of following methodology. - Six Sigma (Effectiveness) - Lean (efficiency) - Lean & / or Six Sigma - IPO-FAT Tool Aspect Perspective Input Process Output Flow 1. Incoming Volume 2. Work flow Rhythm Production Rate / RTY Accuracy 4. Readiness 3. Quality / Value Add Defect – DPMO Timeliness 5. Arrival / Set up time 6. Handle time Turn Around time (TAT) Practical use of the Tool. Recently we had conducted a study to reduce the Turnaround time of one of the activity as follow. The initial duration of the activity was 300 minutes and task was to reduce the duration of the activity to reduce downtime to improve Productivity. This was the activity done every month on 5 to 6 machines and hence was having most impact on productivity. 1. Incoming Volume – What opportunities are there to reduce the incoming volume from the prior output? - - After brain storming with team there were no much scope for incoming volume for the activity. 2. Work flow Rhythm - How can throughput (takt time) be optimized by evaluating FIFO, batch Processing or schedule balancing? In this case flow of work is analyzed - Yes there were scope and with the help of effective sequencing and balancing of activities nearly 50 minutes were reduced. 3. Quality / Value Add - What process steps don't add value, aren't required or don't meet policy/specs? All the activities are analyzed for the value addition as customer pays for only value addition. - Yes, there were scope and all non value adding activities were eliminated and 20 minutes were reduced. 4. Readiness - How complete or accurate are the inputs before the process? This is very essential. Simple steps of 5S helps a lot to arrange all the input spares and bought out required in easy accessible manner. The team was trained for doing first time right to reduce rework. - The readiness of spares and tools in a systematic and easy manner helped to reduce search time which further reduced 15 minutes. 5. Arrival / Set up time - How much delay between prior output and current input? How much setup or lead time is required before process? Offline and online activities were also bifurcated and most of the activities taken offline. - This was the major contributor and after systematic study it saved another 40 minutes. 6. Handle time - How much time to perform value-added steps in process? - Setting of the machine was one of the crucial activities. With the help of PDCA the activity was re defined and few one point lessons were given and displayed. This activity needed lots of accuracy. The effectiveness achieved by further 20 minutes saving. ( Due to confidentiality no much details are revealed) Conclusion:- In IPO-FAT tool - Distributing all the activities in simple easy to analyze manner. Brainstorming with team and deciding the tools to be used depending upon the criticalness and suitability the required improvement is brought in. This tool is most effective and easy to decide the project. Ref- StatStuff.com
-
Andon! Everyone knows his child hood stories of Alarms given by elders about not doing something by some typical facial actions, sounds or even by showing something. It was to warn a child for not doing something else he may get hurt, he may get injured or there could be an accident. And it used to work; the child will remember all those actions, alarms and will not go near those things, will not touch and this way his life was saved. He continued the same thing when he was matured enough to teach other children’s. Really a very powerful technique of teaching, alarming and warning someone not to do something or in better way – To Do – “Not go near, Not to Touch etc.” In actual practice happening something wrong, variation in the process, small or major accidents are the part of a regular smooth, nonstop, productive process. We are in manufacturing sector so let us discuss about Manufacturing. § In manufacturing set up there are so many different processes running continuously and at a very high speed. These high speed processes are producing million tons of products or units in million. The pace is such a high; the variation in process will lead to heavy losses. § If there could be a small addition of Friction in heating of moving parts – it can lead to a bigger accident in near future. § If it is not monitored for its output, there could be wastage of resources. Today we are in most competitive, cost conscious, quality conscious, delivery conscious world and will never afford all above wrong things from happening. Fortunately we are in the most advancing era of technology, manufacturing techniques are evolving day by day and we have got a powerful tool at our help to save manufacturing process is – ‘Andon’ Andon – Is the Alarming, Notifying systems developed for managers, Supervisors, workers etc to highlight the health of the manufacturing (or any system) system. Lean production system is the boon to the modern age manufacturing, Andon is also one of the principle developed by lean only. An Andon system is the one of the principle elements of the Jidoka quality control method pioneered by Toyota Production system and therefore now part of the Lean Production approach. Jidoka – Is the automation with human touch or simply Intelligent Automation – It is the combination of Automation and human interference. As fully automatic systems are not cost effective to make it more cost effective and also to produce effective quality products human interference is essential. So – Andon – it gives the workers the empowerment to stop the production line, production machine if any abnormality is detected. There are so many techniques available by which a worker can detect rather come to know about the abnormal operation is the system. A. Audio Visual – With the help of different types of sensors system can detect any sort of abnormality happening in the system. It could be small displacement in the components, it could be more load (stress) coming on the components, it could be temperature variation. There are lots of digital gauges available and they keeps monitoring the system round the clock and keeps alarming the workers, supervisors or even managers about health of the system. With the advancement in automaton there are visual displays (HMI - Human Machine Interface) which gives the exact location where there is malfunction happening. With this alarm ( there is whistle with notification) the operator stops the machine and attend the challenge and avoids major losses. If the challenge on the machine or in the system is sever, even in that case machine stops with alarm and notification display. The operator, maintenance team can act immediately to save the major losses. All these notifications are coded and in SCADA system all those notifications are recorded systematically and gives the frequency of each notification along with the duration it took to rectify. This analysis gives way for Kaizen which leads in reduction in such uncertainty and eventually uniform uninterrupted production. Recently machine learning is also coming to our help by giving or poping notifications before taking any action which may lead to loss of data or any uncerytainty. B. Manual – In so many assembly lines there are provisions to stop the line if there is any abnormality found in any spares, shortages of spares etc. With this complete system gets alarm and work in down the line is adjusted accordingly. Simultaneously the concern department heads get the alarm to replenish the stocks. Manual systems though tedious, troublesome, still essential in some cases. Everyone knows the great Titanic disaster. There are few sensory alarms human eyes, nose and ears detect very rapidly and need immediate action. This is most effective activity only humans can do with inbuilt system. Advantages- The alarms, the moment malfunction or variation in system starts stops the system and major losses are saved. It helps to keep the wastages in control, saves cost and keeps profitability in control. The systematic records of abnormality gives ways for Kaizen Burst and scope for Continual Improvement which the only way to keep progressing towards growth. Once there is continual improvement, there is uniform production at specified productivity which is very essential to maintain oneself in today’s competitive market. It improves moral of the employees with safe working atmosphere. Less defects – less stops, less stops – happy employees, Happy employees – less accidents. Let’s continue to explore!
-
Six Hats Thinking. In day to day life every individual comes across different types of problem and few are having very logical solutions. Few need some judgment and others need information and knowledge to solve. There are some problems can’t be solved by straightforward thinking or simply traditional way of problem solving. To ease this problem solving generally we call a group of peoples with different mind sets (different departments) and collect their opinions, suggestions, ideas (creative thoughts), and each idea is discussed in length and finally group arrives to a conclusion which is most suitable and agreed to the group. This final conclusion is accepted to all as it is most Beneficial solution. This is nothing but the Brainstorming between different individuals who are allowed to put forward their thoughts, opinions or ideas what ever comes to their mind. This whatever is nothing but the output of their lateral thinking. Lateral thinking – is the creative way of reasoning the facts and figures. Creative is not an obvious thinking approach of step by step reasoning, it applies some thing very different, some thing commonly known as Out of the box thinking. There is no restriction on applying ones mind in any direction using any concept may or may not look relevant in first step. Lateral thinking was extensively emphasized by Edward De Bono in his book- The Use of Lateral Thinking (1967). Further Dr. Edward De Bono written the book – Six Thinking Hats. The Book Six Thinking Hats makes use of lateral thinking of group of people to arrive a beneficial solution to a common problem. Each hat is having particular scope of thinking for a particular time. There is also a sequence to be followed for wearing the hats (may be virtual ) right from start to end to come to a beneficial solution. Let us see each hat in details and scope of the activities to be followed. 1. BLUE – “The Thinking about Thinking” – As name suggest to start any thinking there has to be planning how thinking to proceed. Blue Hat controls the brain storming process by asking team members their thoughts and ask to summaries. Hence generally it is starting hat and also at the End. 2. WHITE – Fact and information – While in White Hat – all participants just think about Data and information available. No judgment and opinions are given the thoughts. 3. Red – Feelings and Emotions – This the free flowing of thoughts without any judgment or explanation. This is the Time to vent out any air, feeling or conflicts in the air. This is very useful to bring all thoughts and feeling out, it helps to settle the dust very quickly. 4. Black Hat – Caution and Critical Judgment – This hat is critical as it funnels the thinking and ask for only realistic solution. It also do not allow Group thinking as some times it is influential. 5. Yellow – Optimistic and Positive View about things – While in this Hat every one think about Logical Benefits of the Proposal. It funnels all unrealistic solutions and team can come to a conclusion. 6. Green – Creative Thinking – In this Hat every one is encouraged to explore divergent thinking, Lateral thinking to generate alternate ideas and options. Advantages of Six Thinking Hat – 1. Brain storming is very essential step to arrive at a solution which is beneficial in real sense. In traditional way it happens in a very haphazard and unstructured way. 2. Six Thinking Hats – Gives a structure and sequence of thinking. 3. Each Hat is having very specific purpose right from – very technical to emotional. White hats deals with only Data and information. Red hats deals with emotions to clear fumes within and a clear mind for creative thinking. Green hats allows creative thinking and Yellow funnels them to only realistic and beneficial solutions. 4. Every hat is having very specific purpose and it focuses to specific goal and gives exact way of thinking to arrive a beneficial solution. 5. Thus Six Thinking Hat give a very structured way to bring all divergent minds together and encourage them for lateral thinking to bring a realistic and beneficial solution agreed by all team members. To Solve the Problem following sequence of Hats is used - Blue - White - Green - Red - Yellow - Black - Green - Blue
-
OEE – Overall Equipment Effectiveness is the net effective production on (or net Utility of) equipment. There are 24 hours or 1440 minutes in a day available for production. Ideally this complete time is to be used for production of the components or any commodity for which equipment is meant for. Practically it is not possible as equipment also need some rest in the form of servicing, it also need to be dressed up for new type of setup or sometimes it falls sick by breakdown. It may also not work accurately due to minor misalignments and need small adjustments or may want to work at slower speed. Its health to be maintained at optimum level. Millions of Rupees investment is done in every organization and every entrepreneur want it back as early as possible and start earning profits for future investment in all resources. This is the cycle every industry runs. So to have maximum return on investment every organization need to extract 100% utility of the equipment. In simple words every organization need to use the equipment 100% and not a single percentage of wastage or loss. This is the ideal scenario. So we need to consider all losses on the equipment, reducing its effective use. The net effective use of the equipment is the Overall Equipment Effectiveness or OEE. For every organization OEE is very important so it is essential – What is OEE? Overall equipment effectiveness is the measure of the production of right specification in available running time of the day. OEE = Availability x Equipment Performance x Quality Numerically A) Availability = Run Time / Planned Production time. Run time = Planned production time – Stop losses ( like breakdown, Planned Maintenance, Change over etc) Equipment Performance = Net Run Time / Run time Net Run time = the exact time available for production after reduction of small stops for adjustment, reduction of machine speed etc. = Ideal cycle time x Total number of product. C) Quality = Number of Good Products / Total number of products produced. Number of Good Products = Total number of products produced – Rejected/reworked products After Simplification OEE = (Ideal Cycle time x Number of Good Products)/ Planned Production Time 100% OEE = 100% quality in 100% available time with 100% performance. It is possible when there are no losses or minimum losses to have OEE close to 100%. Different Losses and their elimination or reduction. 1. Equipment Breakdown or Failure:- It is the most significant loss on equipment and major contributor in OEE. It has to be kept in control and practically no uncertain breakdown. It affects parameters Availability and Quality also. To reduce or eliminate it – a. All different type of breakdowns to be categorized and to be given a code. All instances to be neatly recorded. b. There has to be a Root cause analysis, 5 Why analysis for all reasons and effective actions after brainstorming to be initiated to arrest the repeat occurrence. c. Focused improvement projects, kaizen, OPL to be initiated and all solutions to be implemented for long term results. d. Effective Preventive, Scheduled and Autonomous maintenance gives big advantage in minimizing uncertain breakdown. 2. Set up or Change over time:- It is another major challenge affecting Availability of the equipment. It is essential before starting new product on the equipment. It may be from few minutes to many hours and hence one of the critical loss. To reduce it – a. SMED approach – Single minute exchange of Dies. b. There are number of activities done while setting the machine for new product after last good product of old batch and up to first good product of new batch. c. All Activities are neatly separated so that maximum activities are done offline while previous batch is running and it saves lots of productive time. d. The on job activities are done with the help of Jigs and Fixtures to reduce the time. e. While in running also components are unloaded and loaded in quick change manner in few seconds. 3. Small Stops or Reduced Speed:- There are few adjustments on equipment to be done to run the equipment smoothly to produce accurate product. Sometimes machine speed may have to be reduced due to worn out spares, bearings, changing essentials like film, blades etc. a. To reduce small stops there has to be a perfect preventive maintenance plan and also timely lubrication and monitoring critical performance parameters. b. Generally there is a pattern for small stops and one has to monitor them and apply 5 why analysis and find Kaizen Blitz and implement. Effective OPL helps reduce small stops by proactive practices. c. Standardization of machine operating practices by effective training and coaching of operator helps reduce machine small stops. d. Effective Cycle Time – Machine has to be run on its maximum speed by maintaining its health to optimum level. 4. Defects and Yield reduction:- In some cases there is wastage of product at the start due to initial adjustments and settings. It directly affects the yield. Some times in stable process there may be defective parts (either complete reject or rework) due to variation in dimensions. It is the major contributor to affect the quality. a. Start up rejection is majorly reduced by standard machine setting before start up and standardization of material. b. Defects are the variation in the specifications of product. It mainly happens due deterioration in the machine setting over the time. To avoid this, monitoring the machine parameter is very essential. In modern age automation is there to monitor the settings and alarms to indicate the variation in setting. Auto corrections are also available to reduce the defect generation. c. Process Control:- There are statistical process control of the product and machine operators monitor critical parameters and keep doing fine tuning of the machine to keep the output as per specification. This improve quality and reduce the rejection to large scale. 5. Total Productive Maintenance:- Planned maintenance affects total available time. With systematic implementation of TPM philosophy it can be streamlined and frequency of planned maintenance can be reduced. a. Autonomous maintenance by operator using the machine, increases the effectiveness of the machine to great extent as he always knows the critical points and always observing the machine very closely. The feeling of ownership makes him accountable. b. Preventive maintenance:- The frequency of the preventive maintenance need to match the life cycle of the spares and critical assembly. High frequency unnecessarily increase the stop time. c. 5S:-The most simple tool but equally effective to identify the challenges on the machine for preventive maintenance. Control inventory of spares and loss of time to search spares for maintenance. Cleanliness and standardization boost moral of employees to motivate them to improve machine performance. d. Mistake Proofing helps in reducing defective production as well as facilitate in improving availability of equipment. As highlighted earlier all above challenges are the integral part of every system of production lines and hence losses are there. Hence we can’t get 100% OEE in any situation. With implementation of above controls in place OEE can be increased and maintained for longer period. Visual management always keeps highlighting the Process parameters, performance indicators to catch the attraction of concerned employees. It allows timely actions taken on equipment which in turn save major losses to be happened.
-
SMART Every morning comes with a small goal of the life, it may be some to do task for that day, completion of the pending or incomplete activity started yesterday or few days back. Basically all big goals are divided in small goals and as these small goals are completed everyone completes a big Goal. Before forming any Goal it has to be achievable and hence achieved. If not achieved, there could be less inputs put in, inputs may be not in right and specified direction or not in specific way. One more factor is, if Goal is not achievable???? In this case it is all waste, wastage of all activities done, time spent, money spent, morals invested, expectations etc. For that all Goals are always SMART – Specific Measurable Achievable Relevant and Time bound. So it is very essential, Goal has to be ACHIEVABLE! Before we come to know if any Goal – may be improvement in the system for example – reduction in production time of a product, or cost reduction etc, is achievable or not, it is essential to have complete knowledge of the activity. Where from this Knowledge Comes??? Balanced Score Card- It gives us a big picture of the performance of the organization with respect to different metrics decided by the organization. These are the performance indicators which indicate the area organization doing well and the area where need urgent attention as the performance of the organization is always a combined performance of all areas or metrics. Lean- What is Lean Philosophy? Reduction of all sort of wastage, yes in simple language. Where are the waste is most important question everybody ask himself or other. For this there are few tools derived, applied and proven. Value stream mapping – As denoted by the word ‘mapping’ it maps, observes, analyze the complete flow of the activities, processes carried out to produce a product or any required service. SIPOC is the High level map of the processes carried out which gives the connections between the process with respect to Supplier, Input, Process, Output and Customer. In this each and every element is important as it is having its own importance on the performance of the processes and collectively on the manufacturing process as a whole. Typical steps involved are- 1. Document the specific customer requirements. 2. Follow, map each and every process contributing to the complete manufacturing. 3. Collect the data of the processes with respect to – a. Cycle time, b. Available time, c. Set up time, d. Batch Size, e. Quality ( Rejection, defect etc), f. Rework if any g. Number of people working at a station, h. Equipment performance level. i. Number of shifts. 4. Note down all above information along with inventory at each station, 5. The above information will give the relationship between every element. *** Here there comes analysis of each step whether it is Value Adding – for which Customer is willing to pay. Non Value Adding – for which Customer is not going to pay. Goal is to elimination of Non Value adding processes or steps, if not possible complete, reduction in the steps is essential. 1. Brainstorming within the team and elimination of the unwanted steps will give the achievable solution to the problem of waste reduction. 2. 5S is the most encouraging visual tool to give achievable control on inventory of spares. 3. Line balancing will highlight the bottleneck at the process and also how to remove that bottleneck may be by adding more machines or manpower. This also leads to reduction in the excess manpower in the system. 4. SMED approach with eliminating on the job non value activities and converting maximum possible on the job activities to the odd the job will reduce the set up time. 5. Process Performance measure – Is the mathematical tool which gives throughput rate, lead time, Cycle time. These parameter suggest achievable actions to improve them to achieve goal of process efficiency improvement. 6. Simulation is another aspect in which with scientific calculated assumptions and with crystal ball we can fix achievable Goal to improve the process. 7. Hypothesis testing a part of Inferential statistics, is a systematic tool which allows us whether to accept or reject the claim (the goal in question). This is another approach to find achievable goals. 8. Correlation and regression analysis which gives the relationship between two variables. This relationship also can lead to achievable goals by controlling one variable. 9. Pareto Analysis – It also gives relationship between many different inputs and gives major contributors to be controlled. The results of all above activities help us to decide achievable results for the activities in the goal statement. This will help to decide achievable Goal!
-
Sudhir G changed their profile photo
-
The covid 19 pandemic highlighted 3 waste Muda, Muri, Mura in Health care sector. Muda – This is the waste comprising of other few waste on shop floor, In this case let us consider Health care system. It is denoted as - WORMPIT. W = Waiting time for the patients to get admitted – Taking lessons from other countries suffering from this pandemic, State Governments has to be prepared well in advance regarding facilities for patient like, beds, dedicated Hospitals or wards in the Hospitals. O = Over production – It was been observed the excessive documentation in processing every individual traveling to other places and it had created lots of burdon on the system. They had to apply few specific and effective testing system to keep it simple and specific. Less than 1% people travelling were detected positive. R = Rework – There were complaints about quality of PPE kits and it may have resulted in infection to the doctors and nurses wearing them. This point had to be taken care well in January and February 2020. There had have to be strict standards for the quality of PPE lits with SOP for their quality check, and it had to be followed very seriously. It was like Sharpening the saw, few deaths must have been saved. Few health care workers might have been infected due to low quality kits. M = Motion – The patients had struggled a lot to find vacant space, beds and ventilators in suitable hospitals and there were no common place or control room to guide them in such painful situation. This led to few deaths as no facility were available and patients kept searching for facility. There has to be a central control room in every district particularly giving information on essential facilities with transportation facility. P = Over Processing – Though Quarantine was a essential thing, it was applied all across without giving due consideration on the place person coming from, the situation there the possibility of might be having infected, all were sent to 14 days quarantine and it increased a heavy load on the system with respect to manpower, expenditure and delays in results after testing. At so many places they could not manage basic facilities to the peoples. Local administration had already devided the localities, town and cities in Green, orange and Red zones, instead of focusing on complete districtor state health care staff had to consider the individual area from where person is coming, its own health and the way he had kept himself in isolation before traveling. I – Inventory – It was the biggest issue. In this case it was shortage of inventory of PPE kits for doctors and it also led to infections to the doctors, nurses and other staffs, police etc. It was really a serious challenge. Also beds for patients were not available and they are forced to take care at homes increasing chances of spread to other family member. Also due to non availability of beds in time there were few deaths. Health ministry had to plan the sufficient number of PPE kits and beds well within the time taking lesson from other countries. T – Transport – Transportation of dead bodies was a major issue and they remained on the beds around the patients creating threat and tension to the common patients. Hospitals had to keep dedicated staff for the transportation of dead bodies to their destination. Even a common team handling this operation would had given effective results with less manpower. Muri – This is the overburden, excess workload and things which are not directly visible. Yes in this case it was been repeatedly heard that few doctors, nurses, Police staff were working excessively round the clock with very less rest. They were forced to take rest on work place. They could not visit their families due to fear of infection. This all were adding lots of Psychological and metal tension. It was also heard few deaths of health workers due to heart attack, it must be due to panic conditions they were handling. This all could had been saved if right from the beginning Private Hospitals would Had been given SOP to operate with respect to Bed charges, general hygiene conditions and social distancing and most importantly they had to be instructed to keep operating as most of the Private Hospitals were closed. Mura – Interruptions, Unevenness, Instability and Inconsistency in the system. Repeated changes in the controlling power, inconsistency of the controlling power were few cases to worsen the system and adding cases of Covid 19. No doubt increase in the covid cases were not linear and it didn’t allowed system to plan the infrastructure in sufficient numbers. This led to scarcity of valuable resources.
