

Kavitha Sundar
Members
-
Joined
-
Last visited
Everything posted by Kavitha Sundar
-
Q 56. Though they seem to serve the same purpose, what is your preference between ARMI and RACI? Why? In the project management, whether the project involving DMAIC / DMADV methodology, the responsibility assignment matrix is to clearly defined to avoid role confusions. GRPI (Goals, roles & responsibility, Processes and interpersonal relationships to be clearly defined in the team work. ARMI – stands for Approver, Resource, Member and I – interested party. RACI / RACIS – stands for Responsible, Accountable, Consulted, Informed and Support RACI is one of the commonly used tool to breakdown the teamwork into doable tasks, and map to each of them that who is responsible, who is accountable , whom should we consult about the assigned task and whom should be informed about the task and its progress. This is in simple a responsibility assignment matrix. ARMI is similar to the RACI matrix, where it defines the level of support assigned to each of the stakeholder. RACI / ARMI Description R - Responsible The person assigned to the task. Simply doer. A task should have alteast 1 and maximum responsible person to carry out. A - Accountable Person who holds ownership of the task & responsible for its success / failure. He who approves or rejects the task if completed. The final decision is with him. Max only 1 can be accountable for a task. C - Consulted It is usually SME. The SME should be consulted before taking any decision of the task, since he can provide input or opinion about the task. I - Informed The person who is informed about the progress and it is one way communication. S - Support Support team may extend help to the project team in carrying out the task by the responsible person. A - Approver A person who approves each milestone and help the project team to proceed to next milestone R - Resource Person who has expertise knowledge or domain skillset that is required In the project. M - Member Member of the project team I - Interested party People who will updated on the progress of the project along with the actions or decisions taken. RACI or ARMI Procedure – 1. Identify all the tasks involved in completion of the project 2. Identify all the roles that are required to complete the project 3. Assign the tasks to each of the roles what they are upto 4. Ensure all the task has one accountable and responsible person 5. Resolve if any role conflicts are there. 6. Share, discuss and agree on the RACI matrix with the stakeholders before starting any projects. Step Project initiation Project execution project manager Business analyst Finance It/ Software developer 1 Task 1 C R C C I 2 Task 2 A I R A C 3 Task 3 A I R A I 4 Task 4 C I R A C 5 Task 5 A A I A C Variations of RACI RASCI – with S as Support RSI – Responsible, sponsor and informed RACIO – with o being omitted / out of scope RACI – VS with VS being “Verify” and S for “signatory” Which tools I would prefer and Why? Both the tools serve the same purpose of analyzing the stakeholder’s involvement and their level of support in terms of project completion. It is only the name that is different. 1. RACI involves all the employees from all levels of the company by providing training and involving them in projects. RACI helps the proper six sigma deployment in the company. 2. The entire six sigma program is governed and resources are allocated by one central authority to sustain the improvement. 3. RACI brings out the project efficiency and instills process improvement to the company. RACI equivalent to ARMI in terms of : RACI / ARMI Description Equivalent to R - Responsible Person working on acitivty M - Member A - Accountable Person with decision authority R - Resource C - Consulted Key person to be discussed before taking any decision A - Approver I - Informed informed about the decision I - Interested party Conclusion: Both the tools are same and the name is just that different. Both helps us to understand the roles and responsibilities of each member in the company or in the project. Both avoids the role conflicts. Both helps in define phase as a stakeholder analysis to understand the level of support required in completion of the project. Thanks Kavitha
-
Q 55. How can specification limits be decided for characteristics of an innovative new product with which customer neither has an experience nor an expectation? Assume that the company creating such an innovative product does not want to expose it to the market or customers before launch. It’s a natural process to set specification limits for products on the process – the upper and lower control limits. It is sometimes designated by producer or as defined as quality or by the customer or client. It is something that is forced upon by someone and it is not a natural variation or part of the process. If it is a new product – how do we set the specification limit? 1. Defined In the market – As the same type of product is available in the market, the market analysis on those type of products through survey method or interview or the product banners would help us understand the spec limits. This would help us to set spec limits for new product. 2. Defined by the process – As per the internal process standards and policies, the spec limits would be set to sustain the reputation achieved in the market. 3. Defined by the internal management – Some times the internal management would recommend the team on specific spec limits to maintain the quality of the product to lead in the market. 4. As part of trial and error method – if the product is under innovation, then the experiment is conducted in order to achieve the quality or standards set for the process or the expectation whether achieved. Many experiments are conducted under controlled environment and the findings are recorded to create the spec limits to maintain the highest standard of quality. 5. AS part of tribal knowledge on the product usage – The innovated product is given to few users or customers to try out if the need is met, which is collected as verbatim through surveys from customers. Hence the tribal knowledge on the product usage helps in testing the spec limits. Conclusion: The specification limits are primarily for interactions with customers and management. Also, specification limits do facilitate determination of useful product disposition limits. Additionally, they can even play a role in determining required sensitivity levels in setting process control limits. Thanks Kavitha
-
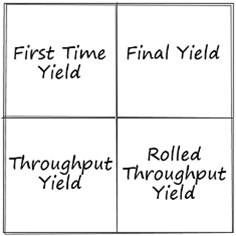
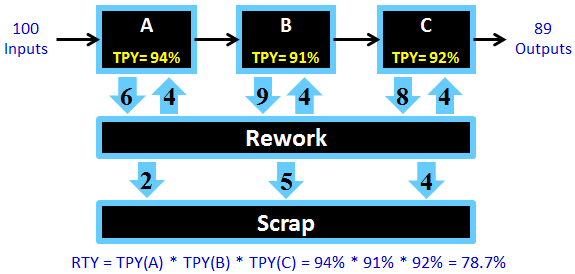
Q 54. Can a process with 100 percent Rolled Throughput Yield be considered inefficient? Answer: There are four different concepts to be understood. Yield – Amount of material processed by the sequence of operations less the scrap. But rework is included. 1. First time yield – is simply the good products including reworked products but not scrap from one of the process step. What gone in to come out of the step is first time yield. 2. Final Yield – The good products including reworked items that has passed all the sequences of the process steps is called Final Yield. 3. Throughput yield – It is a good measure of the process yield of a single sub process, which doesnot include the reworked product. It conforms the standards that are set for the product has met in terms of quality marking it as first time right without rework. 4. Rolled throughput yield – It considers the entire process flow from beginning to end, where the product gets in and out without rework. In simple words, the throughput yield of several steps are multiplied to get the RTY. An ideal process must produce without defects and reworks. An appropriate measurable metric should be identified and measured frequently to expose even a smaller inefficiencies in the process to avoid unnecessary and costly efforts that is required to correct the error. First time yield is not sensitive to product complexity. FTY and Final yield are classical approach to calculate the process yield but it will not reveal the inefficiencies. It will only consider the finished volumes. Corrective actions happens whenever ther errors are identified, and the same will not be recorded else where to show the process better than actually it is. Eg. 100 units produced In 3 steps. Only 90 charts passed including rework. The remaining 10 are considered as scrap. Hence the final Yield is 90% These two meterics does not reflect the defect rates and does n’t consider the hidden factory. But throughput yield and RTY is a very good measure which also measures the inefficiencies or defects, where it will provide a detailed insight of how process is behaving and where the error is maximum. It helps us to analyse the root cause and help fixing it. RTY allows companies to be more accurate than the final yield while assessing the performance of the process steps as quantifying the whole effects of the inefficiencies. Rolled throughput yield is substantially less than final yield, and companies that calculated their final yield at 90 percent might find that their rolled throughput yield is only 20 percent. Example 1: Low Complexity Process: Consider a process that has 3 steps performing at a 0.94, 0.91 and 0.92 respectively. Suppose that 100 units entered the process and only 89 were good units. In this case, the final yield would be 89%, and the rolled throughput yield would be: 0.94 x 0.91 x 0.92 = 78.7%. This means that even if the 3 processes are performing fairly well, one out of every 5 units will not make it through the process without being scrapped or reworked. Procedure – 1. Use process map as a guide to define the steps to calculate RTY 2. Calculate Throughput Yield for each and every step 3. Multiple the subprocess’s TPY to get the RTY. 4. If required compare the final yield with RTY to show inefficiencies to the management. Can 100% RTY process inefficient? Ø No. When the process is measured and it stands at 100%. The process runs with high end quality with no error and inefficiencies. If zero defect is possible , then the 100% RTY process is possible. Ø RTY is sentitive to the number of steps involved in production and effectiveness of the process. Ø RTY decreases as more the number of process steps occurs. That is why the team should have high throughput yield in each of the step to get higher RTY of the total process. Ø Simplification is one best idea to improve the process yield rate. Conclusion: RTY of the process is a good measure of the quality of the process. Smaller RTY reflects the room for process improvement. It is a good sign to initiate the preventive actions. Higher RTY shows that each and every process step is achieving higher TPY with zero defect or very minimal defect. It shows either the controls are stergnthened or the costly audit process is occurring. When the 100% RTY process exhibits high quality, the cost involved would also be high. Hence 100% RTY is possible when the process aims and works at zero defect or error free products at a costly audit methodology and simpler process step will yield higher RTY. Reference - https://blog.masterofproject.com/rty/ Pizza Example - https://www.leanstrategiesinternational.com/listen-to-the-gemba/rolled-throughput-yield-rty-a-pizza-story-part-deux Thanks Kavitha
-
Q. 53 – How should we neutralize the hawthorne effect while baselining the project? Answer – Baseline is an important activity in measure phase and even sometimes in define phase. It is the ability to assess the current performance to intend the improvements made. Hence baselining is important. Why baseline is important? It is important so that we can · Be able to assess the current performance · Calculate the earned value of the process · Estimate the accuracy of the improvement process. While baseline is set to compare the state of the process before and after process improvement, we have to accept the reality that not always this comparison is valid or relevant given the change the process undergoes while the improvement activities are made. Hawthorne effect – Hawthorne effect is an observed effect. When the samples are observed directly, in response to the observer’s observations, the behavior is modified. This is a reaction to the action of observation. This effect is called hawthorne effect. There are two ways of hawthorne effect 1. Due to observation, the productivity improves with no error or minimal error 2. Team takes conscious time to complete the work in order to reduce the error or decrease the productivity in order to reduce the target while in time study of the process. Case studies – Reference http://study.com/academy/lesson/the-hawthorne-effect-the-study-of-employee-productivity.html https://www.researchgate.net/profile/Ann_Glang/publication/13717365_Improvement_during_baseline_Three_case_studies_encouraging_collaborative_research_when_evaluating_caregiver_training/links/54f086680cf2b36214aa4a42/Improvement-during-baseline-Three-case-studies-encouraging-collaborative-research-when-evaluating-caregiver-training.pdf Neutralizing the effects in baselining: 1. Mobility of spillover effects on data – Conflict areas like this will have very volatile security situations. People may face very well secured during ramp up period and then fluctuate. This situation should be carefully assessed during the study in order to establish how alarming or threatful the situation is to the entire process. Mid-term analysis is always good to identify how reliable the data is to proceed further. 2. New comers in to the system / learning curve – While baselining, the new comers are also included in the study, which alters the baseline of the process. For eg. The coder who is in learning curve of 3rd week is able to produce only 5 charts with 70% accuracy and 100% audit. Whereas the tenured 8 months old coder will be able to process 500 charts with 20% random audit and >95% error free or accuracy score. While studying the process capability, the tenured coders alone will be taken into study. In other wise cases, the capability would be low while baselining, which improves naturally over the period of time once the learning curve settles down. 3. Direct observations: While the samples are observed directly in terms of cycle time study, the coders who are observed are aware that they are been noted. Hence they exhibit slowness in their speed while observations. This can be eliminated if the speed of the samples are observed frequently and through multiple modes like recordings, shadow audits, time tracker, etc, the effect can be reduced and the baseline would be reliable. Transparency and trustworthiness is gained in such scenarios through constant communication to the experimental group. 4. Statistical bias – When you implement change process during experiment, to observe the result, it can be due to change, be a false change like the hawthorne effect, or your bias meaning the observer partiality / random result. The only way to know, to arrive at a deduced conclusion is to conduct many observations in controlled environment ans with some statistical analysis to rule out the variations existing or randomness in the data and experimenter’s bias. Tools used / Approach to neutralize the effect – in summary 1. Statistical tools like MSA to reduce the measurement error and variation 2. Hypothesis testing with null proven that there is no bias in data 3. Tools like run charts, etc to detect the randomness of the process 4. Multiple observations in controlled environment 5. Multiple mode observations to avoid experimenter bias Conclusion: One should know how to apply healthy skeptism of what has been observed, observing and will be observed in order to reduce hawthorne effect, bias and stochastic observations. Hence stick to null hypothesis always until it is proven otherwise. Another important take away is it is found in operation setting where work was ongoing. They found an increase in performance caused by a benign variable while baselining, that decreased over time. Therefore, you will not observe a steady decrease back to baseline. In this type of scenario, what is likely observed is performance variability of up and down trends over a period of time that may or may not be due to anything you changed or solution implemented. You will simply need many observations over quite a period of time to rule out random effects, Hawthorne, or bias. Thanks Kavitha
-
Q52. Explain the use of Coefficient of Variation with examples. Coefficient of variation is the ratio of standard deviation to the mean. The higher the CV, the more is the spread of the data around its mean and the team or process is very unstable or ununiformed. In simple, it is % variation in mean, where SD is total variation in mean. It is a measure of relative variability. This is used to compare variations of two or more data sets. For Eg. If I have to compare results of two groups lets say Group A & Group B. Group A has CV of 25% and Group B has CV of 18%. This says that the Group A has more variability to its mean. Formula for CV = SD / mean It can be expressed as in percentage %. Hence the formula for CV can be multiplied by 100. Benefits of CV – 1. Measure of Precision – It is used to describe the level of variations existing within the population independently from the absolute values of the individual observations. If the population is same, where you have to find out the variation, then use Standard deviation. If the population is different, use this CV to estimate the spread or variability from its relative mean. Eg. If Male and female elephant group is compared, then use SD to find out the variation. If you have to compare the male elephant population with male mice population, then use CV. In simple, when the two groups differ significantly, use CV as a measure. It is to assess the precision of the measurement technique. 2. Measure of Repeatability - CV is used to measure the repeatability within the group and not the validity / reproducibility. It is used in a way to tell you the degree of association but not agreement. Measuring repeatability with out validity is a useful analysis. When assessing the measurement error, CV value depends on both the variability between sampling units and variability between repeated readings from the same user. If we have to select the variable group of sampling units, then the repeatability CV would be higher than taking up for a homogenous group. The aim is to be maximize the repeatability within the given situation. Eg. Used by Microbiologists and pharmacist to evaluate the intra assay and inter assay CV, in order to bring down the CV value to make it acceptable. 3. Consistency of data – CV is used to understand and confirm the consistency of data. Consistency means uniformity in the values of the data set. How consistent the values are from the mean of the data set is measured. As small as the CV means the data is uniform or consistent. Eg. If the temperature of an adult is to be compared to the same of a newborn, certain values are recorded In the real time for some time. Hence CV for adult is 10% and CV for newborn is of 2%. As for Newborn the CV is smaller, the variation in the data is very minimal. Means the data for Newborn is consistent than adult. 4. Indicator for Risk Assessment – It is a better indicator for all levels of risk assessment. In any type of situation, if we were to assess the risk, this would be the right tool. Eg. If Bank A gives a rate of interest at 20% and Bank B gives u at 10%, with a standard deviation of 10% and 5% respectively. Which bank is better to take a loan? As Bank B has SD of 5%, the Rate of interest is minimal for a longer run to balance his needs by the customer. Hence customer would prefer Bank B. 5. Decision making: If the team has to downsize due to high cost, the decision is to eliminate some of the team members. CV Is a useful tool where it tells us in which team ,there is more of variability, which team receives higher cost , etc to make strategic decisions. Eg. Organization has two functions – coding and billing with 40 and 65 employees in it. They earn around $450 and $350 respectively with SD as 7 and 9. Q – A) which section has a higher salary package? Which function has highest variability? Answer – a) Salary for Coding = 40 *450 = 18000 Salary for billing = 65 * 350 = 22750 So, Salary for billing is higher. CV for Coding =( 7/450) *100 = 1.6% CV for billing =( 9/350) *100 = 2.6% Billing is more of variability since it has more CV. The Zero disadvantage: CV is useful only for the calculations, when the mean of sample population is not zero. Lets assume, if the sample mean is equal to zero, then the denominator would become zero. Hence the CV gets nullified. Yes. CV is useful if all the data points or atmost of the data points share the same value as of plus or minus sign. Conclusion: CV has its own use and limitations. Hence it should used to carefully in 1. Estimating the variation 2 different populations 2. Estimating the 2 set of categories variations. 3. Risk assessment indicator 4. Decision making Thanks Kavitha
-
Q51. FMEA is one of the popular approaches used in the Six Sigma World. What are the limitations of FMEA as a method for Risk Assessment? FMEA stands for Failure Mode and effect analysis. We must have seen many products failing after its delivery to the customer. In such cases, the customer and the manufacturer sit and understand the issue what went wrong. FMEA is a methodology which allows the company or manufacturer to identify the potential failures during design phase itself and also its impact on the product been studied. This will help us in creating a actionable which can reduce such errors or failures and protect the customer. Errors or failures are very expensive. Hence all potential failures and its impact should be anticipated during the design stage itself. It is a structured step by step approach to identify the possible ways in which a product or precess fail, estimate its risk associated with the causes, prioritize the actions that has to be taken to reduce the risks identified and create a control plan. Definitions: Failure modes – Are the ways in which the product or process can fail. Effects – Are the ways that the failures modes results in errors, defects, waste or even a fatal consequences to the customer. Failure mode and effect analysis is a step by step approach to identify, prioritize and control the failures occurring. It will help you by answering these questions… how serious the failures are, how easily it is detected, how frequently it is occurring, etc. Benefits of FMEA – 1. It helps identify the how likely the process fails.. 2. It helps improve the internal and external customer satisfaction scores 3. It helps to identify the rare potential failures as well in the process and risk mitigation plan is also created against it. 4. It is a step by step approach helps to identify all the failures in the process. Why FMEA is required – 1. To satisfy the internal and external customer 2. To mitigate the risks identified. 3. Lower cost solutions to the step step problem analysis. 4. To improve the process 5. To prevent the errors before it occurs 6. To reduce possible wastes identified through potential failures. 7. As a tribal knowledge, standard work utilized When to conduct the FMEA – 1. Early in the design phase of the product or process 2. As part of the process improvement phase 3. When the process or product requires some change 4. When trying to replicate the other designs in other or new applications 5. When the customer requests for FMEA before starting out a business. 6. When the errors and risks are frequently identified Types of FMEA – 1. Process FMEA – used to analyses the manufacturing and assembly processes after they are implemented. it explores the product malfunctions, reduced product life due to failure and safety / regulatory concerns are gathered from material properties, geometry, tolerances, noises and interface troubles. 2. Design FMEA – analyses the product design before its manufacturing could happen, as part of design phase it is done early in design phase. identifies failures that impact quality, reliability and customer satisfaction. It is derived from human factors such as 5M’s – Materials, methods, machines, man power, mother nature and measurement errors. FMEA Procedure – 1. Identify the inputs through some of tools like cause and effect diagram or process map and determine in what ways the inputs can go wrong. 2. Determine the effects for every potential failures or risks (Severity) 3. Identify the potentials causes for all failure modes(Occurrence) 4. List current controls for each cause.(Detection) 5. Calculate RPN (severity * occurrence * Detection) 6. Develop actions and implement it. 7. Assign the predicted severity, occurrence and detection levels, calculate RPN and compare the RPNS before and after the process improvements. FMEA inputs & Outputs – Severity, Occurrence and detection: 1. Severity – how important it is to the customer and it is rated in 1- 10 rating scale. 1= Not severe and 10 = Very severe 2. Occurrence – how frequent the failures occurs with given cause as it is collected from past history. And ratings are given accordingly in 1-10 rating scale 1= Not likely and 10 = Most likely 3. Detection – ability of detecting the errors in the given controls and then to prevent the error. It is also rated in 1-10 rating scale. 1= Easy to detect and 10 = most difficult to detect RPN Calculation: It is a product of the above mentioned attributes. RPN Action Priority When risk is determined to be unacceptable, it is recommended to prioritize the actions. 1. Error Proofing (Eliminate Failure Mode or Address Cause) ü Failure Mode (Only Severity of 9 or 10) ü Causes with High Occurrence 2. Improve Potential Process Capability ü Increase Tolerance (Tolerance Design) ü Reduce Variation of the Process (Statistical Process Control and Process Capability) 3. Improve Controls ü Mistake-proofing of the tooling or process ü Improve the inspection / evaluation techniques FMEA linkage to Problem solving technique: DMAIC Phases Linking FMEA to Define Problem statements in the charter and FMEA are linked. Problem areas are easily identified through prebrainstormed areas. It would be easy to locate, where the error is happening from an FMEA Measure Cause and effect diagram is linked to FMEA, where the possible causes are priortized using FMEA and then the respective data is collected. Analyse Each failures are listed and anlaysed part by part for its occureneces and controls available to strenghthened the process. Improve When the new product is on the way or the existing requires a change, the design phase involves the risk assessment and risk mitigation plan using FMEA Control Current controls are validated and new controls as pe rhte change process, it is recommended. Limitations for FMEA as risk assessment tool: 1. Resource limitation: When the risk is assessed and identified that the RPN is high, but has limited resources in terms of knowledge/ manpower / controls, theis has to be given highest priority. Since, this might go out of company and dissatisfy the customer. 2. No definitive RPN thereshold : there is no definite RPN threshold to decide the areas which has to looked into. Now it depends on the factors like quality, safety regulations, etc. However the pareto is used to prioritize the critical risks. Hence 20% of the risks are given high priority basis RPN scores to improve the process. 3. Regrouping of the team for reassessment of process RPN: Most of the organizations implement the actionable as part of pre FMEA analysis and the process is also improved. But they fail to regroup as a team and reassess the Process using FMEA to calculate the RPN scores. So that we can compare the RPN scores before and after process improvement calculated for project efficiency. This regrouping may not happen due to limited resources, multiple projects, lack of time, etc. 4. Knowledge on the process – If the team behind does not know what to list as failure or how to detect, the failures would be unknown to the FMEA team. In some other cases, if they forget to list one failure mode also, it is said that failure is waiting to happen. 5. Considering FMEA as solution tool – FMEA only provides us where the problem is how serious it is. It will not provide us solutions to reduce the risk. It is the team that they have to develop actions for the highest RPN’s failure modes. 6. Problem Scope – When we try to reveal the entire process in one FMEA, many failure modes would go unnoticed. The solution is break down the process into multiple segments and then perform FMEA for each of the segements 7. FMEA – static model – FMEA is not a static model. This has to be updated frequently whenever the changes are happening to the process, all the failure modes to be listed, calculate RPN and provide some corrective actions. 8. Bias towards RPN ratings – When the ratings are given on a subjective basis, there can be biased in rating. For eg. The severity of smoke while smoking is rated as 10 for a non smoker and 3 for a smoker. This tweeks the RPN score as well. Hence it is important to work out as a team on the ratings. 9. Experienced operators – If the experienced operators of the process are not part of the FMEA team , the FMEA conducted may not be effective. Only they can provide a valuable insight to the process errors. 10. If detection controls are not tested adequately – If the detections are not tested and given ratings, then the FMEA may not be effective to create a corrective or preventive actions. Conclusion: The important point to remember while doing FMEA is to always update the FMEA regualarly and create related control plans. In order to reduce the risks frequently. Failure to do so can have serious consequences, when a severe problem is not documented or ends up causing harm to a customer. FMEA is an important part of any production process, but needs to be supplemented with other project methodologies to be completely effective. It is only a assessment tool, where it will not reduce or eliminate the potential failures. Hence it should be clubbed with other error proof tools like 5s, Poka yoke, Visuals, etc to make it effective. Reference - https://quality-one.com/fmea/ thanks Kavitha


-
Q 49. What is the differences between Lead Time and CycleTime? What is the reason for confusion in the two definitions? Cycle time, lead-time are the most generic terms, which always get confused in terms of usage and representation of the work. Some people may call the avg time taken to complete a chart – as production lead-time not cycle time. Some call it as cycle time. Hence understanding the term what it stands for is very important to avoid such confusions. These confusions will lead in wrong data collection, poor / worse decision making. Definitions: 1. Cycle time – it is the time taken to complete one unit’s production from start and finish. It is based on work process based. CT = Net production / no. of units produced 2. Takt time – It is the rate at which you have to complete the production in order to meet the customer requirements. It is based on customer demand. TT = Net production / customer demand 3. Lead time – It is the time taken for production of one unit through its multiple processes of operations from frond to end. i.e from the order received to payment received. LT = T from order to dispatch. Difference between Cycle time and Lead time: Aspects Cycle time Lead time Definition "Cycle time" is the time it takes to complete the production of one unit from start to finish. "Lead time" is the time it takes for one unit to make its way through your operation from taking the order to receiving payment. Meaning CT starts when the actual work of production is started in the unit and ends when it is ready for delivery. It measures the time elapsed between order and till delivery to he customer Perspective / View this is done in terms of organization's perspective this is done in the customer's perspective. Rate of Measures Measures the work completion rate. More of a mechanical process capability. Measures the arrival rate Aims to measure cycle time in terms of demand Customer waiting time. It is measured in Amount of time / unit( minutes / customer , Parts / hr) minutes / hours etc Relationship related by Work in progress but within the unit Related by work in progress, but there is no unit. VA / NVA It segregates the Value add activity time from NVA. It includes both VA & NVA Cases if one time is higher, If CT is higher than Lead time, demand of the customer is not met. If lead time is higher than CT, inventory is more. Example A train manufacturer offers custom manufactured replacement parts to customers. When an order is placed it is goes through several internal business processes each with its own cycle time including order processing, manufacturing and delivery. The lead time is the sum of these cycle times plus a delay of two days due to a manufacturing backlog. Conclusion: Cycle time and lead time are two different entities from the different stakeholders perspective. Both are related by common term of net production, work in progress, etc. But the difference is lead time is measured from customer’s point and cycle time is done in internal process point of views. Both are to be well understood with its own limitations in terms of usage. To me, the word production gets into confusion mode to many. Another example, in a coding company, client provides a batch today at 8 am to the company to code and give. If the company delivers the completed batch at 8 pm, the lead time for this process is 12 hours. But when the batch start time and end time is noted, the cycle time taken to complete the batch is only 2 hours. It shows that the inventory is more. Here the company would have involved in other client works. Hence, understanding the concept is very important to define the data collection process and in valid decision makings. Thanks Kavitha

-
Zero defects: A term coined by Philip Crosby. It is a management tool which aims at reducing the number of errors in the production system through mistake proofing. In such case, we have also to reiterate the importance of first time right. Yes. It refers to a domain beyond 3.4 sigma with 1.5 sigma shift. However the zero defect theoretically is manufacturing a defect freee product. A. If it is desirable to set an objective of Zero Defect Quality, we should set the goal, but this should primarily be a top-down system driven initiative and not a bottom-up approach. Zero defect is possible in terms of healthcare, aviation industry, pharmacy, etc only if the mistake proofing technique is applied to arrest the error before it reaches out to customer. The process requires automotive prevention and detection mistake proofing techniques. Zero defect is not possible if there is frequent shift occurs or if the production rate is very high or even if the manual checks are more used. Zero defect Entitles the concept called “ all the defects are same , since all defects are bad.” So, the defect which is a nonconformance of the product should be identified and classified as “ worst / bad/ Neutral” Having identified, the defects are systematically studied for its impact on the quality and productivity and slowly eliminate the bad to benign errors. If the defect solving matrix is not prioritized, the growth would be standstill. Example: Hence supplier and customer will get benefited if the maximum possible quality is met and the product is delivered with possible quality. Having a concept of zero defect may not add value to the customer. If we aim at zero defect the top management has to dictate the bottoms at the top down approach. If the entire supply chain is covered with tight checks with goal of zero defects, the production rate should be lower and cost should be increased to strengthen the gateway of checks using technology. Increased costs are due to technology-improved process, increased checks and controls and improved cycle time. The lower yields is resulted from a higher rate of “false fails” (type 1 errors) as the suppliers apply increasingly stringent criteria in an attempt to possible error reduction. In other words, in an effort to eliminate even the smallest possibility of customer incoming test failures, good product may be scrapped to overly stringent criteria. Conclusion: If the top management aims at increasing the cost and having the productivity at the acheiveable target level without having the productivity increased, maximum quality is possible and sometimes it may be zero defect also. Something is better than nothing. A logical strategy is to deploy continuous improvement methodologies in all the business processes to improve quality and yield, and reduce cycle time and costs. Then, at the point of shipping the final product to the final customer, employ a zero escapes methodology to help ensure that a randomly defective unit does not reach its final application. The concept of zero defect along with continuous improvement is intuitive. It makes sense to always strive for a better process or product, to reduce costs, satisfy customers and gain market share. Absolute perfection can never be achieved, but an organization can move closer and closer with good statistical and engineering practices.Can achieve the better maximum possible quality with continuous improvement projects. Reference: https://www.isixsigma.com/new-to-six-sigma/sigma-level/zero-defects-what-does-it-achieve-what-does-it-mean/ Thanks Kavitha

-
Q48. What are some of the common ways by which Fishbone Diagram is misused? Fishbone diagram is also called as ishikawa diagram or Cause & Effect diagram. It is a visual tool used to segment the possible causes that is impacting the final product or service. It is helpful for identifying the root cause that is creating the problem. Brainstormed ideas are collected and structured in the way using fishbone diagram. This helps categorizing the ideas gathered immediately into fishbone to identify the root cause. Types of Fishbone – Ø Process fishbone Ø Time –delay fishbone Ø Cause & Effect diagram with additional cards Ø Desired result fishbone Ø Reverse fishbone diagram History Professor Ishikawa created this cause and effect diagram in 1960’s.. This diagram based approach is used to think through all the possible causes that is creating the problem. This helps to carry a thorough detailed analysis of the problem. Steps to be followed: There are four ways how you have to use this diagram. They are as follows. 1. Identify the problem 2. Brainstorm the factors or all X’s involved. 3. Categorize and identify possible causes 4. Analyze the diagram Step Description Tools used Identify the problem identify the problem and write it at the head. Also gather data relating to who has done it, why it is done, where it is happening, what is the impact, what process is involved 3W1H technique is used to narrate the problem statement effectively. Work out factors involved Brainstorm and list all the factors or X's involved, irrespective of its criticality. If required, mark all these in white board for all members understanding and coordination. Brainstorming is used to list the factors Identify the possible causes Brainstorm each of the factors listed above separately and draw as each of the bones of the fish. If required, the causes can be broken further into sub causes. Brainstorming is used to list the possible causes Analyze the diagram After completing the entire diagram, depending on the criticality and complexity of the cause and problem, investigate further using why why analysis and so on. 5Why analysis, Prioritization matrix, Multivoting technique to priotize the possible causes. Fishbone framework: 1. 5M – Methods, Materials, Manpower, Measurement, Machines and environment 2. 5P – policies, procedures, people and plant, and place. (By service industry) 3. 7S – Strategy, Structure, systems, shared values, Skills, Style, Staff (used by McKinsey) 4. 4P – Product, place, price, promotion (used by Marketing) Example – A person having frequent sore throat think through and list all the possible causes in the fishbone diagram. Here it looks like. The possible cause of this issue is lifestyle. There can be many root causes to it. Modifying the lifestyle will help improve the condition of the person. Hence this is how it should have been done. Possible ways of Misusing the fish bone: 1. Limited thinking will not solve the purpose of using fishbone. Eg. If there is a time constraint during brainstorming session, the more information will not be collected due to other work related pressures. 2. Limited resources: If the person gathering is freeze with only 6 or 7 categories, then he may be in a position to categorize all the factors into these factors listed only. Resource can be in the form like paper and pen, time, whiteboard, employees involved in the process. Verbally conducted RCA session using fishbone will result in listing relevant and irrelevant possible causes into the diagram. 3. Inefficient people: If the fishbone is done using inefficient people, then there exists a failure. Fresher may not know the end to end process. In such case, if the fishbone is done using these fresher’s, the possible causes may not be a true event. It is vice versa. Hence a mix of tenurity should be involved in brainstorming and fishbone diagram. 4. Biased in collection of information: During brainstorming, all the team members should be involved and all the ideas should be noted down. If there is any subjective bias in noting down the points or self-judging the causes will not lead into an effective RCA using fishbone diagram. 5. Biasness in effective decision making: when the possible cause is irrespective of its relationship to the problem, the decision making becomes a waste. It may not yield you a best result. Inappropriate categorization of possible factors, and having the same point under multiple categorizes might lead into wrong decision making on the possible causes that affects the problem. Thanks Kavitha


-
Q46. Segmenting large sets of data into smaller segments is a common practice when analysis is done on data sets. In what different ways does segmentation relate to Root Cause Analysis? Segmentation is a useful technique used to understand the customer’s similarities and differences in the market. It will help you to understand the current and future prospects of the products and the customer’s requirements in the market, which will in turn make the organization to introduce new products or modify the existing ones and better communication to the customer who is interested to buy the product. It was traditionally used by the marketers in the market to get the close view of it. It is based on the principle of identifying the variables that can predict the customer’s behavior and the characteristics, using a mix of quantitative and qualitative approaches. Why segmentation is useful? 1. Segmentation provides us the deeper insight of the problems and help us identify the relevant possible solutions. 2. It helps us to understand the customer requirements in the market, so that the company can introduce new product or modify the existing one to meet the needs of the customer. 3. It will help you identify the real root cause by diving the entire fragment of business into categories defined. 4. Helps in decision making, once the real root cause is identified. When it is recommended? Segmentation is recommended to focus Customer Research on the most important customers: • Segmentation divides customers into groups with similar needs that value the same outcomes and look for the same solutions • Segmentation should be natural (the way the customers actually behave) and stable over time • Avoid artificial segmentations such as geographic location, price point, size, vertical industry or standard industrial code that mix customers with significantly different needs • Write a definition of each customer segment and representative customers in the segment and review them with the sponsoring business team Segmentation: There are basic 9 segmentations which can be clubbed into 3 categories and are as follows. 1. Industry 2. Company 3. Individual 1. Industry: It is grouping of similar businesses like healthcare, BPO, etc. the attributes identified and studied in this segment are type of business, growth & revenue, geographic and demographic locations of the company, etc along with deep dive into other important attributes like size, substitutes and sales cycle Subcategories Description Example Size Understanding the size of the spending budge twill provide inputs to the pricing model. It will also help in understanding the challenges and overcoming it. Some industries would be early technology adopters. In such case, the spending budgets by various industries like security software, application software, business software and internet software to be colleted and listed for pricing model. Substitutes Product manager should frequently communicate to the customer in terms of problem solving. If the product delivered does not meet the needs of him, then what is it he is expecting more and what alternative he is using. Such questions asked to upgrade the product or modify it within hte policy regulatory norms. Change is important but cost effective. If the new dress is torn which is bought from the retailer A, the product can be bought from the retailer B by the customer if he is satisfied with A vendor and if he doesn't try to improve / solve the issue. Sales Cycle once the product lifecycle is completed, then the product sales cycle starts. It is very important that the trends to be identified basis historical data and create patterns in sales considering future deals. If Company A sells 200 products last year, then they can study the market for product innovation and increase the sales if required. Relating Industry segments to RCA: Yes. It is related. By studying the segment of industry in terms of size, geographic location etc should really contribute to the root causes. Eg. If a company works in metropolitan city (lets say Chennai) the traffic is huge and the IT park is as well crowded. It the person is said to come at 9 am in the morning for completing the backlog of that day’s target(200), the person is held up in traffic. When the same company also works of moderately populated a semi urban area, the person would be able to reach office on time to complete the backlog. As earlier said, the root cause for not completing the backlog is coming to office late in metropolitan city. Tools used: - Pareto analysis - Win loss analysis 2. Company: Where in industry we would have looked in quantitative attributes and here we might look into qualitative attributes like how the company can create value proposition to the customer in terms of products or services given. Subcategories Description Example Purchasing Companies adopt different marketing strategies like cost optimization and innovation optimization. Understanding the company's strategy will help focus on the problem areas easily and understanding the company's business goals are also equally important A company focused on cost optimization will start focusing on the selling the products with different marketing messages which talks about the product's innovations and its effective usage. Process In most of the companies, the communication is top down and some has bottom ups. It talks about how effectively the business processes work and interlinked. How effective the management can solve the problems and make decisions. if the company adopts lean and agile, this means they need change. So the product also should facilitate the change and embrace it for 100% quality. People People in the company are directly involved in product life cycle and till it gets delivered to the customer. Hence it is important to understand their mindset since they are the ones involved in producing good quality products. When we sell medicines to the customer, it is also important that we need to tell them the risks involved in taking up the medicines. Hence it should be taken only under guidance. Relating company segments to RCA: It is obvious that the company segmentation is related to root cause anlaysis. The businsess processes involved in the company are studied using process maps and waste is identified. And process maps are used to convert it into value streams and root cause is as well identified. Eg. Step 1 Step 2 Step 3 Step 4 Step 5 10 minutes 20 minutes 15 minutes 10 minutes 10 minutes Value Waste - can be reduced to 5 minutes using SCAR (Simplify, Combine, Automate or Remove) technique Value Value Value Tools used: - Pareto - Process map - VSM 3. Individual: Individual is nothing but your customer who purchases the product or the receiver of the service provided. Quantitative factors like demographic information can provide insight into product adoption and qualitative attributes like demeanor and disposition can provide insight into the personal motivation for product selection. Subcategories Description Example Disposition It is important how the product add values to the customer and simplifies day's living. It is important the customer should be satisfied with their needs met by the organization when aligned with their organization’s goals, will definitely go a long way even if there are few short comings. if the mobile is used to make calls, the camera is an additional feature. Given with it, a clarity with high pixels will delight the customer at the same price. Demeanor understanding this focuses on the learning process of general guidelines and the principles followed. Some may value the change and some may not. It is as important the value should be imposed in all minds through multiple learning sessions. If the company adopts the Operational excellence, then person then strive for excellency in the products sold to the customer. It should be defect free and match the customer's needs as they fit in the organization's goals. Demographics Demographics like age, sex, education etc plays a major role in segmentation. Because, the roles performed In the organization also depends on the age of the generations. A mobile with additional feature like camera clarity, unbreakable feature, voice recognitions will delight the youngsters whereas the old people will only use the phone for calling others. Relations of individual with RCA: In a medical coding company, a person with BCA computers are hired and given some charts to code. After coding is completed, another BCA guy as auditor audits and finds no error and sends it to client. At the customer end, randomly they check 10 reports out of 100 reports submitted. They find all 10 reports to be erroneous and not acceptable. The prime root cause is education. This is understood if the proper segmentation is done. Tools used: - Customer feedbacks - Customer surveys / discussions Conclusion: This finite set of workable information provides a good insight of any problems arised. The short term goals are fixed to rectify the issues quicker. This 9 segments broadly explained will throw insights on the root causes and helps the management in decision making. When the product is not meeting the customer’s needs, then start looking into the segmentation to find the real root cause. Understanding the key is the only best way to hone the problem. But should we have to wait for the process to fail? No. Even if the company wants to innovate the segmentation is the best tool to identify which area to be innovated. Reference: https://measuringu.com/better-segmentation/ thanks Kavitha
-
-
Q 45. Considering the four quality costs viz, Prevention costs, Appraisal Costs, Internal Failure Costs, and External Failure Costs, one would imagine incurring some prevention + appraisal costs so as to save on others. Is there a need to strike an equilibrium between these costs? What would be your approach to reach the best scenario? What should be considered as the best scenario? Companies should the product quality at a very high level to meet the customer’s requirements at the desired quality at an optimal cost. There are some terms which we should before understanding which cost is better. Quality is defined as composition of characteristics that can express the ability of good product or service which can meet the customer’s requirement. Quality of design refers to how closely the requirements are met to match the needs of the customer. Conformance quality refers to performance of the product or service that can meet the customer requirements. Quality cost is said to be the cost that is involved in creation, evaluation for confirmation of quality and failure cost. It is of 4 types Prevention cost, appraisal cost, internal failure cost and external failure cost. Prevention cost: It is the cost associated with the infrastructure of the quality control system. It ir designed in such a way to prevent the cost of poor quality. Preventive costs are measured in the following ways. 1. Quality planning cost: It involves the process of planning the quality system details like procedures and instructions to meet the customer requirements. It involves the planning for instructions for operations, consistent production, test, inspection and quality control. 2. Cost of customer research and market analysis: To determine the customer’s requirements, the market research is to be conducted to gather the information about the product / service. gather the specifications for the product / service to be delivered to meet the exact specifications set by the client. When the needs are met by the product delivered, the it is of desired quality for the product to satisfy the customer. 3. Cost of developing the design for products: before any bulk production, if there is any new requirement change happens, sample products / sample trials to be done to prevent the huge waste / loss. Hence sample products aims at preventing the production with poor quality. 4. Purchasing cost: companies has to evaluate the market for raw materials to be purchased. Without compromising quality, the raw material for the end product to be cost effective. For which, the companies should evaluate the suppliers and their costs. 5. Cost of quality training and personal development: to avoid failures, company must continuously engage the employees in training for quality maintenance and product development. 6. Cost of system development and management: creating a quality control systems and methodologies for conformance of quality to meet the customer requirements. Measurement cost to appraise the quality: Measurement costs are associated with activities that are involved in inspection and testing for conformance of quality to meet the customer requirements. Measurement cost are in the following ways. 1. Cost of inspecting and testing the raw materials: if the raw material is of bad quality, the entire product will fail which lands up in internal and external failure cost. Eg, Travel to vendor’s place is also a cost involved in evaluation of raw materials. 2. Cost of lab – acceptance test: If the raw materials has to be tested for its quality or its characteristics under certain experimental models, lab testing is required, which incurs cost to the company to conform the raw material purchased is of good quality. 3. Inspection cost – It is the cost involved for cost of time or person’s wages who confirms the quality of the product while testing and inspecting. 4. Testing cost – cost associated with technical evaluation of the product /service. 5. Cost of setup for test and inspection: Setting up the lab / equipment’s involves cost to run the test and inspection for quality conformance. 6. Other costs – Electricity, fuel cost, etc as well included. Cost of internal failure: Cost associated of the products / services that has failed internally during the inspection process before it reaches out to the customer. Internal failure costs are as follows.. 1. Cost of Rework – When the defect is identified, a corrective action is taken place, which requires a rework. Eg. Extra labour, time, material and other extra resources to complete the rework and meet the standards set by the client. 2. Material procurement cost – cost when the product is rejected or complaints raised by the customer to evaluate and rework. 3. Cost of engineering – the production process is entirely studied for process improvements, if any internal repeated failures occurs. This involves experts cost for the process reengineering studies. 4. Cost of wasted time – Extra time spent by the employees in reworking the product involves cost to the company. External failure cost: Cost associated with products /services that has been delivered to the customer and identified by the customer, which results in dissatisfaction. External failure cost are as follows.. 1. Warranty complaints cost – cost of complaint includes activities alike investigate the complaint, repair and if not repairable, replace. If the product is under warranty service, the cost is a kind of rework and we might end up in losing the client due to dissatisfaction. 2. Product liability cost – cost incurred due to liability judgements due to the product quality failures. 3. Product recall – When the product is recalled from the market, the cost incurred in selling the product, for rework etc will be wasted and it will be a huge loss to the company. 4. Lost sales and reputation – if the product does not meet the customer requirements, then the bad reputation would spread as viral by the customers in the market. The market lead would not be possible. Accounting of quality cost: Informations or reports should be generated frequently on the quality costs and circulated to make the managers aware of the quality costs occurring in the company to help them make decisions. Measurement, analysis and reporting of quality system helps them understand how closely the quality system works to prevent failure costs and meet the customer requirements. It would also help them to make future estimates. Total Quality control – Managers can compare different quality cost segments and determine its relationship. For eg. If the manager decides the preventive cost are intensified, then more failures are reduced. Hence it helps the managers as measurement of quality tool to draw useful conclusions. They aim to shift the failure cost into preventive cost so that the robust technology help in reducing he failure cost and manual appraisal cost. This program is called quality cost improvement program. Analysis of Quality cost – By analyzing the quality cost, the managers would be able to draw some useful information to make conclusions or decisions. Hence the analysis is important using some of the tools like ratio analysis, trend analysis, pare to analysis and cause effect diagrams. Conclusion on the approach – Cost of doing job, conducting quality programs and achiving goals to meet the customer requirements and satisfy the customer for longer effect of business in the market. Cost of quality is an important quality tool. If the company wants to meet the desired quality of the customer, then the organization should work with high quality attributes. If they cannot meet the customer needs, the failure cost and rework cost would be higher. If the company wants to reduce the cost of poor quality from 40% to 15% , then effective quality improvement programs to be initiated and reported frequently to the managers to substantially reduce the failure cost and increase profits. Any good organizations approach on the quality cost would be achieving high quality with robust preventive technology aspects of quality and appraisal cost even secondary to reduce the internal and external failure cost. Ay organization to lead the market and win the customer, the failure costs should be at very minimum rate with high quality product. Hence these quality costs can never be in a equilibrium. My rating for Quality cost is as follows. 1. Prevention cost should be higher 2. Appraisal cost takes up the 2nd place. 3. Internal failure cost can be at a very minimal % of <1% 4. External failure cost is very bad cost to organsation, hence one should avoid it. More examples of quality costs Examples of prevention cost System development Quality engineering Quality training Quality circles Statistical process control Supervision of prevention Quality improvement projects Technical support to suppliers Quality data gathering, analysis and reporting Audit of the quality system Examples of appraisal cost Test and inspection of incoming materials Final product testing and inspection Supplies used in testing and inspection Supervision of testing and inspecting activities Depreciation of test equipment Maintenance of test equipment Plant utilities in inspection area Field testing and appraisal at customer site Examples of internal failure cost Net cost of scrap Net cost of spoilage Rework labor and overhead Reinspection of reworked products Disposal of defective products Down time caused by quality problems Analysis of the cause of defects in the production Retesting of reworked products Re-entering data because of keying Debugging software errors Examples of external failure cost Cost of field servicing and handling complaints Warranty repairs and replacement costs Liability arising from defective products Lost sales arising from a reputation of poor quality Returns and allowances arising from quality problems Product recalls Repairs and replacements beyond the warranty period Refernce -http://asq.org/learn-about-quality/cost-of-quality/overview/overview.html thanks Kavitha
-
Q 44. Can Type 1 Error of one situation be considered as Type 2 Error in a different situation? In other words, can Null Hypothesis statement for one situation be the same as Alternative hypothesis for another situation? Null Hypothesis: It is commonly denoted as Hsub0. This is typically a standard observation made by the researcher to say that there is no interaction between these variables. It is called null hypothesis. Alternate Hypothesis: It is denoted as Hsub1. Opposite of null hypothesis is alternative hypothesis, also called as researcher hypothesis, which is their prediction and measured for existence of relationship between these variables. Significance: Statistical tests are done to determine the relationship is significant. It also means that the difference in the results are not by random chance. Type 1 & Type II errors: No hypothesis is 100% certain for decision making. Because it is based on the probability value, there is chance of making a wrong decision as well. There are two types of errors possible in hypothesis. Type I and type II errors. Type I errors are when the null hypothesis is true and you reject the null. This is denoted by level of significance. Type II errors are when the null hypothesis is false and you fail to reject the null and accept alternative. This is denoted by Power test. Truth about the population Decision based on sample H0 is true H0 is false Fail to reject H0 Correct Decision (probability = 1 - α) Type II Error - fail to reject H0 when it is false (probability = β) Reject H0 Type I Error - rejecting H0 when it is true (probability = α) Correct Decision (probability = 1 - β) Negations: There are certain negations before making any hypothetical statements. Null hypothesis: “x is equal to y.” Alternative hypothesis “x is not equal to y.” Null hypothesis: “x is at least y.” Alternative hypothesis “x is less than y.” Null hypothesis: “x is at most y.” Alternative hypothesis “x is greater than y.” Example of Null and alternative hypothesis with 2 types of errors. · Null hypothesis (H0): μ1= μ2 The two medications are equally effective. · Alternative hypothesis (H1): μ1≠ μ2 The two medications are not equally effective. In the above example, the errors would be defined as Type I error – if the physician rejects the null hypothesis and concludes that the 2 medications are different when actually it is not. Type II error – If the physician fails to reject the null and concludes that the 2 medications are same when actually it is not same. Type II error is sometimes serious or life threatening. Having considered the consequences of the risk or seriousness of commiting one type of error, the decision is taken accordingly. Refernce: http://support.minitab.com/en-us/minitab-express/1/help-and-how-to/basic-statistics/inference/supporting-topics/basics/type-i-and-type-ii-error/ Another Example Null hypothesis - Earth is not at the center of universe. Alternative hypothesis - The Earth IS at the center of the Universe. In such statements, instead of proving one of the favorable conditions only, you have to first disprove that the theory of rejecting the null is equally important to accept the alternate. It is to just prove that the study or experiment conducted is flawless. If you only prove the alternate to be effective and not proving null to be rejected would set a system failure. Type I Error : In this example, the astronaut concludes by watching the sky over nights and conclude that the all other planets revolve around the earth. Hence the earth is at the centre of universe. So, alternate is proven. And the null is rejected. Type II Error – Here the astronaut concludes that the planet is not revolving around the earth. In fact the earth is revolving aroudnd the planets. Hence the earth is not at the center, because it keeps moving. Here he fails to reject the null and accept it, when actually it is not. Conclusion: So, to conclude the hypothesis statements depends on the situations we study and it is equally important to disprove the one with accepting the other hypothesis. Typically the null hypothesis says that there is nothing new happened either before and after or after the solution implemented. The difference is equal to 0. Generally, the people’s claims are always true until proven otherwise. If we have to prove, show evidences to reject the null hypothesis. To conclude the 2nd part, a null hypothesis can never be a alternate hypothesis in any type of situations, since the null hypothesis is generally a work done to nullify the statements or claims by people. Whereas the alternative hypothesis is a opposite nature of null hypothesis. It is not a equalized statements. It can be greater or lesser of the effect studied. Thanks Kavitha
-
Q 43. While DMAIC is a more popular approach as compared to 8D Problem Solving, would you prefer to use 8D over DMAIC in some situations? Why/ Why not? In 1987, Henry ford used this approach called 8D, which is about 8 disciplines followed process and product improvements. He also believed strongly that this 8D approach is very useful to solve ‘n’ number of problems in industries especially like automotive. This approach was originated from TOPS program in Ford company. TOPS stands for “Team Oriented Problem Solving” program. It is a systematic / structured / scientific way of approach in problem solving by identifying the root causes, developing some clear cut solutions for root causes identified and the implementation of the corrective actions identified. 8D is used when the problem is recurring, major or critical & Chronic. It depends on the complexity of the problem. It is also used in companies’ basis the customer’s requirements. 8D is not effective if the root causes are known, solution is known, when the problem is not recurring, when the problem solving requires only one person’s effort, when the process has to select the best solution from the list of solutions or alternatives. When to use 8D ? This approach is typically required when 1. When the safety / regulatory issues occurred 2. Warranty / guarantee rejections 3. Customer complaints 4. Internal rejects / errors, wastes at unacceptable limits. 8D Preparatory phase / Pre 8 D: As part of preparatory phase, it is important for one to understand what the problem is. Should have a deeper insight before proceeding any type of approach to solve the issue. The following should be gathered. What type of problem whether chronic / Recurring / critical? What is the impact? If recurring, what the problem last time? And what was implemented as solution? Was the action taken permanent? Does the problem require a team work with DMAIC ./ 8D approach? Etc. 8D Approach: 8D Activity Description Tools used 1st D Team Formation It gathers a team members from various departments related to process, product, quality and data. There are few important teams like core team who works with data analyses etc, SME team who are subject matter experts on the product, a leader who knows the 8D process and Sponsor, who can bring in the change 3W1H to gather problem 2nd D Problem definitin Describes the problem using the known data available Uses inductive tools like 5Why's, Is / is not tools and deductive tools like Affinity diagram/ Fishbone and pareto 3rd D Interim containement Defects were identified and rectified before it goes out of industry or before it reaches the customer. A kind of customer protection. Internal quality checks/ audits. 4th D Failure Mode RCA & Escape RCA Review the information gathered to find the real root cause. Reviewing the is/isnot and fishbones. If required, review & change the process flow 5th D PCA - Permanent Corrective Action PCA is identified to arrest the defect and if changes required, it would be done. The solution should be pratical, feasible, robust and cost effective. 6P are mapped under fishbone and anlaysed. FMEA, Pugh matrix 6th D Implemenation of PCA Once the solution is approved, the action plan with RACI matrix is created. Pert chart / Gnatt chart is used for effective implementation of the action items. 7th D Prevent recurrence once the solution is implemented, the problem should not recur. To prevent recurrence, the team should validated the action plan and its outcome using Reliability verfication test. Control charts, capability test, FMEA or even a simple histogram 8th D Recognition Once the solution is established and the recurrence is well controlled with repreated tracking mechanism, the team is to be appreciated with rewards and recognitions. "Hall of Fame"(Not a tool, but suggestionfor motivation) \ 8D Approach Vs. DMAIC Approach: 8D Approach DMAIC approach It is a short term approach with corrective actions. This is most towards the reactive mode of he customer complaints. It is a variation reduction tool. It is towards the preventive and corrective approach. It might take several months to complete. Within first 3 days the customer should be noticed about the first 3 step’s outcome. It depends on the type of project we select. (Usually a GB / BB takes upto 6 months). More than 50% of the time is spent in plan phase / define phase. 8 steps are involved in arresting the problem. It is a 8step PDCA cycle used for process and product improvements and to identify & eliminate the recurring problems. Basically a 5step PDCA cycle for improving, optimizing and stabilizing the business processes and designs. Tools like FMEA, Fish bone, 5 why, Control charts, Gage R&R, etc are used. More of statistical tools like regression, DOE, etc along with other tools combination it works. Symptom is addressed as a temporary solution. Root cause is identified and solved. Data driven scientific ways of approach and developed by lots of Quality Gurus. This was developed and used by Ford in ford company by engineers and other members. Conclusion: There are no major differences exists in reality. Only difference as per the steps are step 3 of the 8D approach “ Interim containment action”. No comparative exists in DMAIC step as well allow the escape errors to reach the customer till we find the root cause and fix it in DMAIC. Interim containment is a typical band aid approach / solution for the bleeding problem to calm the customer. This addresses the symptoms for time being and not the root cause. But still it is worth doing if the problem is bigger enough. Example: A vendor gets 100 complaints of AC / day. For a customer who has bought a Air conditioner, should be satisfied with the cooling temperature of the room. If this is not done, immediately the vendor is called for and the checks been done to improve the cooling effect at the customer’s place. Then the vendor goes into the root cause identification and solution identification approaches. Hence the quick band aid approach is better than doing nothing. Again it depends on the project team or company to select the approach which has to used in problem solving. Thanks Kavitha

-
Q. 41 Sigma Level is sometimes used as a method of assessing the performance of a process. The reporting of Sigma Levels as Long Term (Overall) and Short Term (Within) has continued for a long time. If both of these can be computed independently, why do we sometimes need to derive one type of sigma level from the another by using 1.5 sigma shift? Process sigma is also referred as sigma level. It provides you the high level baseline to understand whether the process is capable of delivering the product or not in order to satisfy the customer. When the sigma level is high, the process is then more capable of producing goods and services. If the process sigma level is low, then the process is incapable of producing such products and services. There are two levels of sigma, which are short term process level of 6 and long term process level of 4.5 Before understanding clearly the 1.5 shift, it is mandate that we need to know the standard deviations, mean, short term an long term variations. The process sigma clearly states the gap between the average and the nearest specification limit set by the customer. Statistically, to say, how many standard deviations or sigma levels fit inside the gap between the process mean and the nearest specification limit. Definitions DPMO is defects per million opportunities. It the average number of error rate or defect rate with the opportunities defined. This will let us reduce the process variations on a long term basis to satisfy the customer. DPMO = Defects * 1000000 / (( # of defect opportunities / unit ) * number of units) Mean ( μ) = x1 + x2 + x3 + … + xn) / n Where X1, X2 are data values and n is the number of data points. Standard deviations = Standard deviations are denoted by Sigma(σ) . Standard deviation tells us the spread of the data. If larger the standard deviation, the more is the spread and vice versa. It the data point is far away from the process mean, this is denoted by the sigma level or Z score. It is calculated using the below formula. Z = (x – μ) / σ Example: A chart is being audited with 52 opportunities like ICDs, CPT, Physician names , etc. 1000 charts are randomly audited for quality checks, with what 975 defects were identified. DPMO = (975 / (52*1000) ) * 1000000 = 18750 Using Z table, the sigma score is 3.6 Sigma Performance Levels – One to Six Sigma Sigma Level Defects Per Million Opportunities (DPMO) 1 690,000 2 308,537 3 66,807 4 6,210 5 233 6 3.4 Is this process good? 6000 to 66000 defects are there per given million opportunities. If the process is not improved and continues to work at 3 and 4 sigma, then client may seek some other vendor with greater sigma level for a long run. Any organization running at 3 and 4 sigma will not stay with the client on a longer run. If organization A works at 4.5 and Org B works at 6 sigma levels, client would prefer choosing 6 for its stability and capability on a longer run. Short term and long term Z The process sigma level is calculated by Z = (x – μ) / σ = (SL – μ) / σ Short term samples collected consists of random causes only and not assignable causes and it is usaually collected from one lot, one shift, one machine, one part / operator. This is also called as within variation. Long term samples are usaually random and assignable causes and data is collected from multiple machines, part, many opertaors, and many shifts. This variation is called overall variation which includes short term variation also. Short term is denoted by Zst and long term is denoted by Zlt. Zlt = Zst – 1.5 In sigma level calculations, use Zst. A Six Sigma process is 6 sigma in the short term and 4.5 sigma in the long term or: Zst = 6 Zlt = Zst – 1.5 = 4.5 With Zlt at 4.5 sigma level the DPMO would be 1350. And Zst at 6 sigma level the DPMO is 3.4 Now which would we prefer? Any typical process would have natural process variations over aa period of time and exhibits 1.5 shift in the future. Hence the process at 4.5 sigma level would shift 1.5 from the process average to the nearest specification limit with 3.4 ppm defects. This 1.5 shift will make the 0 defects approach with 1.5 lower sigma level. Why 1.5 shift? The normal distribution of the process or data will always predict he 3.4 DPMO when the sigma level operates at 4.5 and away fro mthe process mean. 1.5 shift along with 4.5 sigma level is required. Any normal quality six sigma process requires 6 standard deviations between the process mean and the nearest specification limits. It is because the process is likely to shift over the long run from 1.1 to 1.5 shift. It is the process natural behavior assuming the maximum tolerable limit of the process to meet the customer requirements, the shift happens. It is still acceptable as a long run measure for defect free approach. If the underlying causes are identified and rectified then the process with defect free approach runs longer with Zlt at 4.5 sigma level. Process sigma Vs sigma level Process sigma is process variation. It is measured in terms of data units as standard deviations. Whereas, the process sigma level Z is count with no unit of measure. Conclusion: For reporting purpose, the process capability is reported in terms of short term sigma with no special cause variations occurring. Long term is calculated by subtracting 1.5 from the short term considering the natural process shift of 1.5 between the process mean nad the nearest specification limit. Thanks Kavitha

-
Q40. What is the need to identify an outlier in a data-set? What are the methods and approaches that are useful for identifying outliers? Outliers are observed data points which are abnormal and away from the other observed data points. Outliers are usually the values which fall outside the trend of the data collected. In the sense, the values being normal or abnormal is upto the analyst who is involved in the project. Outliers are not bad and at the same time it is not good. Outliers can provide us some valuable insights about the variations in the process. Causes of outlier: Outliers can have multiple reasons. It may be due to human error, process error, measurement error due to measurement apparatus malfunctions, or natural process variations or even it could be due to sample contamination by the large population. It can also be by the flaws occurred in the assumptions made by the analyst. Type of outliers: 1. When we explain the process using bell shaped distribution, this will provide us the shape of the data collected explaining the features, symmetry and departures from the assumptions. The assumptions are clearly stated and deviations are monitored which is also called as outliers. 2. Analysing the data for unusual observations from the mass of data collected, are usually referred as outliers in statistics. Graphs used to identify the outliers: Scatter plot and box plots are used to identify the outliers along with the analytical tools like dixon’s test, chauvenet’s test , pierce’s criteria and rosner’s test, etc. https://en.wikipedia.org/wiki/Outlier Outlier detection criteria: Interquartile range: IQR is a tool which is used to determine the outliers. It has 2 important quartiles, first and third quartile. IQR = 3rd quartile – 1st quartile This tells the distance or how far the first half of the data set from the middle value or median. Determining outliers: IQR *1.5 will give you a certain value which will determine the outlier in the data set. 1st quartile –(1.5*IQR) is used to determine if the values are less than thecalculated value are considered as outliers. 3rd quartile + (1.5*IQR) used to determine the value if it is greater than the calculated number. Strong Outlier – Instead of 1.5, if we multiply the IQR by 3.0 and add or subtract from the respective quartiles, it is called as strong outliers. Or Extreme outlier: A point beyond the outer fence/ limits are called as extreme outlier. Weak outlier – Any other outliers apart from the strong outliers, are called as weak outliers. Or Mild outlier: when a abnormal point falls with in the inner llimits but far away from the other data point. Lets take with an example: Data set collected is as below. 1, 2, 2, 3, 3, 4, 5, 5, 10 From the above data, it is clearly seen that the number 10 is abnormal and far away from the other observed data points. Hence outlier is 10. But it is decided subjectively. To prove the outlier identified, IQR as mentioned above is used. First quartile for the data set is 2 and 3rd quartile is 5. IQR = 3rd quartile – 1st quartile (5-2) = 3. IQR *1.5 (3*1.5) = 4.5 Outliers: First quartile – 4.5 = 2 – 4.5 = -2.5, which means anything lesser to this is considered as outliers. 3rd quartile + 4.5 = 5+4.5 = 9.5, which means anything greater than 9.5 is considered as outliers. Reasons for outliers: Here begins your objective analysis to support the subjective judgement about the data. Of course outliers are always a bad data points. But it has to be carefully driven / investigated. Without a thorough investigation, it is not a valid situation to either remove or consider. Because it will provide a valuable information about the process. Consider the following before removing or considering the outlier: Ø If the outlier is caused by human error / measurement error / calculation error or process error then being accurate is a problem area. In such cases, omitting the outlier is a right choice. If it is not any any of the error mentioned above, the process itself has such deviations, then the outliers will provide us a valuable insight about it, why it has occurred, when did it occur and what are the main reasons behind, etc. This will help us in to initiate the project for process improvements. Ø If the outlier skew the process average, then it has to removed. If it does not skew, then inclusion may be possible to get an accurate picture of the process. Labeling, Accomodation and identification of outliers: issues with regards to outliers 1. Labelling – potential outliers are part of the erroneous data or it is an indicative of abnormal distribution of the data set. 2. Accomodation of outlier - If the potential outliers are not erroneous, we can modify the statistical tools to account or accommodate these outliers in the experiment conducted. 3. Outlier identification – A formal application or test to identify the outlier. Formal tests will follow the characteristics to identify the outliers 1. What distribution model is followed? 2. Single outlier or multiple outlier 3. If multiple outliers, is there any upper bound specified? Statistical tools 1. Grubb’s test – For single outlier 2. Tietjen moore test – multiple outliers 3. Generalized extreme studentized deviate ( ESD ) – Multiple outliers with upper bound specified. Conclusion: Outliers are often bad data points. But at times, it can provide a valuable information of the process behavior. Hence before removing or considering the outliers for anlaysis, is depending on the situations and distribution of the data. It has to be carefully investigated for the analysis to be more meaningful. Thanks Kavitha
-
Q4, Episode 3 - Is there anything called a mature process? When do you say that a process has good maturity? If a process is supposed to be improved or redesigned periodically, does an assessment for the maturity of a process carry any significance? Today’s technological developed market requires a best product / service, for which they rely on the organizations which excels in their ways of working. Hence organizations have to excel in their processes / work to satisfy the customer. Merely creating a maturity model and implementing does not mean the business process is best / excellent. Matured process is a measure of how well the process is excellent to delight the customer, lead the market and sustain the growth of the processes by exceling. Maturity measure requires the Six sigma, kaizens , lean and continuous improvement plans. Gradually the process imbibes the technical essence of these and excel in the process to say the process is matured. In short, the process is more concentrated on its capabilities to reach the process excellence. Process means “ a system of operations to produce the changes or end product/end result.” In any business framework, the essence of organization is people. Employees should work together to yield a business excellence at reasonable cost and overall efforts. Generally business processes follows the below framework for planning and execution of decisions and actions. A business process generally includes all the functions / departments ‘s activities or all processes (output of one process being input of another processes.). Why business process is important? There are many processes involved making together as one business process. Eg. Coding company has many specialties like Inpatient coding, Outpatient coding, edits and claims, etc. For the business process to be successful with the overall efforts placed depends on the following factors as well. Link between functions: Processes can be horizontally connected or vertically connected in the organization. The output of one processes is input of another processes. For the business process to excel, it is mandate that we concentrate on the entire fragments of business as one process and work upon to excel. Improving one process at the cost of another will not provide the expected end result. Cost of transactions: It is very important for the organization to plan and document, then standardize the actions/ steps involved in the process to make the transactions cost effective. Document the initial knowledge developed in the process as tribal knowledge, which might help in the future. Consistency in actions: Whatever the decisions and actions planned, the same have to be repeatedly followed to avoid rework waste and cost. Reliability of information: If the data collection process is well designed, then the information gathered around the data would be reliable. Assurance to top management: Providing confidence to the top management that the activities are taken care of in a proper way will build trust on team to trial any actions / decisions. Levels of Process maturity: The maturity of the process can be defined in one of the levels(0 to 5). Level 0 – People dependent process – No documented process is followed here. All the activities / steps are depending on the people working. Hence there will be multiple reworks, errors, and customer satisfaction would be a question. Knowledge transfer is not possible due to shortcuts followed to get the end result. Level 1 – Documented process: All the steps or processes are documented, recorded may be for future trainings. It will be created, reviewed and approved by the top management. If the process is at this stage, not moving to next, or consistently delivering bad quality, there will be a process drift since the document is not updated from the time drafted. So it is important, that we frequently update the document. Level 2 – Partial deployment – All the business processes / functions are not deployed with the actions taken. There is inconsistency in deployment of the decisions/ actions. Level 3 – Full deployment – No inconsistency found between the documented process and deployment process. Deployment happened in all functions as totality. This is as result of better communication. Level 4 – Measured & Automated: Entire process is automated and hence it is measured then and there to level the progress of the product. Short term goals are set within the process like timelines, quality, rate of production, cost, etc. It is either system driven or resource driven during audits. Level 5 – Continuously improving – The goals set already are regularly measured and monitored using the tight controls like Six sigma, kaizens, etc. the end goal of this initiative is error free product / service to the customer. Lean is made effective into the system to produce such environments. When the organization is initiated, the model been utilized to excel in the processes built into the business. Even after the maturity is gained, the process can drop to the level, where it might require some process reengineering. In such cases, the documents revised, the levels are adhered and progressed to level 5 to sustain its maturity. Apply DMAIC: (3 A Approach – Assess, Analyze and address) Define – Develop the questionnaire Measure – gather the documented process and audit the current process against the documented. Measure the gaps. Even if the process is automated and still not documented, then the process has deviations. It is considered a low level maturity process. Analyze – Analyze the data gathered for information. Use that information to create the need and demand for process improvement. Improve – Using Six sigma / Kaizen or some of the lean tools like standard work, etc, standardize the process. Control – Document the changes and create control plans to sustain the maturity level of the process. If the sustenance plan is not maintained, the maturity may drop. 3A Approach - https://www.isixsigma.com/new-to-six-sigma/getting-started/are-you-ready-how-conduct-maturity-assessment/ Process Maturity framework – Immature Vs. Mature process: Immature Process Mature process Immature process is always reactionary. It is also called fire fighting Matured process is planned, documented and capable of producing the products No realistic goals set. Realistic short term goals are set to achieve the excellence model Utilizes more cost / budget, time and resources than planned. Cost effective, schedules are adhered. Roles and responsibilities are clearly defined. Quality is compromised No quality compromise is allowed. No objective judgement / audit done to improvise the quality Continuous improvements are trailed and documented to excel in the ways of working for customer. Process is kind of outdated, which results in rework, and might lose the customer Process is well disciplined due to the overall team efforts in implementing the actions and decisions. If the process is highly matured, it should not need any improvement. If it needs any improvement, why is it called matured? Yes. Any process which is highly matured, should not require any improvements, if the process is continuously documented and achieved the automated stage. In such cases, the error free environment is created. Which means the system enablers are driven with the resource planning, enterprise planning at the reasonable cost. The process as totality is studied regularly and measured using rating scales. Critical business processed will be identified, rated and analyzed for continuous improvements. Any highly matured process without unattended for a period of time would drop its maturity. Hence it is required to frequently measure them. As the customer becomes educated about the product over a period of time, it is as important for the organizations also to educate themselves in the market and excel in the processes. Certain strategies like repeated usability of the process, effective communication and documentations of the process predominantly plays a major role. Usability has its own element like attracting work, doing work and communicating work. Usability of the processes and documenting the same with regular monitoring techniques will enable the process mature. Conclusion: Leaders of each and every functions should begin to addresses their process’s strengths and weakness. Use brain storm technique to collect the data and list it. Use prioritization matrix to identify the critical ones or develop a rating scale of 1-5 with 1 being least and 5 being best. Develop solutions or actions to improvise the process. Using Gnatt chart to effectively monitor the implementation of the actionable in totality. Organisation should continuously strive for kaizens to build a matured process along with the coordinated effort. Thanks, Kavitha


-
Question 3: While the Voice of Business is supposed to be in line with the Voice of Customer, there are some valid reasons that make them go against each other. What are some of the most common reasons that create a conflict between VOC and VOB? What is VOC? Voice of the customer is nothing but stated and unstated needs or requirements of the customer to provide the world class quality. It is a very critical component to gather information around VOC in all DMAIC phases. This process is all about constantly delivering the world class best product and being innovative, proactive in all the times to delight the customer. The need is gathered in terms of feedbacks, surveys, discussions, focus groups, observations, customer requirements, warranty/guarantee, complaints log. Hence in conclusion, it is customer requirements and expressed in targets. What is VOB? VOM is nothing but voice of business. VOB is based out of financial derivatives and its relevant data. This financial data will provide us insights on the product strategy, market demand supply gaps, research on product and its development, process requirements and its complexity. By understanding the potentials of the business, the management will decide upon selection of processes/ products that the goals and directions are met in order to satisfy the VOC. VOB is voice of the leadership team, organization’s mission or goals developed in order to satisfy the customer. Proper management is to highlight the burning customers to the team to identify the problems, fix it and act proactively to prevent such errors which is in order to keep VOB / VOP in line with VOC to delight them. Common reasons which creates the conflict between VOC & VOB: VOC VOB Gathers feedback on the product / services provided to the customer Gathers financial derivatives, which involves market research Information is collected once the product is delivered to the cusstomer and the customer uses it to provide feedback. Information is gathered before the product is developed and ongoing research is conducted to innovate new techniques Customer's need and requirements are gathered and incorporated in to project selection to add value to the value levers identified. Value levers (strategic, process, customer driven & Financial levers ) are identified in the process of development of the product in aligned to the goals of the organisation. Customer's needs People who runs the organization's needs Deep insight in to the product that he is willing to pay for Deep insight into revenue, economic growth, market leadership, etc Does VOC & VOB compete? The company is doing to business to make profit, sustain & lead market, develop and accomplish goals and mission of the organization. Customers can’t be a scape goat at any cost. Oraganization should aim to accomplish the goals developed to satisfy the customer, make profit and invest for future advancements to delight the customer. Do the VOC override VOB? No. Customer would always prefer the product at the cheapest price. Its true. But When a company can’t deliver the product which the customer wants, the product fails. Either the VOB should get convinced or VOC get convinced. Both the ways to satisfy each other , the concept of VOB & VOC should go hand in hand, with all the processes mapped continuously to add value to the process, business and customer. Conclusion: VOC & VOB should go hand in hand for the organisation’s success. Understanding the business potential will helps us deliver the best to the customer and lead the market to sustain the economical growth and its revenue slab of the organization. thanks Kavitha
-
Q1 - Episode 3 - Measures of central tendency and spread have their own relevance in most situations. Please explain situations where variation (spread) is of highest importance and central tendency is very low in importance (or is irrelevant.) Measures of central tendency are Arithmetic mean, median and mode. Also called as central location, which follows a normal distribution. Hence called as summary statistics. The best measure to describe the data set is mean and again it depends on the situation, which measure to be used. Measures of dispersion are called as statistical dispersion, which follows a distribution with spreader / stretched effect. It measures variance, range and standard deviation. Measures of central tendency is used to denote the normal values of the dataset, where dispersion is used to denote the variability, scatter and spread of he data around the central value. Dispersion is important because it explains how well the mean represents the wellness of the dataset collected. It means it describes the relationship with the measures of central tendency. When the data has a large value, the spread is more and when the data has a smaller value, the spread is tightly packed. Hence given a measure of dispersion, it is important for one to find how well the data is spreaded over the central location. Range: it is a measure of dispersion, which tells the difference between highest and lowest value in the dataset. Range = Max value – Min value. Variance: It tells us how well the data is spread out of each other. It is square of SD. Standard deviation: It tells us how well the data are spread out from the mean/central location. It is used for data which is normally distributed. SD is determined by variance. It is root of variance. The formula for a sample (S) is Where x represents each value in the population, x is the mean value of the sample, Σ is the summation (or total), and n-1 is the number of values in the sample minus 1. Conclusion: It is important that you measure the spread of the data to reduce the variation around the mean / target of the process than considering only the central location of the data set collected. A well defined process should be centrally located with reduced process variations around the mean. Hence calculating only central tendency provide us insights to how well the process is distributed normally. But calculating the dispersion tells us the relationship of spread around the central location. Thanks Kavitha
-
Question: While continuous data is generally preferred over discrete data, please indicate circumstances where discrete is the preferred data type although continuous data is available for the same characteristic. Answer: With given a choice on the data type, it is always useful to analyze the continuous data rather than discrete, because discrete though it has large data samples studied, the data will not be broken down into meaningful information. Continuous data can be broken down into smaller pieces and make the data informative to the decision making. With a given continuous data, we can estimate how process mean is close to or far from the target. & whether we are out of spec limits or within spec limits. Example 1: (Continuous data over discrete data) Diameter of a pipe when it is produced is collected for analysis purpose. In this case, the diameter is measured in mm. Lets say, target is 10 mm and 1 mm over to it is ok. As stats are concerned, at a very high level picture, it is classified into <10mm, between 10mm & 11 mm and >11 mm. This will be projected in discrete data, as the categories/boundaries are defined and counted as defects. This has no meaning into decision making. But when the data is represented as continuous in I-MR chart, the no. of pieces which are out of spec limits are identified, root cause will be identified and arrested. It is not possible with discrete data. Hence Continuous data is always preferred. Example 2: (Discrete over Continuous data) Lets say, 20 employees working in ABC process been monitored for shift adherence. Time they login is collected against the target of shift start time & Plotted in time series chart as continuous data to find the defect %. But it will be useful in terms of RCA and not meaningful if we have to count the defect count and report out that how many were late and how many were on time. Hence for such type of data, though the data collected from a real time scenarios and possess continuous data characteristics, it is meaningful if we present no. of late logins and shift adherence % to management as discrete data. Here such instances like average delivery time, processing time, login time, etc falls under continuous data, for reporting purposes, it is useful to represent it as discrete data. Examples where discrete data is preferred over continuous data: Examples Continuous data discrete data Shift adherence Login time is noted for all employees. For reporting purpose, continuous is converted as discrete (Late, early, on time) and presented for meaningful decisions. Minimum balance of 1000 in bank account Balance range is collected for all account holders. Classified as "Maintained / Not maintained" and reported out as discrete. Car fuel guage how many litres remained in the car fuel tank gauge indicates " Full, half, Empty" Height of the child in school records Height is noted for each and every child and compared against the growth chart wrt age of the child. How many are underweight and overweight? Been counted from the collcted data and presented at high level. Conclusion: Does this mean only attribute data is good enough? Of course not. Both plays a different role. For decision making, RC analysis, continuous data is more meaningful but reporting purposes at high level, discrete would be better. So answer is it depends on the underlying characteristic that we want to measure / collect and represent. If it is continuous data, then you will have the choice of reporting it out as continuous or discrete or both. Thanks Kavitha
-
What are the methods for unlocking, capturing and harnessing “Tribal Knowledge”? How much importance should one attribute to this endeavour? Answer: Tribal Knowledge is one of its kind of company property, which will be used in experiments of improvement projects. Tribal knowledge is a unwritten information. In most of the companies, only few employees will possess a great knowledge or in depth knowledge of the product / service. Tribe meaning a group or subgroup of people that they share a common knowledge in their minds but not documented. But it may be a tool for quality improvement which will also possess equal risks on implementing. Eg. Introducing traditional methods into the company. Eg. Processing Hemoglobin technique using the heam meter and solution as per traditional method and the humans who had sound technical knowledge of processing Hb results in the good old machine / meter is called tribal knowledge. What are the problems we face with tribal knowledge: Each and every function is unique in the company, which requires different type of skill sets. When employees are assigned to their functions or departments, some analyse the process in depth and understands it in detail and possess a great knowledge and skills within the company about the task / product. And company also fears to lose them. Since the tribal knowledge is no where documented, it may be a threat to the company as well, due to over dependency on the skillful employees. Ø When employees leave the organization, the tribal knowledge vanishes. Most of the tribal knowledge also vanishes, leaving a new employee known to half of the facts of the product, as it might be due to value given by company to the new employee is way high compared to old ones. Ø Tribal knowledge is a barrier to automation, because they still believe in manual processes to improve quality and speed rather than automation. Ø Employees hoard information due to job security. Due to high tech convulsions, there would be few cases in each and every company who would know how to solve the problem and would never share it with anyone on how to solve issues. There also exists tribal knowledge problem. How to unlock the tribal knowledge: As we all know “ Knowledge is power”, we will have to unlock the tribal knowledge and document the information and make use of it in the organization to improve quality time and cost of the processes. Tribal knowledge is rich and useful: As we are humans, it is natural for us to form groups. So create groups in departments based on expertise, functional roles and common goals. A collaborative teams develops initiatives, programs and projects to identify the tribal knowledge. The knowledge developed in one subgroup would be analyzed in details based on the expertise and would be shared to other tribes for experimenting. The knowledge may be correct or may be wrong. Hunting, gathering and new way forward: A analytical hunter professtional hunts, gathers and compile, study, interpret, re-arrange and publish the information in understandable formats / process notes to other tribes for experimenting. It requires additional effort and it is costly from organisation’s perspective. So it requires time, cost, and human effort and last but not the least morale in taking up the knowledge. The pace of innovation in cutting edge products / services plays a major role. Path to transformation: Successful approach will follows the below. Ø A common goal / wish to hunt and gather the tribal knowledge to align operations Ø A common vision of the organization to make the processes effective and efficient Ø A comprehensive documented methodology for cross functional deployement of tribal knowledge Ø A process to deploy best practices, develop new models and new information flows to sustain the solid tribal knowledge. How to capture tribal knowledge: Below are the approaches for tribal knowledge Identify the knowledge gurus : Mostly the people working in the floor are the masters of the knowledge. They would not be sound enough to translate the information to written document. But as hunters, we have to identify the gurus. Identify the knowledge: Whether it is useful or waste, we will have to document the information received,. Experiement each and every step for its success and failures and document those in detail. Commit to the time: Yes. Identifying and documenting the tribal knowledge with solid proof is not an easy job. It is time consuming. Management should accept the fact and support the analytical team for making it success. Transition of older workers: Identify the older people with tribal knowledge nearing their retirement age and develop programs to engage them in training and share their knowledge, experience and skills to the next set of employees. Conclusion: If its not documented, no one knows. It may possess a artificial fact, but it is useful information. It is a unknown information to most of the employees in the organization. It involves a process that contribute significantly for quality, time , and speed improvement of the process / product /service. Tribal knowledge is often created unintentionally and is common in most organizations. Companies must be diligent about capturing this information and making it readily available to all employees. Thanks Kavitha
-
Question: What would an excellence practitioner lose if he does not utilise the concept of rational subgrouping in the pursuit of process improvement? Answer: Rational subgrouping is set of observations made under the similar set of production environment. Sample or subgroup is in a way same only. Sample is subgroup of the population. But the only difference is when different samples are picked from the same population. Rational subgrouping reflects the process that you are working. Also, It usually represents the in-built variation of the process, which is called as common cause variation or within subgroup variation. It will tell you how the data been collected. The individual data points collected is usually independent of each other though it is all sub grouped. For Eg. If the coder produces 20 charts per hour and 50% of the chart to be audited. Hence the Auditor picks systematically every even numbered charts for auditing throughout the day or at even regular intervals. Sample of 10 per hour represents a subgrouping. Sample usually denotes a individual sample of the group. Sub group would always represent homogenous condition’s data points. Two types of variation: Within subgroup Variation: variation within the group / process sampled. Also called as common cause variation. Between subgroup variation: variation between the measurements of the sub groups. Also called as special cause variation, which has to eliminated for any quality improvement project. Control limits & Variations: Control limits are calculated using common cause variation. Sub group averages and variances are calculated from the homogenous set of data points. Subgroup is represented as individual point on the control chart with control limits inhibiting common cause variation. The goal of the project is eliminating the special cause variation and reducing the common cause variation. Usability: Sub grouping is done to help in decision making using the sample for the population. · Helps to reduce the common cause variation and eliminate the special cause / assignable cause variation. · Sub grouping along with control charts will create the base of decision making. · Helps us to find out how much of variation exists within subgroup. · Helps us to visible the process. When Rational subgrouping is not possible? When each and every items are checked or 100% audited, the rational subgrouping is of no use. For Eg. In case of automated inspection method / technology built audit method followed while processing and submitting a chart, rational subgrouping is of no use. Since all the charts are getting inspected. When medication effect is analyzed in preparation of medicine in pharmaceutical company or hospital, repeated analysis is done. Hence rational subgrouping is no use. In conclusion, in any business excellence project, if rational subgrouping is not done, common cause will be identified and reduced. This subgrouping will help identify the types of variation and the context of data like how they are collected, how time ordered the data is and highlights the variations and helps eliminating the special causes. Thanks Kavitha
-
Question: A Sponsor is someone who funds Business Excellence in a company, a strategic business unit or a function. What are the most important qualities desired in a Sponsor to ensure that Business Excellence will thrive in the organization? Project Sponsor is usually a senior most person or sometimes the project manager himself or even a chair person. Resource planning is an important activity in project management. Once the resources are planned, the training takes place if the expertise skills lack. But usually, mapping happens according to the skill set of the team. Success rate of the project depends on the skills. Project sponsor is also not exempted from this. A technically sound Project Sponsor should possess Problem identification and decision making skills, motivating and building cultural change in the organization as change agent, Communication both upwards & downwards, proper guidance / direction from them. If the project sponsor is not willing for the project in the beginning itself, at any point in time, the project may fail. Hence it is important that the project manager gets the project sponsor involved in to project identified and aware of the milestones studied. Most importantly select a sponsor for project or else, the project suffers. There are few top qualities that the sponsor should have in order to success the project. They are discussed as follows. 1. Deep insight on the problem: Sponsor should be in a place to clearly understand the problem which has to be solved. He / She should give an answer to questions such as “What is the problem? New one / Old ? How intensive the problem is? Who created it? What is the impact? “etc. The problem may be existing problem in the organization or opportunistic approach for predictive problem. 2. Deep diving into root causes: Sponsor as part of all the milestones, he should be able to collect all critical Xs Which impacts the output(Y). Identify the real root causes but not the symptoms. He should judge the analysis relating to symptoms / real root causes. For E.g. The TAT for discharging patients is around 12 hours. If the project team works on reducing the TAT from 12 hours to 4 hours as per the standard, then automating the process may be a feasible solution. But Without identifying the VA & NVA, without eliminating NVA, automation is just a wasteful activity though it adds value to the organization. It only addresses the symptoms but not the root causes. Hence process re-engineering along with automation is the best solution. 3. Decision making: When a team selects a project, it is easy for them to solve multiple issues at one go with a proposed solution. If the project has to increase its scope / budget / time, a sponsor should decide considering the business requirements. Sponsor should ensure the project is focused on arresting the bleeding issues and not widely taking up all, because a team can’t do all at a time. 4. Implementation of solution: Sponsor plays a major role in communicating he solutions/ changes proposed upwards and downwards. He acts as a change agent. He should clearly envision the problem, root causes, how solution helps the team, how issues will be solved if implemented, what would be the benefit, to the management. 5. Basic needs, performance & Excitement needs: Sponsor needs to have this accountable to company. He should know what good enough is for the project, for the organization, for the customer. Good enough is nothing but you have taken the company’s needs, translated into requirements / CTQ and for which solution is proposed. Customer’s needs are very important while in starting and completing a project. Without delighting / satisfying the customer, a project is again not successful. Also a sponsor is cautious enough so that the organization’s resources are not wasted and should not over deliver / under deliver the solution. 6. Build the team right: Sponsor should build the right team with right people, right skills, right time, etc to deliver the project deliverables. He should possess a strong relationship among the team to run the project project. He should trust the team and vice versa. He should appropriately select the team and stakeholders with the required skills. Inexperienced or new manager can’t take up the lead position, which fails the project. It doesn’t mean the new guy can’t lead. It depends on the nature of the project. Most of the time, when a project fails, it shoulders the new project manager’s/ team members. Always make them accountable for the project success. Make sure resources are rightly allocated. Shouldn’t be over staffed or under staffed. Make sure you remove if any non-performers are there in the team. This is always helpful for the success of the project. 7. Accountability: Make sure as a sponsor, you make the project manager / team accountable for the success / failure of the project. Regularly meet up the team. Get the updates. Provide suggestions if required. Always keep up the timelines specified. Ensure the team is focused on the project scope and goals, timelines and deliverables. A relaxed Project sponsor will always end up with the failure of the project. 8. Critical X’s Vs. Non Critical: Sponsor are the one who has to keep engaged on the issues, and the devise a strategy onto the issue. List down all the factors causing the problem, prioritize the X’s, stay focused on the critical X’s rather focusing on the non-critical ones. Sometimes proposed solution may be just enough to solve the noncritical issues. Hence sponsor should cautiously utilize the team. Being available to the bigger issue itself is a biggest help that a sponsor can do to his team. You ensure that the team is accountable for each and every task that they do. 9. Mentor / Influencer: Best sponsors are not those who sits just into office and take updates once a while. Best sponsors get himself into the issue along with the team, identifies the root causes and devise a strategic plan to arrest the issue. He takes risk in trailing certain solutions. He influences people to adapt to the change prescribed. Being available is tehe best help that he can provide. 10. Trial and error method: Best sponsor is the one who makes a thoughtful decisions through tough problems along with the team. He is not feared of any problems. He trails the experiments and proposes a best solution. He allows risk to become a feasible solution. 11. Strong controls over the completion of the project: Sponsors always create a governance plan along with the solution to be implemented. He implements and sustains the solution in order to completely eradicate the problem from the organization. Sponsors communicate effectively the completion of the project as well being the change agent, creates a cultural change in a positive manner. 12. Pull the plug / Accept the failure: Sponsor should also accept the failure not only success of the project. Uncertainty of the project to be accepted and motivate the team. Summary: Sponsor plays a vital role in business excellence model. He should be open to all challenges and active. He should be a good communicator, decision maker and strategist. He should also allow risk and help the team learn and unlearn. Sponsors along with the team can definitely make a difference between success and failure of the project. Thanks Kavitha
-
Baseline can be defined as the current level or point from which we intend to improve the performance of the process or project. It becomes necessity to evaluate if the changes implemented in the process has made them move closer to the intended goal or not. It is helpful to understand and define the current level of the process and is also necessary to measure the impact of the improvement plans deployed to improve the performance of the process or system. Baselining is of 3 types. They are 1) Schedule baselining 2) Cost Baselining and 3)Scope baseline, which we are as listed below. Why baseline is important? It is important so that we can · Be able to assess the current performance · Calculate the earned value of the process · Estimate the accuracy of the improvement process. While baseline is set to compare the state of the process before and after process improvement, we have to accept the reality that not always this comparison is valid or relevant given the change the process undergoes while the improvement activities are made. Below are few examples which helps us understand how performance comparison of an improved process with the baseline can mislead or becomes irrelevant. · When there is change in the resources based on which the baseline was set, the impact of the new resource on the baseline will not be known as the resource has worked only in the updated process. For example, if baseline is set based on manual process which is automated, and a new resource joins the team who is trained directly in the automated process, comparing the performance of the team and resource with baseline is inaccurate as there is a change in the team composition before and after process change. · When there is a change in project scope which was accommodated during process improvement, the influence of the updated scope on the baseline is unknown and hence comparison of performance becomes debatable. In hospital industry, duration for effect of the medicine on patient is baselined inline with historical data. But if there is unexpected factors which leads to variation in the expected duration the baseline will have to be adjusted considering the changes observed. Also when the goal of the project selected is wrong, the baselining will have to be adjusted. For Eg. When we try to work on improving the Voice of the customer collected throught survey from the client, (as it is a long term goal), we tend to miss on the short term goals. In case of serving a food to the customer, he says, food taste is not good. instead of correcting this immediately, if a person too much involves in the customer' s other preferences like appearance of hte food, he losses his short term goal of pleasing he customer. · When different skill set is required to work on the improved process, the expertise of the resources in the new skills is unknown and hence comparison of performance can be questioned as the impact of the newly acquired skill on the other components in the process performance metric has to be considered. For Eg. For a radiology coder, the baseline done basis historical data is 350. But when the coder is assigned a same radiology process with different platform, the baseline needs to be adjusted in line with after improvement numbers. Though the process reengineering is successful, the baseline is meaningless when we will have to compare two sets of skills. Conclusion: Baselining depends on the process we chose to improve. Baseline will have to be adjusted when the after improvement numbers drastically changes. Thanks Kavitha
-
Rework is considered a wasteful endeavor. However, in some processes, zero rework is impractical or undesirable. Please explain the outlook for business excellence by taking examples of few such processes. Rework means redoing or repeating the process, when it is rejected in its first opportunity given, which involves extra human effort, time, cost and diverse risks. This might be due to failure of the design, defect / error, changes suggested, poor communication or poor coordination between the supplier and customer. This will also have a huge impact on the product delivered to customer and their satisfaction scores, organization’s reputation, performance metrics of the organization. Rework often results in other such wastes like delays, waiting time, motion/transportation, etc. “Do it first time right” is the concept we will have to apply in reducing the rework cost. Zero Rework is impractical: · When the defect / error is identified, the rework is mandate to satisfy the customer. For Eg. In medical coding organization, the coder codes the chart and it is being audited by the QC and corrected the chart before sending it to client. In such instances, to please the customer and provide him error free chart, rework is necessary, where it requires additional human intelligence/ robotic technology of correcting the error. This requires additional man power, extra investment in building additional intelligence and to strengthen the gate way of defect free zone in the organization and time. · When the changes suggested by the client / end customer in the product, rework is done. This is also called customization of the product. According to the customer’s preferences, certain products are redesigned and given to client to improve customer satisfaction scores. For Eg. In case of buying a flat, customization of features like paint color, extra wall coating, extra interiors, etc will be suggested by client and rework is inevitable by the builders. · When the design requires rework due to multiple delivery modes, rework / repeating the process is not avoidable. For eg. In publishing industry there will be different template for print and web delivery for which the input codes has to be reworked according to the deliverable. · When there is poor communication or poor coordination between supplier and customer, rework is inevitable. For eg, In manufacturing when the supplier misses to clarify the specification used by customer to indicate the dimensions of the product leads to rework to meet the requirements of the customer. Few more examples, · In Software development, certain aspects of the output will be visible only after execution of the program. In such cases there exists possibility of rework to re-align with the desired outcome. · During survey, when the person conducting the survey is not able to map the answer from questionnaire with the factors under consideration for predictive analytics the author reworks on the questionnaire to get expected responses. · In marketing industry, the executive has to explain the specification and uses of the product being sold multiple times to a customer while pitching the product to convince the customer to buy the product which is also a rework for the executive. Conclusion: Rework is definitely a waste. At the same time, rework is important when the error / defect is identified. Also to delight the customer, in certain cases like product redesign, etc, rework is inevitable. It is a difficult and additional cost/ time/ man power involved process. Though there are challenges, to keep up the customer in tight with organization, rework is an important and considerable activity. Thanks Kavitha