

Arunesh Ramalingam
Members
-
Joined
-
Last visited
Everything posted by Arunesh Ramalingam
-
Arunesh Ramalingam replied to Vishwadeep Khatri's topic in We ask and you answer! The best answer wins!In my opinion the OEM should follow the following steps: 1. List the 20 possible reasons for failures as three lists arranged in: decreasing order of criticality (i.e. the most probable root cause) decreasing order of probability of occurrence increasing order of cost to mitigate (The possible reasons could be identified based on a detailed Fault Tree analysis considering every possible cause, even the remotely possible ones , Cause Effect diagrams, fish bone Analysis and so on by a task force team comprising of experts) 2. Focus on the most probable cause or causes with high probability of occurrence and either mitigate or eliminate them, keeping in mind the cost involved and the investment that the business can afford. 3. Use past complain reports and analyze average time period after which the components have failed. Based on this analysis they should come up with a conservative estimate of the average life of the component. 4. Proactively replace the components in field, that are nearing the average life period, with new components. ( i.e. before the actual failure causing downtime) 5. While installing the new components set up mechanisms ( instruments, software checks) to trap and capture data when failure occurs next time to verify real reason E.g. temp sensors recording data to see if a temperature rise is causing issues or a vibration sensor to check for intermittent excess vibrations and so on. 6. Test and analyze the current status of components removed from field for any failures. 7. When steps 4,5 and 6 are repeated for 1 or 2 consecutive cycles there is a high chance that the real cause of failure can be identified and rectified.
-
No. Venugopal, Good to read the comments. I never challenged the value project execution experience carries. My contention was always on whether it should be a "Must have/Essential criterion" or Not. In spite of having so many unknown factors such as the quality or Genuinity of the projects, the benefits realised, the factors that helped in completing the projects, if it is still made an "essential criterion", then the company only restricts the kind of candidates it receives. Also your example validates my thought process that it may not be essential criterion, as your organization was satisfied hiring a guy without having the project execution experience. I feel that, if it is an essential criterion then potential candidates like A ( "trained BB" from my earlier example) might not even get shortlisted for the interview. Some potential candidate (like A) may not even apply, if it is very evident that they do not satisfy a "Must have" criterion. I totally agree that there are other variables regarding the company's bandwidth (their situation, time, position criticality and resources availability... ) which come into play. If the position is for, say, the first BB that the company is hiring, then surely an experienced candidate would be good. Given the general nature of the debate topic, I still hold my stand that it should not be "essential criterion" . A person with general Project management experience/skills and a good command on six sigma concepts/techniques should be able to do justice to the position. With this I rest my case. Thanks.
-
Appreciate Mohan PB's effort in analysing most of the answers and sharing the comments. Valuable comments from Venugopal and many others!! I still do stand by my opinion that it should not be "essential criterion" but should be a "good to have". Let me give a hypothetical example to explain my thought process. I understand the BB certification process consists of 2 steps: Step 1. Passing an Examination to prove technical and conceptual Six Sigma knowledge Step 2. Project to exhibit practical knowledge. Most people, complete step 1 and are stuck looking for opportunities to complete Step 2. What can these people be called - If not "Certified BB" then may be "Trained BB"? Consider two candidates A and B with following background profiles applying for a improvement Manager position in your company: A - Trained BB (Step 1) - understands Six sigma concepts and techniques, questions existing processes and enthusiastic with a keen eye for process improvement opportunities. He has been a project manager for various technical projects - handled teams, interacted with management /customers , resolved conflicts, but has not been involved in Six Sigma projects. B - Certified BB - Due to unavoidable circumstances, he had to move to the the Quality department in his company. He has completed certification and has completed projects to save and sustain his "Job". Now due to some reasons he has to change companies, but Six sigma is the field he has been working in most recently and is experienced certified in, so he has to apply for similar positions. Now, my argument is based on the fact, that if project execution is "essential criterion" then Candidate A becomes ineligible and the company is left with no choice , but only candidate B. This is not favourable, because candidate A with some mentoring (learning gap) could have been a better option than B. On the other hand, if project execution experience is a "good-to have" criterion, then the company would have had both candidates and can evaluate between them. I am not suggesting that a newbie who has just academic knowledge on six sigma should be considered. I am only suggesting that a experienced professional who understands and is experienced in project management/execution ( team building, conflict resolution, communication with management) and technically clear on six sigma methodology/concepts should not be left out from consideration, only due to the fact that he may not have executed six sigma projects. If a company gets two candidates with similar skill set and same enthusiasm for improvement projects, then preference can definitely be given to the candidate with project experience, but it should not be made an eligibility/essential criterion.
-
My stand is NO. In my opinion it should be a "Good to have" requirement. I strongly feel the following two aspects should be given more importance: 1. The Professional's familiarity and understanding of Lean Six Sigma concepts and his attitude/thought process towards the concept of "Continuous improvement". This aspect would indicate if the person would be able to identify, initiate and promote improvement activities. 2. The Professional's overall job experience. This would highlight his skills related to working in a team, leading projects, ability to communicate with the management, handling conflicts and so on which are critical for executing any six sigma project. I would agree that a person with prior project execution experience may be more familiar with all the aspects of project execution, but he may not be essentially a keen promoter of continuous improvement culture. Also, the ambience under which he completed the projects is an unknown factor. For example, there could have been high level of support that he received from the management and his team, enabling him to complete the projects. On the other hand, a professional with the right attitude and skills may turn out to be a better option ( albeit with some mentoring or learning gap). The points 1 and 2 identified above could be evaluated with well drafted detailed interview questions involving case study analysis and presentations. The completion of a full-fledged DMAIC or DMADV project should be a "good-to-have" requirement, and making it an essential criterion may not be the right thing to do.
-
FOR. "Zero Defect" is a work culture that an enterprise may like to inculcate in the workforce, emphasising that defects are not acceptable and everything should be done “first time right". The implementation of this philosophy depends on: 1. Operational Definition of Zero defect as perceived by the management 2. Efforts taken by the management to communicate the same and ensure it is understood by one and all 3. Time and Money invested by the management in process design and checks, employee training and so on to build and drive the culture.
-
Arunesh Ramalingam replied to Vishwadeep Khatri's topic in We ask and you answer! The best answer wins!A process with 100% Rolled Throughput Yield (RTY) can be considered efficient or inefficient based on the way RTY is calculated. Rolled Throughput Yield (RTY) is the total yield of the entire process calculated by multiplying the yields of all the sub processes. It can be calculated as following: Case 1. RTY = FTY(A) * FTY(B) * FTY(C) (or) Case 2. RTY = FPY(A) * FPY(B) * FPY(C) where A, B, C are sub-processes that constitute the process for which yield is being computed. FTY- is First Time Yield FPY- is First Pass yield First Time Yield (FTY) – This metric is defined as ratio of number of units output of a process to the number of units Input to the process. The output may include defective parts that were repaired / rectified. First Pass Yield (FPY) – This metric is defined as ratio of number of units output of a process to the number of units Input to the process. The output is before any inspections/rework and does not include defective parts that were repaired / rectified. i.e. it accounts for COPQ. Example: Sub Process A B C Input 100 100 100 Defective 20 10 10 Repaired 15 10 5 Scrap 5 0 5 Output after rework 100-20+15 =95 100-10+10 =100 100-10+5 =95 Output before rework 100-20 = 80 100-10 =90 100-10 = 90 FTY 95/100 = 0.95 100/100 = 1 95/100 = 0.95 FPY 80/100 = 0.8 90/100 = 0.9 90/100 = 0.9 Case 1. RTY = FTY(A) * FTY(B) * FTY(C) = 0.95*1*0.95 = 0.9025 or 90.1% Case 2. RTY = FPY(A) * FPY(B) * FPY(C) = 0.8 *0.9 *0.9 = 0.648 or 64.8% Thus, we can see that the way RTY is calculated can be very critical. In the above example, if for sub process A and C, all the defective parts are reworked or repaired (i.e. scrap = 0) then calculation per Case 1 would be RTY = FTY(A) * FTY(B) * FTY(C) = 1*1*1 = 1 or 100%. But the process is inefficient as it produces defective parts and time, man power, energy is spent in rework and repairs.
-
Arunesh Ramalingam replied to Vishwadeep Khatri's topic in We ask and you answer! The best answer wins!Coefficient of Variation (CV) is a statistical measure of the dispersion or spread of data points in a data set around the mean value of the data set. It is the ratio of standard deviation to the mean. It is also called relative standard deviation (RSD). Uses of Coefficient of Variation: Example 1: Comparing the spread around mean in two or more data sets when the Means of the individual data sets vary. CV especially helps in comparing the degree of variation from one data set to another, when Standard deviation (SD) between data the sets may be similar but mean of the data sets may be drastically different. Set A: Let Mean = 60 and SD = 10; Then CV = 6 Set B: Let Mean = 30 and SD = 11; Then CV = 2.7 Looking at SD Sets A and B may seem similar but looking at the CV it can be seen that Set A has a much higher spread around mean than Set B. Example 2: Evaluating and pick stocks in the Investment Market. Volatility in stock market indicates the stock’s value spread. High Volatility means the spread could be over a large range of values, while Low Volatility means the value does not change dramatically, but changes at a steady pace over a period. Higher the volatility, the riskier the stock. Volatility can either be measured by using the standard deviation or variance between returns from the same stock. CV helps investors assess the Volatility (risk) to expected returns for their portfolio. Analyzing Data for past 10 years for three stocks A, and C as indicated below: Stock A: Standard Deviation is 15.5% and Average Annual Returns is 3.5%, Then CV = 15.5/4.5 = 3.4 Stock B: Standard Deviation is 27.3% and Average Annual Returns is 6.4%, Then CV = 27.3/6.4 = 4.3 Stock C: Standard Deviation is 16.7% and Average Annual Returns is 5.1%, Then CV = 16.7/5.1 = 3.3 A Risk averse investor may pick Stock A or C based on similar CV, while a risk taking investor might go for Stock B. Example 3: Selection of a material between A and B, that has uniform behaviour at different temperatures for thermal applications. Data can be collected for the materials A and B under various temperatures in the required range. Subsequently, Mean, SD and CV can be calculated from the collected data sets for Materials A and B. The Material with the lower CV would be more suited for the application. Example 4: Out of 2 Restaurants, evaluating which one has a more consistent delivery time. Delivery Time sets for the two restaurants can be collected and the respective CV’s calculated. The one having a lower CV is more consistent.
-
Arunesh Ramalingam replied to Vishwadeep Khatri's topic in We ask and you answer! The best answer wins!Failure Mode and Effects Analysis (FMEA) is a procedure for determining points where processes, products or designs are most likely to fail and the reason why they would fail. It is used while designing processes (and/or) reviewing and improving an existing process (and/or) for process control. FMEA is essentially a step-by-step procedure to identify each failure mode. Further analysis then helps estimate the effects of failure and devise process control methodologies so that the identified failures can be averted. Process FMEA used to evaluate manufacturing and assembly processes. System FMEA used to analyze complete systems and/or sub-systems during the design concept stage Design FMEA used to examine product designs before their release to manufacturing. Limitations: Only as good as the knowledge of the team using it. Issues and failure modes beyond the knowledge of the team member will go undetected or unresolved. Chances of Human error (by the team) of missing out a failure mode is possible, in which case, it would be ignored. FMEA prioritises Failure mode according to their risks. This may not eliminate all failure modes. Selection of the failure modes for analysis could be tricky as the team could land up picking something that is either too big or too small. Process should be broken down into manageable segments. FMEA is a dynamic procedure and needs to be constantly reviewed and revisited to assess new risk and failure modes that may com up and control plans developed.
-
Arunesh Ramalingam replied to Vishwadeep Khatri's topic in We ask and you answer! The best answer wins!An Operation is any process that takes a few inputs through a few steps and returns a more useful Output. Example: any manufacturing plant, Insurance claim process and so on. Cycle Time is the average length of time of the operation i.e. the time taken by the steps to complete. In other words, it is the time taken from start of work till finished product is ready for delivery. It can be said to be the total Working Time. Lead Time is the entire taken from the request for the product till the delivery is made. It can be said to be the total Wait Time. But there are few other terms and definitions which cause confusions: 1. Order Lead Times which is more in line with the Lead Time definition above i.e. Wait time 2. Production/ Engineering/Manufacturing Lead Time: This is more in line with Cycle time definition i.e. Working time. Lead time is a Customer's perspective, while Cycle Time is a Manufacturer /Service Provider's perspective (Process' perspective) So, when we talk about lead times in general, it may become confusing which Lead time we are talking about or the perspective and at times it gets used interchangeably used with Cycle time. To avoid this confusion, Cycle Time can be understood as being a measure of process capability. Average Cycle time can be computed as the ratio of operating hours per day to the quantity produced per day or Throughput for the day i.e. Cycle Time = Operating Hours per day / Throughput per day Lead Time units will be same as time - hours, minutes, days, week and so on. Cycle Time would be time/unit. Lead Time is always greater than Cycle time.
-
Arunesh Ramalingam replied to Vishwadeep Khatri's topic in We ask and you answer! The best answer wins!I support Statements A, E and C and in that same order. I would modify E slightly as listed below. In C, I would, differentiate between Short-term performance valuation goals and long-term corporate vision goals. A. If it is desirable to set an objective of Zero Defect Quality, we should set the goal, but this should primarily be a top-down system driven initiative and not a bottom-up approach. Zero Defect is more of a work culture - a philosophy. It emphasises that defects are not acceptable and everything should be done “first time right”. Implementing such a culture should be top down approach from the management to the workforce. The management should first recognise the high cost, customer dis-satisfaction and harm to the brand value involved with quality issues. Once the management develops the vision for “zero defect” quality, it needs to develop an operational definition and ensure that this vision and definition is communicated down to the bottom level of the work force and the entire organisation has a very clear understanding. There should be no ambiguity or scope for modified individual definitions. The management should invest the money, time and resources to implement proper process and systems and workforce training to ensure quality flows through the production/service line. E. Workforce if engaged in improvement initiatives, can do wonders. While EXCESSIVE slogans and rigid targets should be avoided, improvements in quality and productivity should still be expected from workforce. The implementation of any quality improvement activity necessitates every actor to understand it, believe in it and be responsible for it. To imbibe this culture, it is critical that the workforce is involved in the whole process. A sense of involvement drives a sense of responsibility. Also, responsibility without authority would drive an individual crazy. So, the workforce should be engaged and given the authority to question if they notice something is incorrect. They should continuously think of the places where flaws may be introduced and bring it to the attention of their supervisors. They should be proactive to address the flaws in the systems and processes, which allow defects to occur. It has been seen that though systems are in place operators have, at times, bypassed system checks with overrides resulting in defects. This indicates a lack of involvement or engagement of the workforce. They are out of sync with the thought process of the management. Having few slogans is good and healthy. It would help to constantly drive the point and keep the team focused otherwise the old saying “out of sight is out of mind” could prove true. But excessive sloganeering and rigid targets could be too stressful and counter productive. C. Audacious Short-term (performance valuation) goals create demotivation for management as well as workforce. They must be avoided. Short term Goals and targets used for performance valuation should be practical, achievable and reasonably challenging. They should be framed keeping the past/current positions and any current limitations in mind. Very aggressive goals could be demotivating and stressful. On the other hand, audacious long-term Corporate Vision goals, could give the business a good direction and enable the management and workforce to align and work together more efficiently.
-
Arunesh Ramalingam replied to Vishwadeep Khatri's topic in We ask and you answer! The best answer wins!Background: Ishikawa (Fishbone) Diagram is a tool used to analyses Causes and their Effect. The Effect is the problem to be solved indicated by the “head” of the fish. While the various possible Causes are brainstormed and listed (categories and sub-categories) on the body of the fish as branches i.e. the “bones”. Hence the name Fishbone diagram. The causes are grouped in categories – Machine, Method, Material, Man, Measurement, Management, Maintenance, Mother Earth (Environment). Subsequently, the various listed causes are given weights indicating their possible contribution to the problem and the team gets an idea of which causes to attack first. It is a very helpful tool: To analyze and find the root cause of complicated problems and the root cause is not clearly visible To get an wholistic picture when there are multiple possible causes for a problem If trial and error and exhaustive “brute force” methods to solve the problem could be expensive and very time consuming Common Misuse of Fishbone Diagram: Using the Fishbone diagram for simple and known problems, which can be fixed without much difficulty Experts in the team may already know a solution to the problem and yet a Fishbone diagram is drawn. Using a single Fishbone diagram for multiple problems/ Effects. Each Problem/effect should have a single Fishbone diagram. Using it in places involving logic and reasoning where decision trees or flowcharts may be more apt. A Fishbone diagram developed for a problem may not be effective if the team size is too small for brainstorming or the team has limited knowledge regarding the process and issue. The causes identified may be limited and may not cover all possible causes.
-
Arunesh Ramalingam replied to Vishwadeep Khatri's topic in We ask and you answer! The best answer wins!Segmentation is the process of diving or grouping a set of large number of similar components (set of entire customer base, set of data points, set of all functional components and so on) into logical sub-groups based on some type of common or shared characteristic. In Root Cause Analysis, segmentation helps to reduces (by elimination) the number of suspected process steps or potential problem spots that may be causing the issue/problem being root caused. Successful segmentation would help in cutting out process steps and functional components that may not be involved in creating the problem. Data items that can indicate the existence of the problem need to be identified and analyzed. When such data points are collected with care then irrelevant steps and components can be removed and the potential source of the problem can be isolated. Example of reducing suspect process steps: If a physical defect or non-conformity is noticed in a finished at some stage in the process, then a visual check on subsequent products at various stages would help identify the problem process. All subsequent process can be removed from the suspicion list. Example for reducing suspect functional components: In software development to identify code blocks that might be causing an issue, prompts (error messages, print statements) are used to track the logic flow and identify code blocks (functional components) that get executed without an issue. After eliminating these, the developer is left with a reduced set of components that needs to be debugged further.
-
Arunesh Ramalingam replied to Vishwadeep Khatri's topic in We ask and you answer! The best answer wins!Cost of Quality = Cost of Good Quality + Cost of Poor Quality Cost of Good Quality (COGQ) 1. Prevention costs (PC): Costs incurred to prevent and minimize defects, rather than finding and removing them later. Examples: Designing and implementing a quality plan, SP, employee Training. 2. Appraisal (Inspection) costs (AC): Costs incurred during the manufacturing process to ensure that the product/service conforms to quality standards and performance levels. Examples: Maintaining team of Quality inspectors, Inspection, Audits, Field Testing, testing equipment maintenance. Cost of Poor Quality (COPQ) 1. Internal failure costs (IFC): Costs incurred to identify defective products/services not conforming to standards before delivery to customers. Examples: Rework, Delay, Rejects, Scrap, Disposal of rejects and scrap, Downtime due to failures 2. External failure costs (EFC): Costs incurred when defective products/services not conforming to standards are delivered to customers. Examples: Warranties, Customer Dissatisfaction, Product Recall, Damaged Good will, Damaged Brand Equity. Increase in investments pertaining to COGQ enhances the Overall Equipment Efficiency (OEE) of the process which is a key Quality KPI. Increasing investments in COGQ may have a multiplier effect to the savings in COPQ, but there will be a point of diminishing returns. I believe, the Equilibrium between COGQ and COPQ is a very delicate balance and would be dynamic one needing constant review and adjustments. In my view, investments done by the management for COGQ helps to build a Quality sensitive culture in the organization. Investments by the management into ERP, PLM, MES, QMS systems and their integration and so on help the workforce understand the underlying emphasis on quality. It helps to get valuable buy-ins from the various stake holders when rolling out enterprise wide quality initiatives. My approach to strike a balance between COGQ and COPQ would vary depending on the initial budget and resources available at hand process knowledge available. Knowledge of quality issues that might come up In case of limited budget and knowledge, I would concentrate incurring more AC and reducing IFC. Once more knowledge is gained regarding the process and defects, I would aim to implement some targeted preventive measures (i.e. PC). With the preventive measures in place if there is a reduction in defects, then I would work on optimizing my AC. I would handle any EFC’s, that may come up, and have a feedback to my PC, AC and IFC expenses. As the business grows, I would implement new technologies as part of increased PC and try to incorporate/build quality into the process to make it “right the first time”. I would still maintain a minimal AC. In case I start with an ample budget and knowledge, my approach would me to implement preventive measures followed by a combination of steps 4 and 5. I would think the best scenario would be one where quality related complaints are close to none the capital investments against COGQ have been recovered. The maintenance costs for systems ensuring COGQ is constantly being repaid by sales revenue and profits are increasing. This would help in making further investments to upgrade the systems ensure COGQ. At the point of diminishing returns any further costs (PC and AC) should be re-assessed.
-
Arunesh Ramalingam replied to Vishwadeep Khatri's topic in We ask and you answer! The best answer wins!I understand, that a Type 1 / Type 2 error or the formulation of the Null / Alternative hypothesis depends on the perspective with which the research question is being pursued. Typically: Null Hypothesis denotes, “There is No Change” or Result After is same as Result Before a modification / change ( any difference is by chance) Alternative Hypothesis denotes, “There is A Change” or Result After is different from Result Before a modification / change. It is research question to be answered. (While formulating the Alternative hypothesis care should be taken to clearly identify what the researcher is trying to prove regarding the “results before” and “results after” i.e. whether the two results are Not equal or Greater or Lesser than one another) So, I feel, that the Null /Alternative Hypothesis statements or Type 1/Type 2 error would switch if the research question /perspective changes. Example: A medicine manufacturer must create a capsule with 50 mg dosage of an ingredient Z. So, it should be ensured that the machine calibration is correct and accurate. Research Question 1: Is the machine calibration inaccurate and the mean dosage of ingredient Z (in the population data) is different than 50 mg? Null Hypothesis: Machine Calibration is accurate and the average dosage of ingredient Z is 50 mg. (population mean dosage = 50 mg). Alternative Hypothesis: Machine Calibration is inaccurate and the average dosage of ingredient Z is not 50 mg (population mean dosage ≠ 50 mg). Research Question 2: Is the machine calibration accurate and the mean dosage of ingredient Z (in the population data) is equal to 50 mg? Null Hypothesis: Machine Calibration is inaccurate and the average dosage of ingredient Z is not 50 mg (population mean dosage ≠ 50 mg). Alternative Hypothesis: Machine Calibration is accurate and the average dosage of ingredient Z is 50 mg. (population mean dosage = 50 mg). So, in my opinion, the research question perspective is very important to formulate the Null / Alternative hypothesis or determine Type 1/Type 2 error.
-
Arunesh Ramalingam replied to Vishwadeep Khatri's topic in We ask and you answer! The best answer wins!DMAIC 8D Type of Tool Continuous Improvement Tool Problem Solving tool Description It is reactive and proactive in nature and is used not only on current, known problems, but identifying and controlling all sources of variation that are of significance to product/service cost and quality. It is a reactive approach, that is used to identify, correct, and eliminate recurring problems. Process Steps and Mapping Define D1 – Plan and Create a Team Measure D2 – Define & Describe the problem -NA- D3 – Define & Implement interim Containment plan Analyze D4 – Identify & Analyse Root Cause D5 – Define Possible Corrective Actions Improve D6 – Implement and validate Corrective Actions Control D7 – Take Prevent action to avoid Recurrence -NA- D8 – Celebrate/Congratulate Team Mapping to Plan – Do – Check – Act Cycle 5 Step PDCA P – Define, Measure, Analyse D – Improve C, A – Control 8 Step PDCA P – D0 to D5 D – D6 C, A – D7, D8 Duration Few months Few days/weeks When to use? Extremely complex and possibly chronic problems that has defeated repeated attempts to solve. Continuously Improve process to avoid future problems, product/service variation reduction and enhance process efficiency. Complex and repetitive problem, that may require immediate correction or “fire-fighting” action In critical problems D3 would stop the bleeding with an immediate interim action, while data is collected for understanding the original problem and Root cause analysis. Example Situations which might need an improvement in the longer run such as complaints regarding Quality issues on products have variations and being out of specification. Large amount of scrap generation Low OEE (Overall Equipment efficiency) KPI on machine lines. High Downtime of equipment Situations which might need immediate attention and a fix / correction such as complaints regarding A system going down repeatedly, Defects observed on the product in the manufacturing line during a shift. Customer complain on a product or a service. A system or process alarm getting generated repeatedly
-
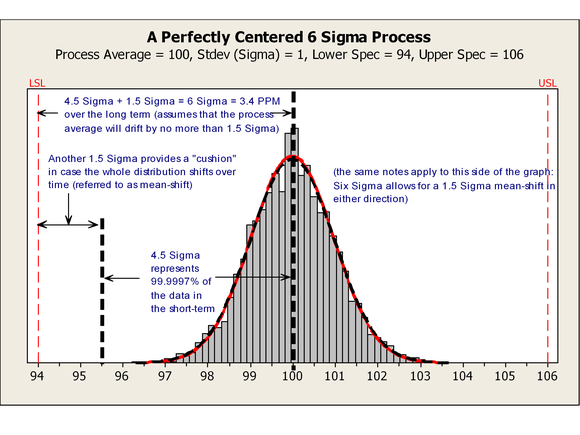
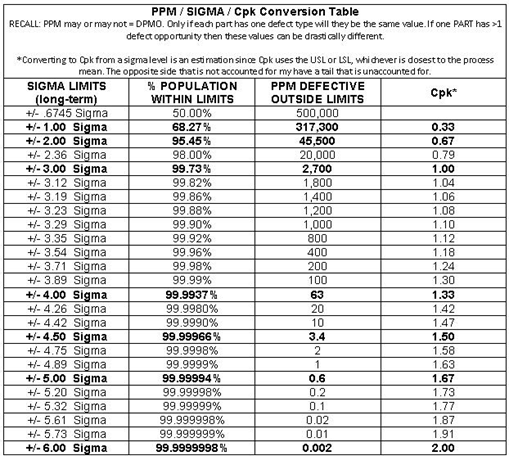
Arunesh Ramalingam replied to Vishwadeep Khatri's topic in We ask and you answer! The best answer wins!In any organization, processes are generally designed for the long term, but most of the times only short-term process data is available. Also, short-term data mostly contains only common cause variation, while long -term may contain both common cause variation and special cause variations. Data collection for long term Sigma level calculation would be very difficult as it would need to be collected from several lots, many shifts, many machines and operators and so on. A reliable estimation of the long-term performance of the process can be made, by estimating the variability that would be experienced over the long term as a function of the short-term variability. This approximation of the drift of the process mean in the long-term can be used along with short-term sigma level to calculate the Long-term sigma level. Why 1.5 Sigma Shift? As indicated in figure below [1], the normal probability distribution predicts a 3.4 defects per million opportunities (DPMO) for a Sigma Level of 4.5 and 0.002 DPMO for Sigma Level of 6. Motorola has determined, through various studies on process data collected for years, that the process average (mean) is likely to shift over the long term by +/- 1.5. The worst-case performance of a process in the long term can be estimated by shifting the short-term process mean by +/– 1.5 and then estimating the fraction of defects i.e. non-conforming to the specifications. If the business could accept that level of defects then the process can be considered capable. This is indicated in figure below [2] References: [1] http://www.six-sigma-material.com/Tables.html [2] https://www.dmaictools.com/what-is-six-sigma/the-15-sigma-shift
-
Arunesh Ramalingam replied to Vishwadeep Khatri's topic in We ask and you answer! The best answer wins!In a data set, an outlier is a piece of data which falls far outside the typically expected variation. It has a marked deviation from other values in the data set. Outliers are an integral and critical part of the data set and they need to be identified and investigated carefully. They can be ignored/removed if and only if it is known or can be concluded with 100% certainty that it was result of error in experiment, documentation and so on. Wrongly removing outliers may result in underestimated variance of the data set. Need to identify an outlier 1. If Outliers are present in a data set, then they can skew or bias the analysis performed on a data set. Example: In a data set of 5 temp readings - 51.5, 51, 52, 51.7, and 80 deg C, then the 80 deg C is an Outlier and skews the average temperature in the data set. 2. Outliers can provide key information. Example: If delivery timing dataset has few outliers, then those outliers may indicate the performance of a particular delivery man. 3. They may reveal a hidden pattern in the data set which in turn, might expose some product characteristic. Example: A device might be malfunctioning and every once in a while, might be giving a bad data. An analysis of a pattern showing the outliers would enable to identify the faulty device. Methods to identify an outlier 1. Box Plot 2. Scatter Plot 3. Histogram
-
Arunesh Ramalingam replied to Vishwadeep Khatri's topic in We ask and you answer! The best answer wins!The "maturity" of a process is an indication of the extent to which the specific process is explicitly defined, managed, measured, controlled and predictable. It indicates the level to which the process is accepted by the organisation and is documented, understood, followed and is effective. In my opinion, the assessment of the maturity level of a process is critical. It may not be a good idea to invest time, resources and energy into Improvement initiatives on inconsistent processes in an organisation. The efficiency or performance issues of the process might be just due to its inconsistency and unpredictability and special improvement exercise may be irrelevant. Any process, that is worth being mapped (process maps) and analysed, needs to have a certain degree of consistency, predictability and discipline or in other words “Maturity”. Various Levels of Process maturity have been defined as follows: 1. Level 1 – Ad-hoc Process Person/Individual dependent – high “Tribal” knowledge Poor or no Control Reactive in nature – “Firefighting” process No or minimal documentation No integration or communication between functions Example: Entrepreneurial / Freelance Business trying to just get things done. 2. Level 2 – Organized -Documented, Managed, Repeatable Process Some level of documentation is maintained Characterised for projects and is often reactive Consistent templates incorporated Some integration with other functions Basic management and control in place to track progress. Process is repeatable Example: Small organisation standardising process to repeat success and measure results. 3. Level 3 – Structured – Defined Process Detailed documentation is maintained Characterized for organization and is proactive Consistent templates incorporated Standardized and integrated with an organization wide methodology Better process control in place to track progress. Example: Organization with standardized documented processes implemented company wide 4. Level 4 – Quantitatively Managed – Measured Automated and Controlled Process Process output is measured and controlled Fully traceable. Measured against goals System driven by ERP and CRM software Example: Large Organizations standardizing and aligning their processes to achieve strategic goals. 5. Level 5 – Optimizing and Continuous Improvement Focus on process improvement and integration Goals are analyzed and improved Outputs constantly measured and monitored for performance. Organization understands their processes well and is capable of conducting experiments and evaluate improvements/benefits Examples: Process undergoing continuous quality improvement via techniques such as Six Sigma, Kaizan,poka-yoke and so on. Ideally a Process at Level 4 would be a good Maturity level. The process is well understood, followed, repeatable, predictable and is at a position where time and energy can be invested to map , analyze and further improve it.
-
Arunesh Ramalingam replied to Vishwadeep Khatri's topic in We ask and you answer! The best answer wins!To identify impactful continuous process improvement activities , the team should listen to four “voices”. These are: Voice of Business (VOB) It denotes the needs, wants, expectations and preferences of the business itself ( or the shareholders, owners, investors of the business) It is obtained from analysis of Financial, competitive and market data. It helps to identify and prioritize future projects and services for revenue growth area, economic value added and market value in line with the strategic goals and objectives of the business. Example KPIs / Metrics are: ROI, shareholder equity, stock prices. Voice of Customers (VOC) It denotes the wants and expectations of business customers (internal and external). It indicates those aspects of the product/service that the customer perceives as “value” and is willing to pay for. It is obtained by observing customer behavior, taking customer satisfaction feedback and analyzing customer complaints. It helps to identify and differentiate between Value add and non-Value add process steps, strategize products and value-added services, modify or discontinue ongoing projects/processes. Example KPIs / Metrics are: release evaluations, customer satisfaction scores, product delivery times, help desk support calls. Voice of Process (VOP) Based on VOB and VOC analysis processes are classified and categorized. It improves the efficiency of processes that drive daily business and helps in categorizing them as high-value (priority) and low-value (non-priority) processes. Customer input provides insights into those processes that are most closely related to providing the products and services that they need, and it helps create the basis for project selection. VOP denotes the performance of a process over a period. The VOP should be within limits defined by VOB and VOC. Voice of Employee (VOE) VOE is critical for the sustainability of the business. It shows the synchronization and coordination between management and workforce in aligning the daily task and activities to the final goal and objectives of the organization. VOE is linked to VOP in that problem areas and improvement opportunities can be identified. VOE can provide valuable information related to resources, costs, talent, processes and solutions that could provide strategic direction. Amongst these, VOB and VOC are mostly independent, while VOP and VOE may have linkages and depend on VOB and VOC. Since VOB and VOC are voices at opposing ends viz. producer and consumer, many times there can be conflicts between them. Possible Causes of Conflicts between VOC and VOB can be understood looking at few conflict scenarios: 1. Cost: VOC would require maximum/best services and products at minimum/cheapest cost. VOB would dictate that the business to sustain and provide share holder value has to make profits from its products and services. The business must find innovative ways to create the balance i.e. satisfy its customers while maintaining its profitability and not becoming bankrupt. 2. Product/Service Features and functionalities: For any product/service VOC would indicate the Needs, Wants and Desires (Kano Model) of the customer. VOB would help decide what features/functionalities can be provided in a product/service in a profitable way. Example: In hotels, customer’s might have an expectation regarding the variety and quality of the complimentary breakfast, but VOB would dictate what the hotel can afford as complimentary which could be either less or more than the customer’s expectation. This gap between VOC and VOB could cause a conflict (dissatisfied customer) or leave the customer in a WOW state. 3. Complaint resolution: VOC might indicate that the time taken for resolution was too long and the time committed for resolution was not adhered to. Also, there was no proper communication regarding the resolution. VOB may indicate that customer’s impatience, and lack of clarity or wrong header/sub-headers in the complaint was the cause of delays. Moreover, non-availability of the customers at the provided contact info lead to communication gap and further delays. 4. Defects and Bugs (especially software services): VOC calls for additional staff count because of increase in defect back log and defects getting pushed to future release compromising some features that were also pushed to future release. VOB calls for Defect back log to be cleared without additional staff count as it would increase the cost. 5. Repairing Services: VOC might call for a manufacturer to provide repairing services of components (like a circuit board) that get damaged in their product when not in warranty, as it would be cheaper. VOB, on the other hand, would recommend replacement of the failed components as it might be a cost intensive for it to maintain a workforce with the skillset to repair components, and ensure proper repair. It would be more economical for it to send service people who just replace the failed component.
-
Arunesh Ramalingam replied to Vishwadeep Khatri's topic in We ask and you answer! The best answer wins!Firstly, I would appreciate their interest in implementing concepts of Lean to eliminate wastes, but I would start with giving them a word of caution that implementing lean is not a onetime exercise but it needs to become a part of the organizational work culture. The management needs to stay committed and be ready to invest time and resources to small continuous improvement activities to see significant returns over time. Without constant monitoring and proper practice, "wastes" will figure out a way to slowly creep back into the process. If a “waste” in the process is evident, then that needs to be eliminated immediately. But, most of the times, wastes in the process may not be readily visible. A detailed study of the AS-IS process would be required. Subsequently, detailed Value Stream mapping and Process mapping charts would need to be developed and analyzed. Once I get the management buy-in and willingness to commit the time and resources, my recommendation, would be as follows: 1. Implement 5S strategy (Sort, Straighten, Shine, Standardize, Sustain) in a selected area. An implementation and practice of 5S would help to identify and bring out few wastes such as Waiting, Motion and Transport. These can be reduced/eliminated creating an organized, clean and high-performance workplace. 5S can provide some quick wins which would be encouraging and motivating to the management and team. 2. Developing detailed Process Maps and Value Steam Maps and Identify Value Add/Non-Value Add/ Essential Non-Value Add or Business Value Add Steps - VA/NVA/ENVA(BVA). The essence of lean implementation of Lean is to identify Value from a customer’s perspective and make all the processes in the system as much of a value add as possible. Any ENVA or BVA process must be optimized. All NVA are “Wastes” and should be removed. Small continuous improvement (KAIZEN) activities should be designed and performed to improve the efficiency of the Value Add steps. With the incremental improvement, the “wastes” would automatically slowly decrement. If the efforts are aimed more at eliminating “wastes” then there is a possibility of introducing more NVA steps or working on improving the existing NVA steps. Hence, the efforts should be directed more towards improving Value Add steps. 3. Developing Mistake proofing methods. This would reduce or eliminate “waste” such as Rejects.
-
Arunesh Ramalingam replied to Vishwadeep Khatri's topic in We ask and you answer! The best answer wins!A data distribution tends to have a central or most typical value. This concentration of value around a central location is called central tendency and is commonly defined as: Mean (Interval and Ratio Level Data) Median (Ordinal Level Data) and Mode (Nominal Level data) A variation or spread is a measure of how much the data points in the data set are close to or away from the identified central tendency. In most applications, it is desired that to have minimum variation or data points close to the central tendency. But in some applications a variation (spread) may be important. Couple of such applications, that I could think of are as follows: 1. Distribution of the Years of Experience /Age of the Workforce in the organization It is always desirable to have a proper mix of all experience levels (spanning from new entrants to mid-level experience to senior level) in the workforce for a proper balance. The distribution of “Years of Experience” should have a variance and should not be around a mean value. Also, if a lot of folks in the workforce is around retiring age then younger people would need to be recruited so that there is no man power shortage. 2. Population age distribution A countries’ population tends to age and become older, and it is necessary that there are enough younger people working and earning the money and paying the taxes to support the economy. So the distribution of age demographics of a country should be ideally spread out.
-
Arunesh Ramalingam replied to Vishwadeep Khatri's topic in We ask and you answer! The best answer wins!Discrete data type would be preferred over Continuous data type in processes where counting, classification, ranking, categorising may be required,instead of just using the raw process data values. A few examples where, I believe, discrete is the preferred data type although continuous data is available are: 1. Calculating Number of defects or DPMO. Discrete data makes sense when we are talking about the number of defects, or the number of defects per million opportunities (DPMO). We might have continuous data showing dimensions of a product, but it might be just sufficient to know if the item is defective or not. 2. Apparel /Shoes Manufacturing. Though Heights and Foot sizes are continuous but the manufacturers create categories (discrete) for production. – Apparels: XS, S, M, L, XL, XXL; Shoes: 3,4,5,6,7,8,9,10,11,12. 3. Kids / Senior Citizen Discounts. Though Age is available as continuous data (in terms of years, months, days and so on) for processes involving age based discounts categories (discrete) are used: Kids – below 8 years, Senior Citizens- above 65 years. 4. Speed Tickets Penalization. Speed is continuous data but while determining if a driver was speeding and deciding the quantum of penalty, the data is treated as discrete i.e. 5 kmph above speed limit, 10 Kmph above speed limit, 20kmph above speed limit and so on.
-
Arunesh Ramalingam replied to Vishwadeep Khatri's topic in We ask and you answer! The best answer wins!“Tribal” knowledge is important information/knowledge (that could be related to process, service, repair, troubleshooting, diagnostic procedures, sales, competition, customers, costs and so on) that is known to only certain individuals or groups of individuals within a company, but it is undocumented and is not common knowledge to everyone. It is lost when the people having the knowledge leave the organization and move on. Sometimes knowledge is so deeply ingrained, that it becomes part of the way things are done and it becomes an unconscious competence. This kind of knowledge /skill is good for an individual like a stock trader or a sportsman, but not practical if in a company as others in the team need to learn the method or process. Tribal knowledge increases the reliance on a single individual for critical operations and is a common and dangerous pitfall. If there is an ageing workforce, replacing 55 years of age or older people when they retire, is a big problem especially in the manufacturing industry, because they are the most experienced and skilled people working in the manufacturing plant. The knowledge base they've built over decades of experience is priceless and will go with them when they retire. In this constantly evolving technology world, knowledge within an organization should be captured, stored and maintained, so that team members and future employees can have quick and sustained access to it. To ensure continuity of operations, every manufacturing company needs to assess both the documented knowledge and the undocumented “tribal” knowledge. They need to identify the "tribal knowledge gurus" in the company and "download" the knowledge from the gurus' brains, and document it, before it is lost when the guru retires or moves on. So, I believe, utmost importance should be given to efforts related to unlocking, capturing and harnessing “Tribal Knowledge” before it is lost. Methods for unlocking, capturing and harnessing “Tribal Knowledge”: 1. Identifying the “knowledge gurus” or the most knowledgeable employees. Every company has a few so called “knowledge gurus” in every department who are a reservoir of knowledge. They are generally the “go-to” people for any suggestions, advise or tips. These employees are invaluable to the company and capturing this knowledge from them should be a high priority. 2. Identifying the valuable tribal knowledge. After identifying the “knowledge gurus” the specific tribal knowledge needs to be identified. Example a field service expert might have some very good knowledge regarding service tips, repair tricks, and machine idiosyncrasies, diagnostic procedures and so on. A sales expert might have undocumented information on key customer contacts, decision makers, information on Competition, upcoming projects and so on. Some of the tribal knowledge may be applicable to future replacements and some may not. So the required tribal knowledge must be identified. 3. Committing the Time/expense required to document and transfer knowledge. Once the required tribal knowledge is identified the documentation and transfer of this knowledge involves both time and cost. The management must be willing to make this investment which could be recursive and long term. 4. Transitioning older/retiring workers who might be the knowledge store house. Developing training and transition programs where experienced workers close to retirement can sharing or transition their knowledge experience and skills to the next generation. 5. Developing Staffing strategy for “knowledge gurus”. Developing a staffing strategy to allow retired “knowledge gurus” to work part time as employees or on a contractual basis, while teaching their replacements. 6. Promoting a feeling of job security in the organization and rewarding knowledge sharing. Sometimes employees, to ensure job security and making them indispensable, could withhold information and put themselves in the position of being the only person who knows how to fix a problem or perform a task. By promoting a sense of job security and rewarding knowledge sharing, a company can prevent such situations. 7. Implementing Companywide Knowledge Management Systems. Knowledge management may provide large benefits. Organizational learning and development becomes a big challenge as the company grows. Without proper management of critical information, employees (both retiring and resigning) may leave with valuable tribal knowledge. New employees learning their roles without proper guidance results in tremendous wastage of time, and inefficient and inconsistent knowledge of the processes. Knowledge management systems help accumulate the power from the entire organization and use it to incrementally improve daily operations.
-
Arunesh Ramalingam replied to Vishwadeep Khatri's topic in We ask and you answer! The best answer wins!Rational Subgrouping is a process of grouping items that were produced under the same set of conditions to measure the variation between the subgroups and within Subgroups. It is a “snapshot” of the process over a very small-time window i.e. samples taken in a time-ordered sequence. The variation measured within a Subgroup is Common Cause variation. The variation measured between Subgroups is Special cause variation. A Rational Subgroup helps an excellence practitioner to differentiate between common cause and special cause variations in a control chart and make corrective decisions when the charts are plotted using a sample of the data from the process. Without utilising the concept of Rational Subgroup, I feel a excellence practitioner would not be able to: Make correct decisions using control charts plotted with a sample of the process data. Correctly distinguish between common cause and special cause variations Example of Ration subgroup creation (1): Consider two Machines – X and Y with Operators 1 and 2 respectively producing a product say, metal disks. Rational Subgroup 1 will be, say, 10 random disks picked from Machine-X Operator 1 in the 1st of production. Rational Subgroup 2 will be, say, 10 random disks picked from Machine-Y Operator 2 in the 1st of production. (2): Consider two Machines – X and Y and Shifts A and B and the following production schedule: Machine X -> Shift A -> Operator 1 Machine X -> Shift B -> Operator 2 Machine Y -> Shift A -> Operator 3 Machine Y -> Shift B -> Operator 4 Rational Subgroup 1 will be, say, 10 random disks picked from Machine-X Shift A Operator 1 in the 1st of production. Rational Subgroup 2 will be, say, 10 random disks picked from Machine-X Shift B Operator 2 in the 1st of production. Rational Subgroup 3 will be, say, 10 random disks picked from Machine-Y Shift A Operator 3 in the 1st of production. Rational Subgroup 4 will be, say, 10 random disks picked from Machine-Y Shift B Operator 4 in the 1st of production.
-
Arunesh Ramalingam replied to Vishwadeep Khatri's topic in We ask and you answer! The best answer wins!Some of the qualities that I could think of, a Project Sponsor should possess in order to ensure that a Business excellence culture thrives in the organization: 1. Change-leadership skills. They should be open to accepting and drive change and relentlessly challenge the status -quo. 2. Decision making capabilities. They should have the ability to make decisions. Once the data, analysis and recommendations are ready, they need to make the decision and steer the team in the correct direction. Sometimes depending on the social political and economic factors within the organization they may need to fine tune the recommendations. 3. Influencing capability. They should be able to influence the people. They should be authoritative to make the decision and influence the resources that decision/project might affect. Effective sponsors should develop their listening skills, and empathy. They should be personable, as they would need to build a rapport, to influence. Being boorish would backfire later. 4. Effective Communicator. They should be skillful in communicating up to the Board, down to the project manager/project team members and with peers across departments. The need to articulate the benefits of the project and should be able to answer questions and justify the project to others. They should be open to listening to criticisms to discuss with the project team. 5. Well organized. An organized approach helps a sponsor to be a better communicator because being organized helps to have the data information to support arguments. 6. Understanding of the Business. The sponsor should have a good understanding to effectively link projects towards the strategic goal of the organization. 7. Motivating. A good project sponsor should be able to motivate and engage people on the project team, regardless of what their personal drivers are, to do a good job and to participate actively at work. 8. Conflict Resolution/People Skills. Any improvement project would have resistance and conflicts. A sponsor should be adept in handling and resolving conflicts to keep the team moving in the right direction.