
Topics
-
The latest setback has fueled worries that Google was losing momentum just as OpenAI and Anthropic and a host of Chinese rivals have accelerated the pace of model releases. On the call on Wednesday, Pichai struck an unusually defensive tone as analysts pressed him on the state of Google's frontier models and whether they could still compete at the cutting edge of AI development. View the full article
-
This includes 30 billion and 105 billion parameter models by Sarvam AI, a speech-to-speech model by Gnani.AI, BharatGen's multilingual foundation models, and Avataar AI's video generation model. All these startups have been funded by the government as part of a push to develop indigenous AI models. Of the 20 models, five have been released so far. View the full article


Leaderboard
-
R Rajesh
Members2Points160Posts -
Vishwadeep Khatri
Administrators1Points6,717Posts -
Radhakrishnan Annamalai
Lean Six Sigma Green Belt1Points10Posts -
Mudita
Members1Points10Posts


.thumb.png.3dc86d42a4fc134fca3d71d67dbbcae0.png)
Popular Content
Showing content with the highest reputation on 12/31/2024 in Posts
-
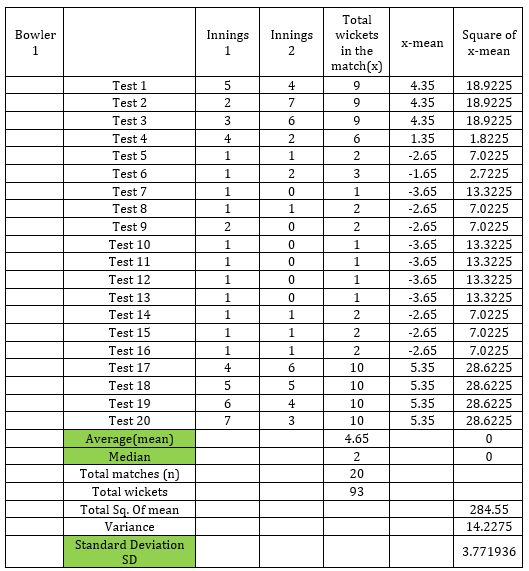
2 pointsReason for ignoring Measure of dispersion 1. The first and foremost reason I could think of is because of our natural awareness of mean and median (taught as part of your elementary mathematics in school days) and coupled with the fact that it is easy to calculate both mean and median 2. Awareness on Standard deviation and Range is relatively low for people in general (even though they might have learnt in their high school education) and these terms are usually known for people who are associated with any statistical related work or who show passion in statistical concepts or so. An additional pointer for a statistically aware person is that Standard Deviation can be lesser sensitive to outliers when compared with mean, Range is highly sensitive to outliers. 3. People are just focused on the representative value around which the data clusters and does not bother about the variability involved in that (lack of awareness is the key as they are not aware of how important that variability factor is). Impact in decision making: Ignoring the measure of dispersion can result in not understanding 1). the variability or the actual spread of the data 2). the outliers that exist in the given dataset Example 1: Let us try to see these impact with an example. We are considering here about how the data looks for a cricket bowler for just a small sample of 20 test matches (pls refer to the attached excel sheet). We want to see how the bowler's performance is over this period of 20 test matches.. As you can see the bowler's performance is good in the beginning of his/her career and then in the middle period, it is not looking good .. But in the latest matches that the bowler has played, it shows the bowler has taken good no. of wickets.. So barring the first and last few matches, the bowler has not performed well as shown by the mean which says for every match, the bowler is taking 4 wickets. So with mean , it is sensitive to outliers. If you look to the median, it shows the value as 2 which means it is not taking those few first and last matches where the bowler has taken more wickets... Now if we look at the holistic view of the bowler's performance in all the matches played, there is a lot of inconsistency (variability) in the middle phase for the bowler that is not captured by mean but Standard deviation shows the value as 3.77. Even as this does not seem to be a significant difference when compared with the value of 4 (for mean) in this case, this gets drastically changed when the bowler performs well in some of the middle phase matches [changing values, say in few rows (from any of the rows - 9 to 20) in column D&E in the excel sheet can see a drastic change in the difference between mean and Standard Deviation values]. As we see here, mean is much sensitive to outliers and does not portray the true picture. Standrd deviation is relatively lesser sensitive to outliers and shows the variability. Example 2: If we are to find the month in which the peak & least sales of cars were sold for a car dealer (for a particular brand of car), using the Range can help us get the data easily. By ignoring this measure of dispersion(which is highly sensitive to outliers), we will loose the ability to get this data in an easy manner
 2 points
 -
1 pointQ 733. When summarizing continuous data it is important to report both measure of central tendency (such as mean or median) and measure of dispersion (such as standard deviation or interquartile range). Still organizations, teams and people often emphasize and only report the measure of central tendency and ignore the measure of dispersion. What are the reasons for ignoring the measure of dispersion? How can this adversely impact decision making? Provide examples to support your answer. Note for website visitors - This platform hosts two weekly questions, one on Tuesday and the other on Friday. All previous questions can be found here: https://www.benchmarksixsigma.com/forum/lean-six-sigma-business-excellence-questions/. To participate in the current question, please visit the forum homepage at https://www.benchmarksixsigma.com/forum/. The question will be open until Tuesday or Friday at 5 PM Indian Standard Time, depending on the launch day. Responses will not be visible until they are reviewed, and only non-plagiarised answers with less than 5-10% plagiarism will be approved. If you are unsure about plagiarism, please check your answer using a plagiarism checker tool such as https://smallseotools.com/plagiarism-checker/ before submitting. All correct answers shall be published, and the top-rated answer will be displayed first. The author will receive an honourable mention in our Business Excellence dictionary at https://www.benchmarksixsigma.com/forum/business-excellence-dictionary-glossary/ along with the related term. Some people seem to be using AI platforms to find forum answers. This is a risky approach as AI responses are error-prone because our questions are application-oriented (they are never straightforward). Have a look at this funny example - https://www.benchmarksixsigma.com/forum/topic/39458-using-ai-to-respond-to-forum-questions/ We also use an AI content detector at https://quillbot.com/ai-content-detector. Only answers with less than 45-50% AI-generated content will be approved.1 point
-
1 pointReasons for Ignoring the Measure of Dispersion Calculating central tendency and representing it is easier than measures of deviation. Due to treating measures of deviation as complex, stakeholders tend to focus more on simpler metrics like mean and median. Knowledge about the importance of these metrics may not be present within an organization. The interpretation of such metrics and their importance in understanding variability may not be known or acknowledged. Basing the decisions on assumptions that the data is closer to the central value without using dispersion to validate the finding. Organizations may also remove these calculations intentionally to show better results and profits. Adverse Impact on Decision-Making There could be misrepresentation of data where due to negating or leaving out dispersion organisations may show inflated profit or revenue. VK Sir gave an example that illustrates how an unfair distribution may result if we simply display the mean salary without accounting for the range of wages. In project management, resource and time allocation may not be successful if we merely consider the average time needed to accomplish activities without considering how they will be distributed. Without standard deviation being taken into account, if we base our decisions solely on the mean or median of the data, we tend to miss out on doing a complete risk assessment of any new strategies or projects. In the end we can say that ignoring measures of dispersion leads to oversimplification, missing out on variability, and an increase in incorrect or flawed decisions. Reporting both central tendency and dispersion gives us the full picture of what the data represents, which in the end leads to better decisions.1 point
-
1 pointSome team members or leaders in the organization do not report measures of dispersion for the following reasons: Reporting only the mean or median, presuming it is the best practice or easiest. Lack of knowledge about calculating the standard deviation and interquartile range (IQR). To exclusively portray positive outcomes of the central tendency to management or clients, rather than underlying negative trends such as variance, IQR, etc. Reporting only the measure of central tendency which will have an impact on decision making are: Incorrect conclusion since the dispersion measures like variability and IQR are excluded Uncovered potential risks since the outliers are ignored Incorrect forecasts since the underlying trends and patterns are not reported Example: For Client X, a team of four experienced and three new data abstractors are working. Each of them abstracted 200 images per month. 10% of their work is sampled the team's Median score is reported as 85%. Based on these results, the client approved onboarding three more new data abstractors to scale up the resources for their outsourced work. Since the measure of dispersion is not reported, it resulted in the incorrect decision of allocating a few more new data abstractors while the existing new data abstractors maintained low accuracy. However, on reviewing the measure of dispersion, it is noted the Inter Quartile Range (IQR) is 45%. Client X Sampled Correct Incorrect Accuracy Experienced Employee 1 20 20 0 100% Experienced Employee 2 20 19 1 95% Experienced Employee 3 20 18 2 90% Experienced Employee 4 20 17 3 85% New Employee 1 20 12 12 60% New Employee 2 20 10 10 50% New Employee 3 20 8 8 40% Overall 140 104 36 74% Q1 – Lower Quartile Part in the above-given data (Median Score of New Employee 1, 2, 3) – 50% Q2 – Median of the above-given data (Score of Experienced Employee 4) – 85% Q3– Upper Quartile Part in the above-given data (Median Score of Experienced Employee 1, 2, 3) – 95% IQR = Q3 – Q1 = 95% - 50% = 45%1 point
-
1 pointOrganizations, teams and people often emphasize and only report the measure of central tendency and ignore the measure of dispersion primarily due to two reasons a) Low Statistical literacy and b) Unethical behaviour A person in the organisation with low or no Statistical literacy would not know that ‘Standard deviation’ all alone is meaningless without context, and it must be considered relative to the mean (For instance, a standard deviation of 100 could be large if the mean is 100 but small if the mean is 1 billion). Similarly, such individuals may may not recognise that the simplest numerical measure of dispersion in a data set that he/she is dealing with is the range. Instead, a range would be looked at potential capability of the team or the process. For example: Assuming every employee can match the performance of the best 1 out of 1000 employees (e.g., Mr. ABC with 5% errors, minimum or Mr. XYZ with INR 1M sales, maximum). Average is looked at the ‘favourite number’ as its easier to understand and communicate to a broader audience, compared to dispersion measures like standard deviation or interquartile range. Unethical behaviour can be the second reason, where people wilfully choose an inappropriate summary measure (for example, reporting the mean for a very skewed set of data without any measures of dispersion) to distort the facts to support a particular position. Here is an example of reporting the measure of central tendency and ignoring the measure of dispersion and how did it adversely impact decision making In Banking, Tele sales executives are responsible for generating revenue overphone,they are given tele calling data base in spreadsheets, while data analytics team would have segmented the clients basis various criteria. However, client allocations are rarely random. In most tele calling teams, the average is looked at as a metric and the highest among the tele calling executives are rewarded . From the below table it looks like Agent B has the highest revenue average and also the total but the standard deviation is the highest fo B .Upon closer inspection, it becomes evident that Agent B is capitalizing on a loophole by focusing excessively on affluent clients, who tend to have higher credit card limits and larger loan eligibility amounts. Had measures of dispersion like standard deviation been reported alongside the mean, these suspicions would have been triggered earlier & such unethical practises may not have continued to distort the facts to support a particular position which in this example is about the loophole of calling & engaging with Affluent clinets disproportionately. This highlights the importance of considering measures of dispersion like standard deviation alongside central tendency metrics. Failure to do so can lead to poor decision-making, unfair rewards, and overlooked systemic issues Category Agent A Revenue (INR) Agent B Revenue (INR) Avg 498.85 525.85 Stdev 6.682853157 36.64664126 Total 9977 10517 Count of General clients engaged 16 6 Count of Affluent clients engaged 4 14 Daily performance of A and B Day Agent A Revenue (INR) Agent B Revenue (INR) Agent A Client Type Agent B Client Type 1 503 592 General Affluent 2 499 527 Affluent General 3 505 539 General Affluent 4 511 482 General Affluent 5 498 515 General Affluent 6 498 540 General Affluent 7 511 492 General General 8 505 550 Affluent Affluent 9 497 513 General Affluent 10 504 525 General General 11 497 513 General Affluent 12 497 606 Affluent General 13 502 535 Affluent General 14 487 496 General Affluent 15 488 567 General Affluent 16 496 490 General Affluent 17 493 544 General Affluent 18 502 462 General General 19 494 486 General Affluent 20 490 543 General Affluent1 point

This leaderboard is set to Kolkata/GMT+05:30