
Topics
-
Humanoid, a UK robotics firm, secured $152 million in Series A funding. This investment fuels the development of next-generation platforms and proprietary AI software. The company plans beta robot deployments at customer sites later this year. Humanoid has established partnerships with major technology and manufacturing companies. Bosch will serve as the contract-manufacturing partner for the new robots. View the full article
-
German authorities warned Tuesday of the "growing influence" of AI and digital technology on the sexual abuse of children, saying in a report that criminal abusers are increasingly using those tools. Sexual abuse of minors is "increasingly shifting to the digital realm," driving overall statistics "upward", said Holger Muench, the head of Germany's Federal Criminal Police Office (BKA). View the full article


Leaderboard
-
ArvindSwarup
Lean Six Sigma Black Belt1Points5Posts

Popular Content
Showing content with the highest reputation on 10/10/2023 in Posts
-
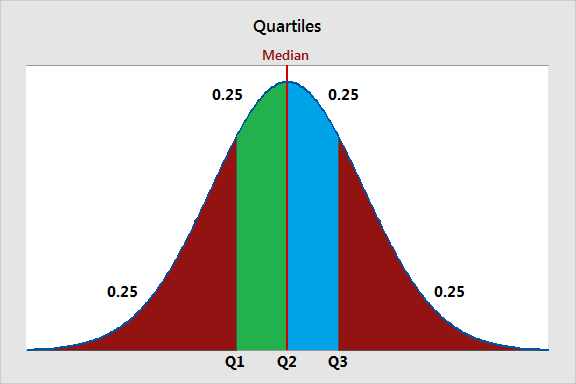
1 pointQuartiles are three values that split your dataset into quarters. The three quartiles are the top quartile (Q3), the middle quartile (Q2, also known as the median), and the bottom quartile (Q1). They are used to understand the distribution of data, identify outliers, and summarize the central tendency and spread of a dataset. Quartiles are commonly used in data analysis, visualization, and identifying data points that fall outside the typical range. The bottom quartile, Q1, is the 25th percentile of a dataset. It represents the data point below which 25% of the data falls. Example a dataset of QA scores for 100 agents. If Q1 is 60, it means that 25% of the agents scored below 60 QA score in quality/call monitoring. The middle quartile, Q2, is the 50th percentile of a dataset, also known as the median. It represents the midpoint of the data, where half of the values are above, and half are below. Example in same dataset of QA Scores of 100 agents if Q2 (median) is 75, it means that 50% of the agents scored below 75 QA score, and 50% scored above 75 QA score. The top quartile, Q3, is the 75th percentile of a dataset. It represents the data point below which 75% of the data falls. Example In the QA score dataset, if Q3 is 90, it means that 75% of the agents scored below 90 in call monitoring. Also, in typical call center scenario audit sampling targets are determined based on qualities. For example, the agents falling in bottom quartile for their QA scores will have higher audit samples (3-4 audits per agent/ per week) as compared to the mid & bottom performers (1-2 audits per agent/ per week)
 1 point
This leaderboard is set to Kolkata/GMT+05:30