
Topics
-
AI News from ET - AMD to invest up to $5 billion in Anthropic; AI startup to buy up to 2 GW of chips
AMD has been seeking to expand its foothold in the fast-growing AI chip market as developers look to diversify beyond Nvidia, while Anthropic has been racing to secure computing capacity to meet growing demand for its AI services. View the full article -
A Meta Platforms lawsuit claims AI tools unfairly targeted employees for layoffs. Workers face difficulties proving AI discrimination due to limited access to internal processes. Arbitration agreements often prevent collective legal action and public scrutiny of workplace disputes. These hurdles explain the scarcity of high-profile AI employment lawsuits. Meta denies using AI for layoff decisions, stating humans made all choices. View the full article


Leaderboard
-
Rakesh Naik 1
Members1Points12Posts -
Pradeep Shukla
Members1Points20Posts -
Sarala
Members1Points11Posts


Popular Content
Showing content with the highest reputation on 07/14/2023 in Posts
-
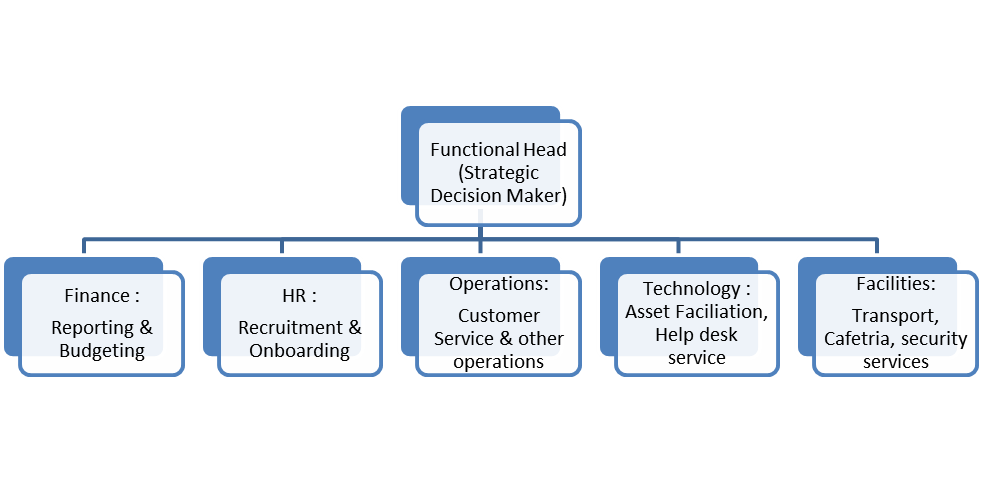
1 pointOrganizational Chart – These charts explains the reporting structure, the hierarchy model in the organization. Organization charts lists who leads whom internally. The organizational chart lists down the employees by department, location, function and does not provide the detailed view of what these teams actually do. Organizational charts shows the Front line units, Middle management and Top level management and so on in the organization. In order to define the roles and responsibilities of the tasks that needs to be done, the Accountability charts are created. Types of Organizational charts – 1. Hierarchical organizational chart – In this organizational chart, team members typically communicate with the person they report to and anyone who reports directly to them. One person or a group reports to the top of them (reporting manager) and they report to the top of them and so on. 2. Sequential organizational chart – This chart contains the top administrators and the workers and this is also known as horizontal organizational chart. Dotted reporting hierarchy is applied. 3. Matrix organizational chart – This chart represents when the individuals have two line of reporting managers. Example of the Organizational Chart (Hierarchy) - Accountability Diagram/Chart explains the roles and responsibilities of specific functions within an organization for every individual. It provides clarity about the ownership of the work assigned. These charts avoids confusion in the work a particular individual function needs to do in an organization. Every task is assigned accountability for an individual to perform. Types of Accountability charts – 1. Flat Organization Accountability chart – Everyone in the organization reports to one single person the CEO or Director or the organization. 2. Function based Accountability chart – Accountability is grouped basis the tasks and the work the teams do and the complete team works for the same function. 3. Product based accountability chart – This chart is based on the product type and the product leader leads the individuals with various functions within the product groups. 4. Geographic based accountability chart – Basis the location of work operation, the groups are created and defined. Example of the Accountability Chart (Function based) - Accountability chart effectively helps teams move through the stages of team formation quickly as the team works for the same functional goals. Initially, the team members are not aware of each other; however, the accountability diagram helps in collaborating the team to complete the tasks. This chart helps defining individual roles on what they are responsible and accountable to do. The accountability chart keeps the complete team on a same page and work towards specific goal though their roles and responsibilities are different. Using RACI matrix, the roles and responsibilities of the individuals are defined where in the tasks and deliverables are listed. Always ensuring there is someone responsible and accountable for every task to avoid any fail. This accountability chart makes the decision making and communication flow easy. Every individual in the team knows what they role is in an organization and what are the activities/tasks they have to perform.

 1 point
 -
1 pointAccountability Diagram An accountability diagram, generally known as RACI chart. It is a very useful diagram to fulfilment of any project, process, or organization. In this diagram we mention the role and responsibilities of individuals who are related or concerned with any ongoing project, process, or organization. It is a kind of visual representation of roles and responsibilities. RACI or Accountability diagram: (R)– Responsible – People who are involved in fulfilment of project. They are responsible to complete a task or project. (A)-Accountable – People who are directly responsible for task or project and they have ownership to take a decision related to project. Generally, one person accounted for one task in project. (C)- Consultant – The group of people who can be approachable for consulting for related project. They are generally stakeholders who can provide their valuable insight on project whenever required. (I) Informed – The group of people who should be informed regarding progress of any project. An accountability diagram generally uses for creating a clear framework of accountability of every individual who are involved in project. It can establish an effective and good decision-making process and have ability to complete the project on time due to established responsibilities. Accountability diagram Vs Organization Hierarchy chart Accountability Diagram Organization Hierarchy Chart Purpose Its purpose is very clear. It clarifies the roles and responsibilities of individuals who are related to a project. It generally defined the actual hierarchical structure of an organization. Focus It generally focusses on specific task or project. It more focus on aligning roles related to a specific project within an organization It generally focuses on formal structure of an organization. It includes reporting line and job titles. Information provided It provides the information regarding assigned projects and tasks only. It provides the information regarding relationship and levels of management within organization. Communication It supports communication related to specific project only It generally serves as understanding of formal structure of organization. An accountability diagram is more useful tool to facilitate the progress of any project through the different stages. Which hare below. Forming – In this stage, people are getting to know each other who are part of that project. Also, they defined roles within the team. Storming – In this stage, people generally discuss their challenges and struggles related to specific project in which they are aligned. Norming – In this stage, people try to set their expectations. It promotes team members to support each other to achieving the specific goal of a project. Performing – In this stage, people take ownership of their task and try to complete and fulfil their responsibilities within timeline. Overall, an accountability diagram support people to help each other to mitigate conflicts and try to establish good relation and collaboration within team to achieve project goals.1 point
-
1 pointAn Accountability Diagram is similar to a RACI matrix. It defines the relationships between individuals or roles within a team or organization based on their areas of responsibility and accountability. Visual representation helps in identifying the individuals easily. An Organization Hierarchy Chart displays the reporting relationships within the organization. On the other hand the Accountability Diagram focuses on specific responsibilities and accountability of individuals or roles. This is the major difference. An Accountability Diagram can be used to get the team to move through the stages of team formation quickly, by virtue of the below: Provides Clarity: The diagram helps in telling individuals what their tasks are and what they have to do at what specific times. Eliminates Ambiguity: It helps in not carrying out any activity that is not supposed to be done by a specific individual. Fosters Trust: Since each individual understands each others responsibility, there is trust. It also encourages co-operation. Effective Communication: Each individual can easily identify the appropriate person to approach for information, clarification, or feedback, streamlining communication and ensuring that information flows smoothly. Reduces Confusion: The Accountability Diagram specifies decision-making and escalation matrix within the team. Since it indicates the direct responsible people or people who have authority to decide on important matters, it reduces confusion and simplifies approach to these people. Improves team bonding: Since each team member knows each others strengths and weaknesses, they can assist each other, thereby improving team bond.1 point
This leaderboard is set to Kolkata/GMT+05:30